


Square
Following
Hot
News
Profile
Share your thoughts
placeholder
Article
$INJ continues to rise strongly
Buy at 8.30–8.05; targets 8.56, 8.72, 8.90; stop-loss 7.85
post-image
INJ+11.45%
From October 1 to October 16, all subscription trade records had only one loss, but the direction never changed, and we nailed it perfectly. Real-time trades basically entered and exited with pinpoint precision, and we have been profitable every day. The most important thing in futures trading is position management, not gambling. Ant King, open your dog eyes and see clearly what real strength is—defaming other streamers is not a skill
Nothing says privacy like walking around with a phone with the Ledger logo on the back
post-image
Insiders are quietly stacking shorts on BTW while the 1h ATR screams volatility.

$BTW /USDT - SHORT

Trade Plan:
Entry: 1.875069 – 1.928019
SL: 2.155704
TP1: 1.710924
TP2: 1.583844
TP3: 1.393224

Why this setup?
Why now? The daily trend is range-bound, which favors mean reversion and gives the short bias a structural edge. The 15m RSI sits at 49.09, hovering just below neutral and signaling that momentum is not yet oversold enough to invalidate a pullback. The 1h ATR of 0.1059 confirms that the asset is in a high-volatility phase, making the entry zone between 1.875069 and 1.928019 a preci
BTW-21.83%
🚨 JUST IN: MSCI is reportedly set to REMOVE Michael Saylor’s Strategy $MSTR from its indexes. 👀
The move could impact institutional funds that track MSCI benchmarks.
MSCI+2.49%
MSTR+5.58%
$ZEC The altcoin king is a money printer—stay steady, hold spot through the bull market. It feels incredible
ZEC+8.07%
Trade is actually an old script. In the 1980s, Japan’s economy was at its peak, with GDP reaching nearly 70% of the United States’, while its semiconductor industry was putting immense pressure on the US. Japan also wanted to improve relations with China and bring China in to counterbalance the US. What happened? The US launched a combination of measures: the 1985 Plaza Accord forced the yen to appreciate; the 1986 US-Japan Semiconductor Agreement forced Japan to open its market and restricted its exports; and the constraints of the US-Japan security alliance kept Japan firmly in line. From th
post-image
AAPL-0.31%
On October 16 $ETH , the ETH strategy is actually very similar to the BTC view; both are headed in the same direction, as discussed during the livestream.
Currently, 2545 is the resistance level. After the decline from the October 7 starting point, there was a natural rebound high when the price fell to 2545. This high, 2586, is tentatively set as an anchor point. From the price action, 2545 was broken and reclaimed twice. The second time, the price did not touch the area above 2545, so we will enter short in the area of selling pressure here, taking shorts in the 2500–2530 range.
The hard sto
post-image
ETH+1.62%
  • 2
Analysis of Gold XAU, BTC, ETH, etc.
Beijing Time October 16, 2026
Key News Today
• U.S. initial jobless claims came in at 199K (expected 200K, previous 198K), slightly below expectations, with the labor market remaining relatively tight.
• After hotter-than-expected September CPI, U.S. Treasury yields and the dollar briefly strengthened, but yields fell and the dollar weakened today, while gold rebounded from lows of 4073–4085 to around 4170.
• Shipping attacks in the Strait of Hormuz continue, alongside Iran's new tactics and Houthi attacks on Saudi targets. Combined with a sharp decline
XAUUSD-0.06%
$NEAR NEAR Breaks Out of a 4-Year Descending Channel: TP1: $11
NEARUSDT
Weekly Time Frame:
NEAR (1W, log scale) is breaking out of the descending channel that has defined price action since the 2022 top, and the weekly candle is now pushing above the upper boundary.
What the chart shows:
After the 2022 high (~20.6), price spent years in a descending channel, bottoming around the 0.9 area in early 2026.
Since that low, price has risen sharply and is now trading at ~5.4, above the channel’s upper trendline.
The breakout is happening at the 2024 volume profile POC (~5.2), so the trendline and a h
post-image
NEAR+9.19%
Bitcoin Whale That Sat Through Every Crash Since 2020 Just Moved $377M
A Bitcoin whale moved 4,581.94 BTC, worth roughly $377 million, to five new addresses on Oct. 12. The transaction confirmed in block 971,126 around 18:37 UTC, when Bitcoin was trading near $82,350, and it paid a fee of just 732 satoshis — about 60 cents.
The coins have been sitting in the wallet since March 2020, when they arrived in a transaction that split a 5,081.95 BTC balance three ways. At roughly $8,830 per Bitcoin, the 4,581.95 BTC landing in the wallet was worth about $40.5 million. The value of the Bitcoin has nea
post-image
BTC+0.98%
Biggest #Altseason starts any day now.
GET READY 🚀
post-image
$QNT
A steady grind lower all the way, with longs liquidating longs—everyone trying to catch the falling knife got buried.😤 A rebound to 213.7 is the window to escape; if 201.8 breaks, it will head straight down. Don’t wait until the waterfall comes to run.
post-image
QNT+0.98%
all my goats at the top of the lb
post-image
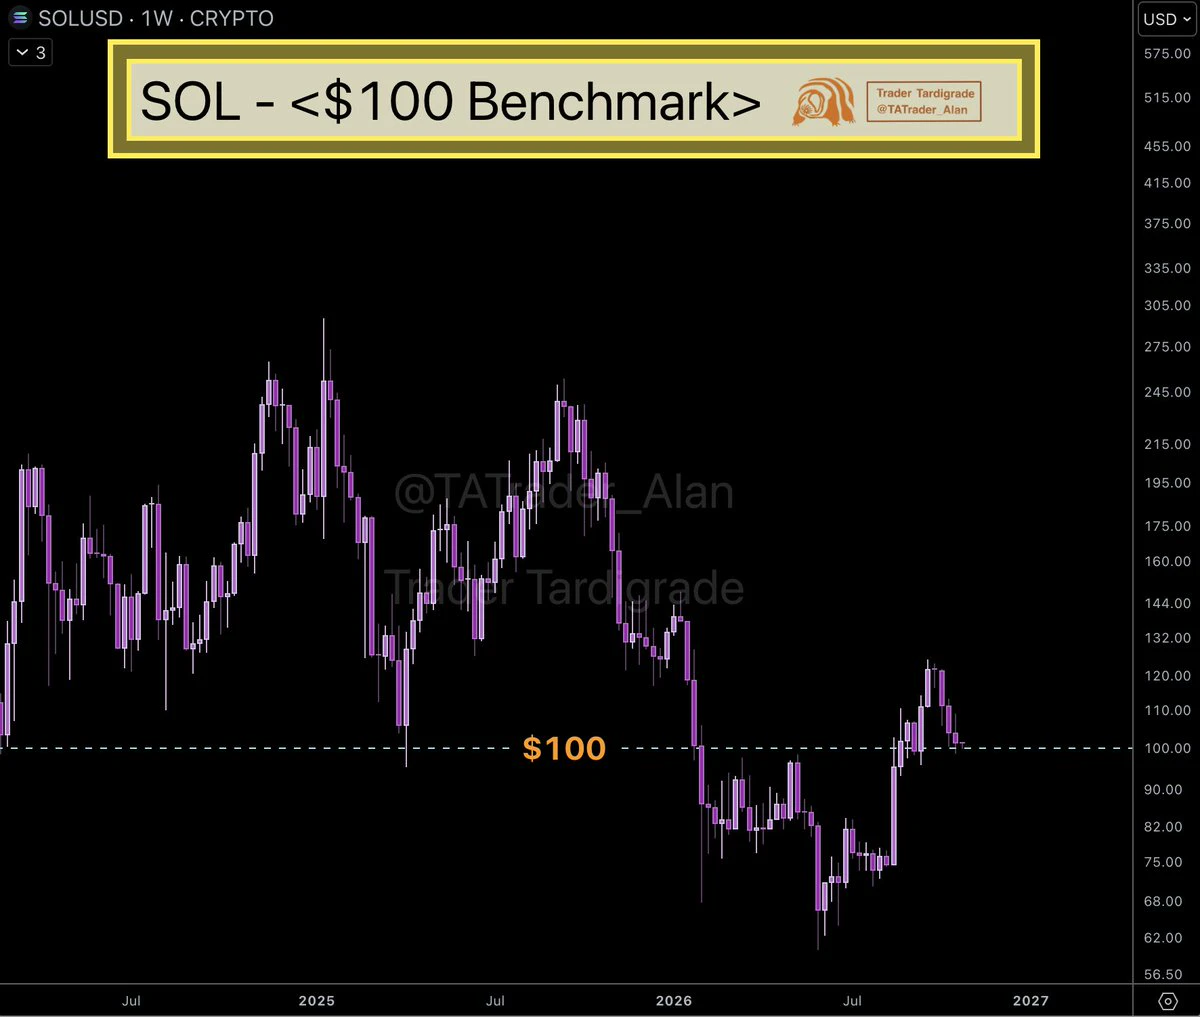
$SOL At this level, the market will most likely make a major move tomorrow. The funding rate has stayed positive for three consecutive days, with longs continuously paying interest to shorts. In this kind of structure, either a short squeeze sends prices surging, or the funding rate collapses first and the price follows. The same applies to ZK: whichever comes first, privacy or scaling, will gain pricing power. It’s still early. So what’s the conclusion? I haven’t figured it out yet either. Those watching it, keep an eye on #SOL.
post-image
SOL+1.21%
ZK+11.07%
An unpopular take: $INJ ’s current +10.99% gain is not as conclusive as it looks.
$INJ is currently at 8.423, up +10.99% over 24 hours. The 1-hour support is 7.061, resistance is 8.562, and current volume is 0.77 times the average volume of the past 20 periods. What is truly useful in these numbers is where 7.061 and 8.562 are containing the range.
This is where I currently stand: I acknowledge that the trend is strong, but what matters next is not how much higher it can surge, but whether buyers step in during the first pullback. The 1-hour trend is strong, with an RSI of 86; the 4-hour trend
post-image
INJ+11.45%
$ICNT Investment trade: Looking back at the content published earlier, Target 2 has now been reached. We still have room to 0.15–0.20.😎$KORU
post-image
ICNT+24.55%
KORU-4.94%
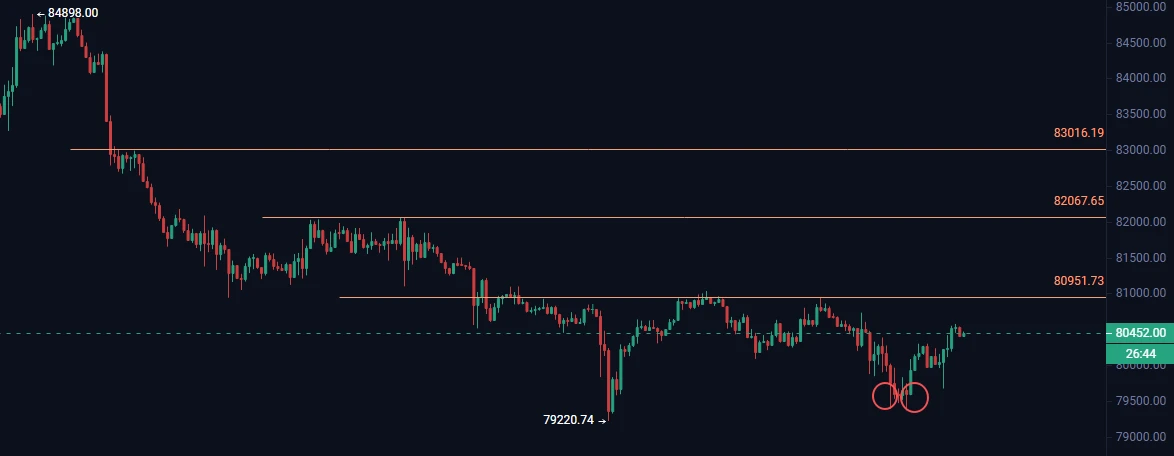
October 16 $BTC Strategy: Based on the current market, BTC's upward movement is being blocked by the 84200 resistance level. We continue to expect a pullback in the near term, but the decline has not been deep.
Do not rush to buy the dip. Open short positions in the 83500-84000 range, with a stop loss at 84500 (the starting point of the decline on October 7). If a solid bearish candle continues to break below 81800, keep the stop loss at breakeven.
Wait for a new low to appear. Reduce short positions in the 79200-78000 range and look for an opportunity to enter long positions.
post-image
BTC+0.99%
🔹Whale Dumps BTC and Loads Up on ETH! After selling 237.8 BTC and buying 7,929 ETH, is big money be
live-cover
LIVE70
Load More

Join 40 M users in our growing community

⚡️ Join 40 M users in the crypto craze discussion

💬 Engage with your favorite top creators

👍 See what interests you

Trending Topics

USSeptemberPPIBeatsExpectations

91.35k Views1.88k Discussing

US September PPI came in at 6.3% YoY, well above the 5.3% market expectation, pointing to renewed producer-side inflation pressure. Weekly jobless claims were 199K, broadly in line with forecasts. Could hotter inflation further reduce room for rate cuts, and what does it mean for $BTC, US stocks, and gold?

DrLinHanSpeaksAtOxfordUnion

135.63k Views1.86k Discussing

JapanAndKoreaStocksPlunge

47.27k Views1.76k Discussing

View More