Share your thoughts
placeholder
Article
All I can say is that flomo has really gone downhill.
Even if they couldn't display it properly, they shouldn't have displayed these characters...
If it wants to make money, it has to keep adding all sorts of messy features to attract attention, so it can no longer remain small and elegant.
For example, the AI feature—I’ve already cut it from the note-taking app I made myself.
Because you can have an Agent like Codex do the analysis, which is much more useful than using this app for analysis.
Putting an Agent inside the app is truly the stupidest approach.
post-image
#HYPEBreaks88HitsNewAllTimeHigh
HYPE/USDT: correction or pause before next leg?
Current price: $83.82 (-3.09% in 24h)
24h High: $87.39 / Low: $83.48
Volume: 352.29K HYPE (turnover $30.01M) – below average (last bar 51.65K vs MA5 344.24K)
Technical indicators (from chart):
· EMA5: 84.02 → price slightly below, indicating short-term weakness
· EMA10: 82.57 / EMA30: 74.53 → price still above both, confirming medium-term uptrend
· BOLL(20,2): UB 93.99 / MB 78.64 / LB 63.30 → price in upper half but closer to mid-band; not overextended
· MACD: -0.11 (DIF 5.91 < DEA 6.02) → bearish crossover, momen
post-image
HYPE-2.17%
  • 5
Everyone’s staring at $BTC /USDT’s range—but this quiet 4h setup is the loudest signal we’ve had all week.

$BTC /USDT - SHORT

Trade Plan:
Entry: 79449.24 – 79630.28
SL: 80408.78
TP1: 78887.99
TP2: 78453.48
TP3: 77801.71

Why this setup?
- 1D is trapped in a range, yet the 4h bias flips SHORT with 55.4 conviction.
- Price is hugging the 4h EMA at 79,539.76, but RSI (15m: 43.89) shows momentum is fading—not crashing, just leaking.
- ATR (1h: 362) is tight, meaning the breakout, when it comes, will be violent.
- Why now? We’re armed at the exact midpoint of the range—not chasing, but p
BTC-1.59%
Everyone’s staring at $H /USDT’s bounce—but the 95% confidence short says that’s the trap.

$H /USDT - SHORT

Trade Plan:
Entry: 0.08147 – 0.08219
SL: 0.08528
TP1: 0.07924
TP2: 0.07752
TP3: 0.07493

Why this setup?
Why now? The 4h structure is screaming lower, not higher.
- 1D trend: firmly bearish—no reversal signal yet.
- RSI (15m) at 54.16: weak pop, not momentum.
- ATR (1h) 0.001437: tight range = building pressure for a breakdown.
Entry zone 0.08183–0.08219 is the last resistance before TP1 at 0.07924. If we lose 0.07944 invalidation, this short dies—but until then, gravity win
H+6.49%
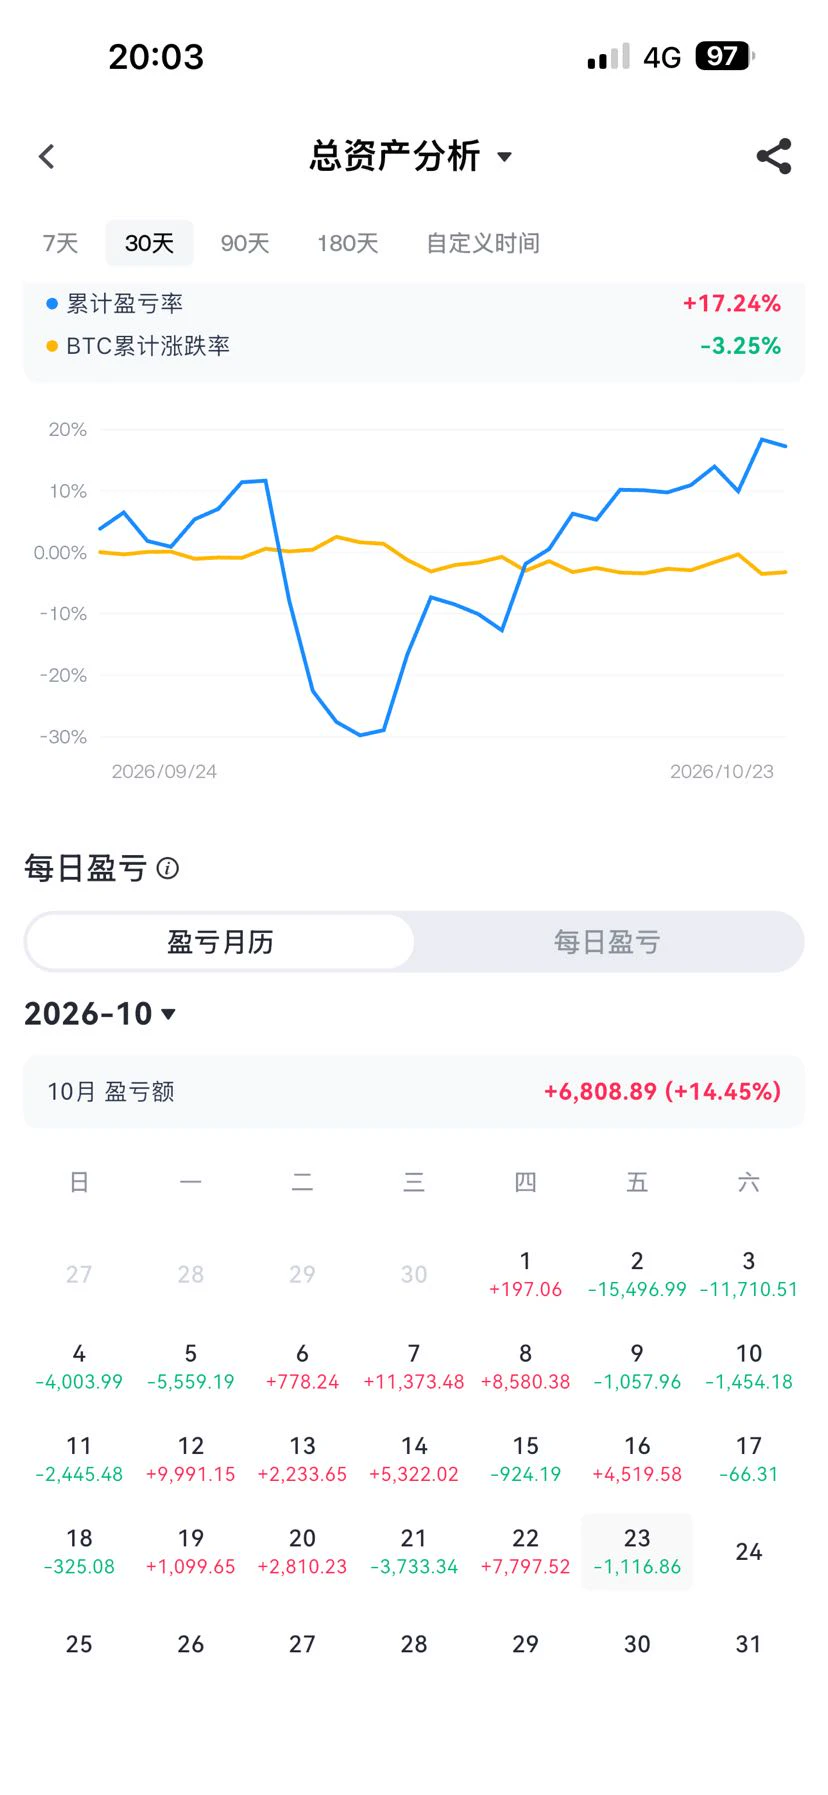
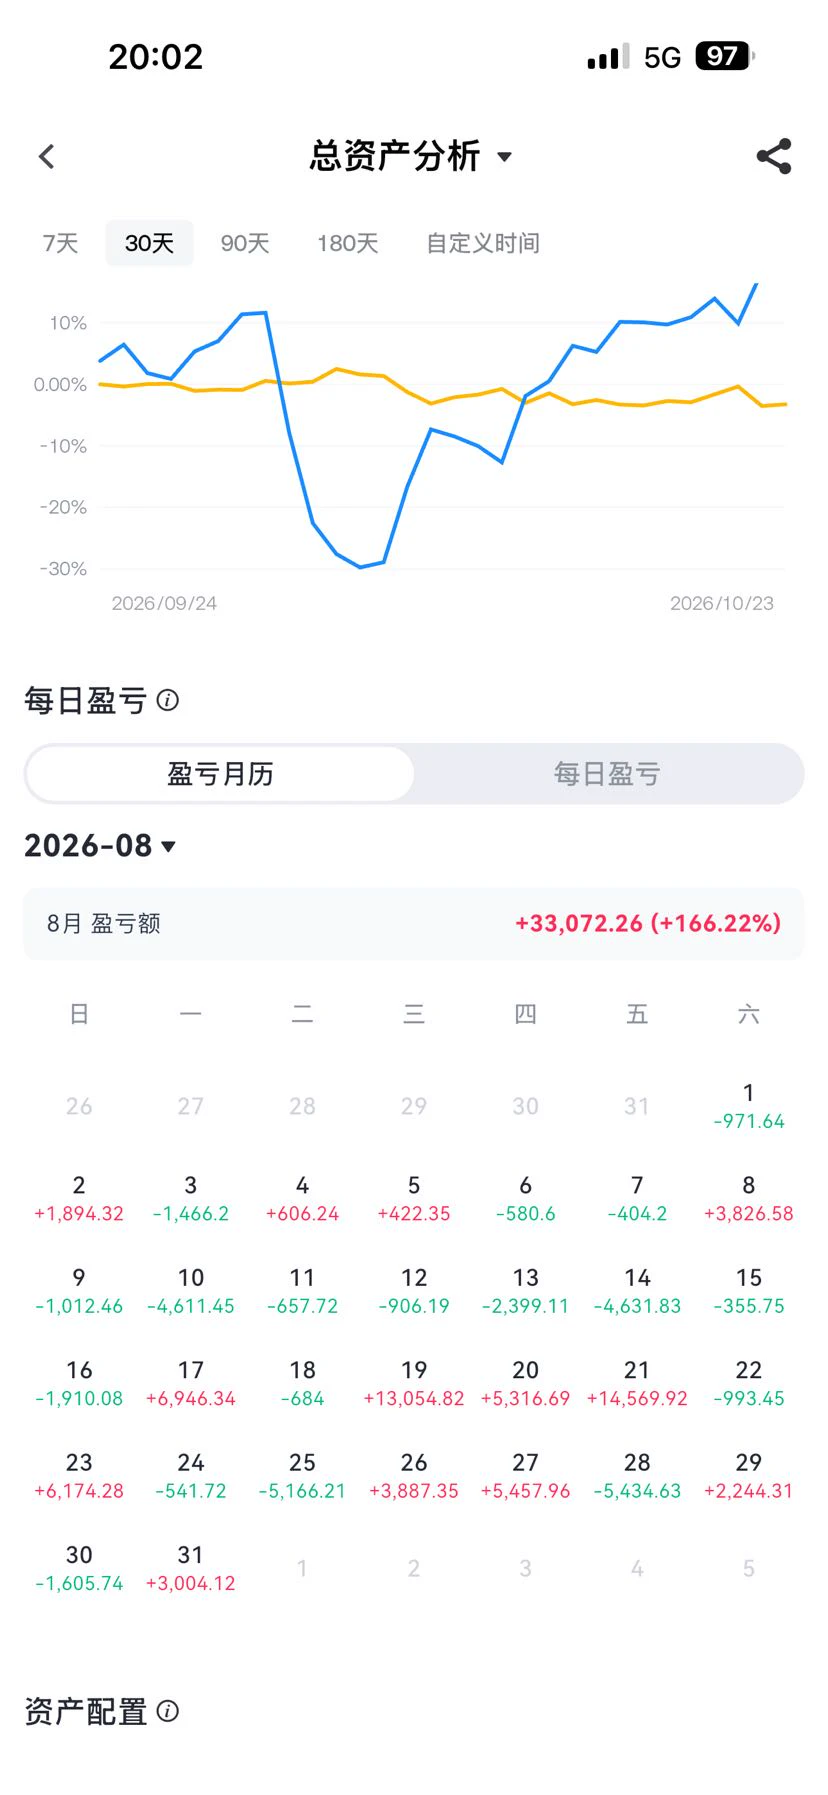
On Fomo, it’s basically winner-takes-all—more insane than futures.
Even earning $2,000, I’m already ranked 2,000th.
There are probably at least several hundred thousand users on here.
The proportion of people losing money is extremely high; only a tiny number of top players take it all.
post-image
The bullish and bearish scenarios alternated in the lead during the early period, reflecting intense tug-of-war; after September 4, expectations of a surge to 2600 briefly pulled far ahead before quickly retreating; currently, the probabilities of 2600 and 2300 are very close, while expectations of an upside move to 2700 remain weak.
post-image
A few days ago, my hand trembled as I set the stop-loss, only to realize this morning that the filial piety was unnecessary. The last thing I saw before bed was $MSTRX consolidating around 129.26, but funds were already quietly moving in and volume was gradually building. I judged this to be the calm before the launch and directly placed a long order. Looking again now, the price has reached 141.8, and my account return is +466.41%. I caught the rhythm of this move—the long period of grinding beforehand has finally paid off. Staying out of the market is not a sin; opening positions recklessly
post-image
MSTRX-0.32%
SOL-1.72%
XRP-3.22%
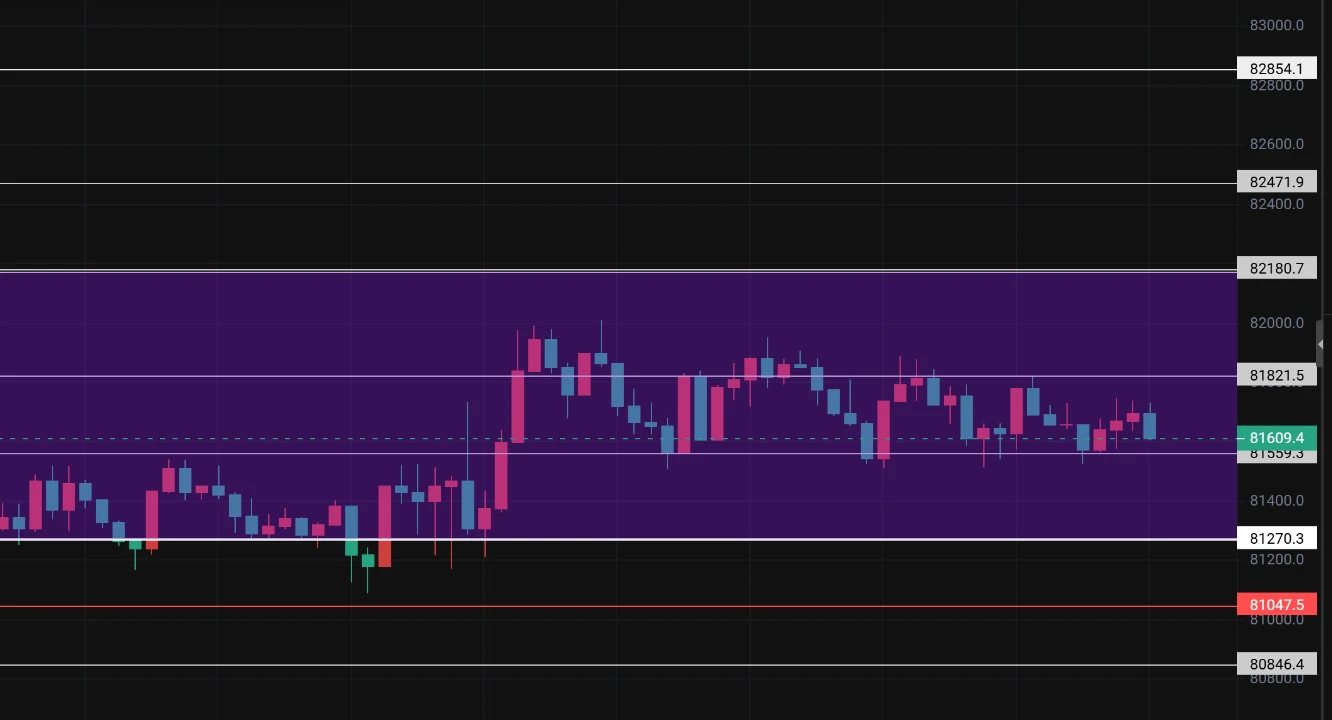
9.5 BTC Market Trend: Silk Road Analysis
Long: If the pullback holds above 79100‑79300, enter a small long position
First target: 79700‑79800; if it breaks through, look toward 80500
Defensive stop-loss: 78700
Short: If the rebound reaches 79800‑80000 but meets resistance and fails to rise further, enter a small short position
First target: 79400‑79200; if it breaks down, look toward 78800
Defensive stop-loss: above 80300
Range-bound shakeout market; avoid chasing rises or selling into declines
The current market is in a repetitive range-bound pattern, with opportunities for bo
post-image
BTC-1.59%
ETH-2.35%
$BNB is breaking out accumulation box on daily timeframe 👀
History repeat itself, $bnb outperform the market after $BTC & $eth rally, Expecting Massive Bullish Wave 📈
Free Signals:
#Crypto #BNB #BNBUSDT #BNBCoin #cryptocurrency
post-image
BNB0.00%
BTC-1.58%
ETH-2.34%
Violent whipsaw after nonfarm payrolls overnight, ETH surged and plunged—how should we respond now?💛
Last night, after the nonfarm payrolls data was released, the market went on a roller-coaster ride.
ETH quickly plunged from 2547 to a low of 2431, then rapidly recovered after the sharp drop. It is currently oscillating within the 2440‑2460 range.

The one-hour EMA has formed a death cross, and the short-term rebound continues to face resistance at 2465.
The liquidation heatmap clearly shows that heavy selling pressure has accumulated in the 2480‑2500 area above, making it a strong resistanc
post-image
ETH-2.35%
🚨 INSTITUTIONAL MONEY IS STILL FLOWING INTO CRYPTO.
BlackRock ETFs bought $117.4M in Bitcoin and $57.8M in Ethereum, while U.S. spot Bitcoin ETFs saw nearly $987M in weekly inflows.
BLK-0.37%
BTC-2.35%
ETH-2.49%
#GateTops7DayNetInflowsGlobally
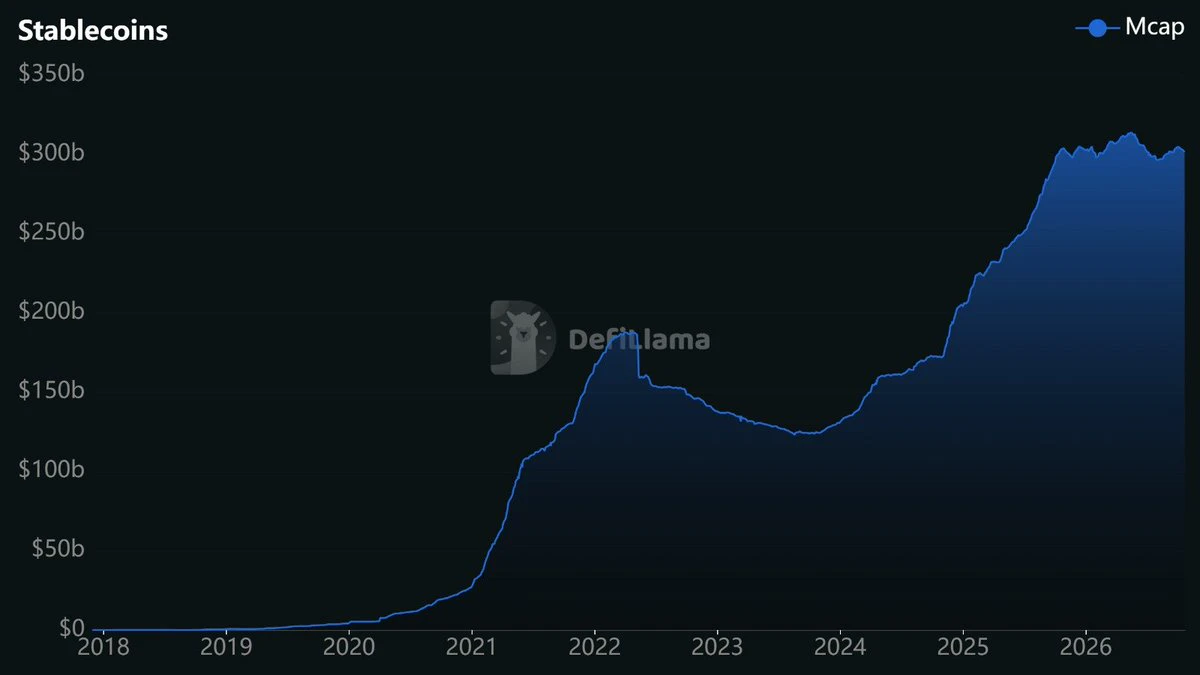
GATE CROSSES $300M IN 7-DAY NET INFLOWS
Gate has recorded approximately $300.43 million in net capital inflows over the past seven days, placing it among the top three globally according to the latest DeFiLlama-based data. The figure is significant because it shows that capital movement toward Gate has remained strong even while the broader crypto market is dealing with elevated volatility and changing macro expectations.
WHAT DOES $300M+ NET INFLOW ACTUALLY MEAN?
Net inflow is not simply the amount of money entering an exchange. It represents the difference b
post-image
Falcon_Official
#GateTops7DayNetInflowsGlobally
Gate is making a strong statement through capital flows. According to DeFiLlama data, Gate recorded approximately $273.72 million in net capital inflows over the past 7 days, placing it among the top three centralized exchanges globally. For an exchange, this is more than just a large number on a dashboard—it shows that a significant amount of capital has moved onto the platform after accounting for outflows.
The important word here is “net.” If users deposit $500 million but withdraw $226 million during the same period, the net inflow is roughly $274 million. That means the headline figure is measuring the difference between money coming in and money leaving, rather than simply counting deposits. This makes a sustained positive seven-day figure a useful indicator for understanding where exchange liquidity is building.
A seven-day window is particularly interesting because it filters out some of the noise that can appear in a single day. One large transfer can make a 24-hour ranking look impressive, but maintaining strong net inflows across an entire week suggests broader activity. Capital may be arriving for spot trading, derivatives, portfolio repositioning, new listings, hedging or simply to keep funds ready for opportunities.
There is another reason this number deserves attention. Exchange inflows should never be interpreted as an automatic bullish signal for the entire crypto market. Coins moving onto an exchange can eventually be used for buying, but they can also be deposited for selling or hedging. The stronger interpretation comes when capital inflows are combined with trading volume, price action, stablecoin liquidity and user activity. In other words, inflow tells us where capital is moving; market behavior tells us what that capital is actually doing.
Gate's broader flow picture also adds context. DeFiLlama data cited by Gate showed approximately $520.45 million of net inflows over the past month, ranking Gate third among centralized exchanges globally. The seven-day figure therefore fits into a larger story of meaningful capital movement rather than appearing as an isolated one-day event.
For traders, this is the part I find most interesting. If strong net inflows continue while trading activity expands, liquidity becomes an increasingly important part of the Gate ecosystem. More available capital can support deeper market participation and provide traders with greater flexibility when volatility creates opportunities. But if inflows rise while prices weaken sharply, the interpretation becomes more complicated because those funds could be positioned for selling or defensive strategies.
The recent data also shows how quickly rankings can change. Another September 3 snapshot from DeFiLlama placed Gate's seven-day net inflow at $78.19 million and ranked it first among global centralized exchanges, highlighting that exchange-flow figures can move rapidly as deposits and withdrawals change. The key takeaway is therefore not to treat one snapshot as permanent, but to watch whether positive capital-flow momentum continues over multiple periods.
For Gate, the $273.72 million seven-day net inflow is still a notable milestone. It puts the exchange firmly on the global capital-flow radar and gives the community another metric to watch beyond simple trading volume. If the next weekly readings remain positive and are accompanied by stronger activity, that would make the trend considerably more meaningful.
Capital follows opportunity, but the smartest signal is not simply seeing money arrive. The real signal is seeing whether that capital stays, participates and contributes to sustained market activity.
@Gate_Square
repost-content-media
BTC-1.58%
  • 5
Arbitrum ethereum:0xb50721bcf8d664c30412cfbc6cf7a15145234ad1 bridge TVL just hit an ATH at $23B
post-image
ARB-3.38%
ETH-2.34%
Everyone’s staring at 0.212, but the real trap is the 55% confidence nobody wants to discuss.

$ADA /USDT - SHORT

Trade Plan:
Entry: 0.211 – 0.213
SL: 0.218
TP1: 0.208
TP2: 0.205
TP3: 0.200

Why this setup?
Why now?
- 4h frame leans SHORT, but 1D is range—so this isn’t a breakout, it’s a scalp.
- RSI 15m at 61.57 shows short-term heat, not exhaustion; the pullback to 0.208 (TP1) is the first magnet.
- ATR 1h (0.0024) is tight—expect a slow bleed, not a crash.
- Invalidation sits at 0.210, meaning we’re already inside the danger zone. Don’t chase the entry; wait for the retest.

De
ADA-3.98%
This is literally me screaming God Morning so that neighbours will hear well.
Gm Everyone
post-image
$MARSCOIN Signal】1H hugs EMA20, bulls defend and counterattack
$MARSCOIN 1H MACD histogram -0.0038, bearish momentum is still expanding, while the price is holding above EMA20 at 0.1748, with buyers not allowing a breakdown.
4H Bollinger upper band 0.2173, with the bands extremely wide open; the price is far from the middle band at 0.1191, and short-term volatility remains elevated. Volume has contracted for three consecutive candles, and chasing higher has slowed.
Order book depth imbalance -7.19%, with sell orders slightly heavier, while the OI trend remains stable, with no large-scale exit
post-image
MARSCOIN+44.09%
today market insight
live-cover
LIVE1,239
“Content Creators” Among 60 Million
Among Gate’s 60 million users, I probably belong to the group that “loves writing.”
I like posting on the Square. Writing market analyses, sharing trading experiences, and reflecting on lessons from losing money. Sometimes, after finishing a post and reading it again, I think, “So this is what I was thinking at the time”—writing is the best way to review and reflect.
And there are genuinely people on the Square who read, comment, and tip. That feeling of “my views have been seen” makes me even happier than making money from trading.
Each of Gate’s 60 million
MU+5.89%
Elon Musk Accidentally Shills a Memecoin???
The SLINK token just went on a wild “roller coaster” ride, hitting an $80 million market cap before crashing more than 80% after a single post was deleted.
The frenzy began when Shivon Zilis reposted a post containing the contract address and Elon Musk replied, but the price went into freefall right as she deleted the post; more than 30 insider wallets that accumulated early had already taken profits of over $4.7 million, achieving returns of more than 1,200x.
A classic memecoin scenario: insiders dump and pocket millions, while the remaining liquidi
MEME+9.26%
Load More

Join 40 M users in our growing community

⚡️ Join 40 M users in the crypto craze discussion

💬 Engage with your favorite top creators

👍 See what interests you

View More