Share your thoughts
placeholder
Article
BTC update
live-cover
LIVE1,139
Everyone’s chasing the bounce, but the 4h chart is quietly screaming a different name for FLOCK.

$FLOCK /USDT - SHORT

Trade Plan:
Entry: 0.07219 – 0.07477
SL: 0.08583
TP1: 0.06422
TP2: 0.05805
TP3: 0.04878

Why this setup?
Why now? The 1D trend is *range*, not reversal—so this isn’t a breakout. RSI 15m at 42.51 shows weak hands, not accumulation. With ATR 1h at 0.0051, volatility is compressing right under the 0.0735 resistance. The primary setup targets 0.0642 (-12%) and 0.0580 (-21%), with invalidation only below 0.0497. The alt (long) path is armed but lower probability—this is a short
FLOCK+34.40%
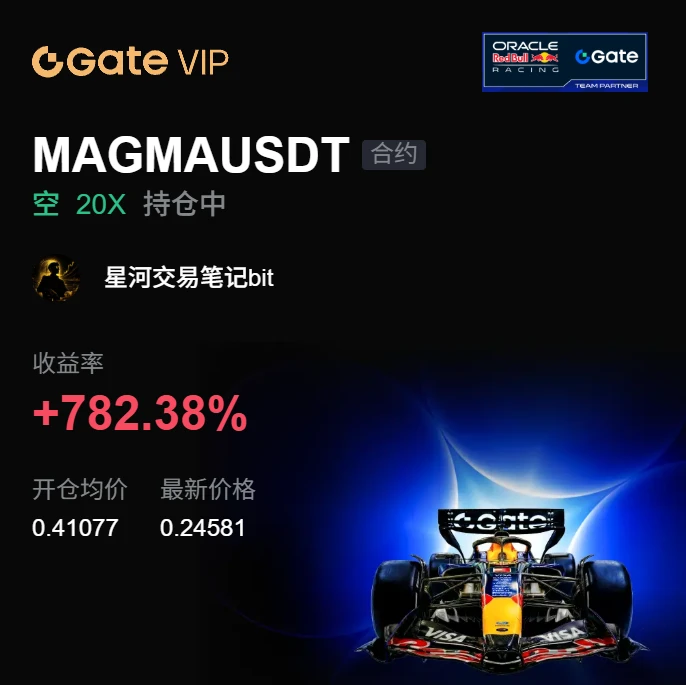
When I saw that high-level candlestick with surging volume but stagnant price, I realized the balance between bulls and bears had begun to shift. After placing a limit order to enter a short position, I did not rush to monitor the market. Several small rebounds along the way tested my ability to hold the position. As planned, I took profit on the +779.55% position first to lock in profits, then moved the protection level for the remaining position above the entry price. In the end, I captured +779.55% from this pullback. The hardest part of shorting is not entering but waiting. Even when the d
post-image
DOGE+2.74%
SOL+3.85%
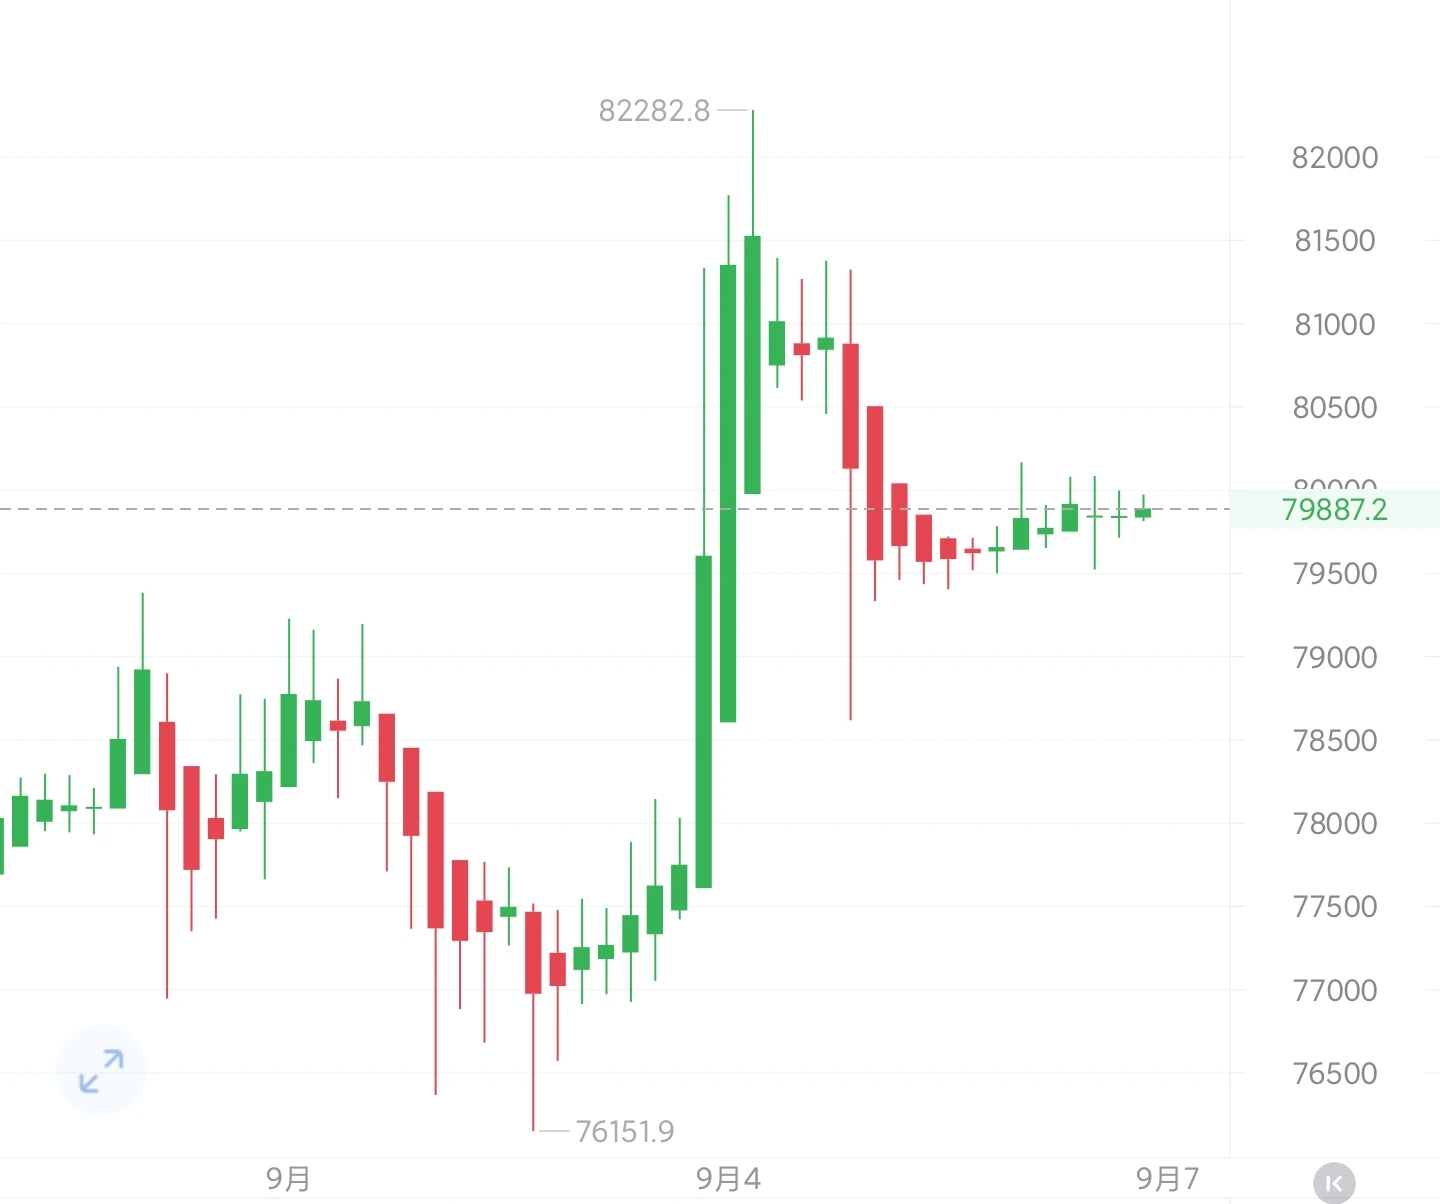
After recently pulling back from the highs, BTC has entered a narrow-range consolidation and recovery phase, with the overall bullish structure intact.
After the earlier rally met resistance and retreated, the market has digested the bearish nonfarm payrolls sentiment. Trading volume is now contracting, with bulls and bears entering a brief balance. This is high-level washout consolidation during an uptrend, not a weakening reversal.
Short-term indicators are consolidating and recovering, with neither a continuation of the strong rally nor a deep breakdown to the downside.
The market is curren
post-image
BTC+0.28%
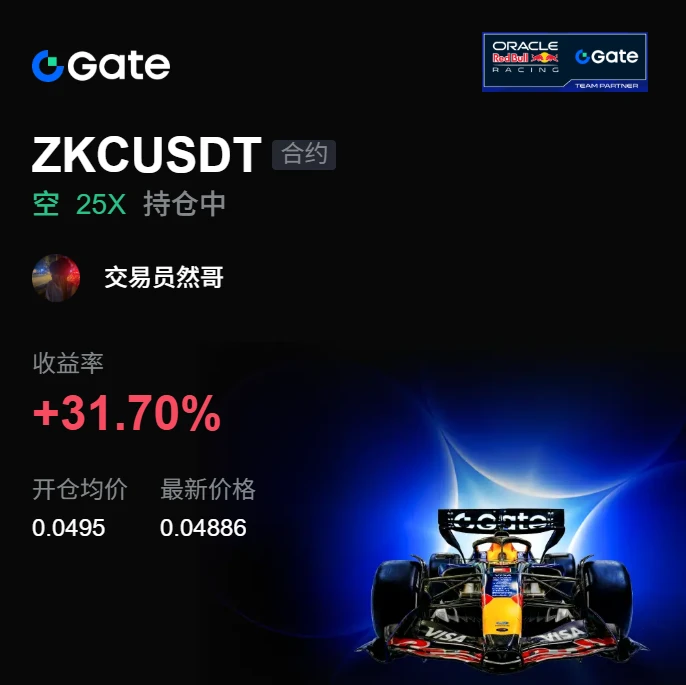
Is this really a rebound? It’s CPR for my empty account, isn’t it? 💨 This $ZKC selloff feels incredibly satisfying to hold a short through.

With the screen glowing green, most people were looking for a bottom, while I was waiting for a signal that the rebound was over. It spiked to around 0.04950, failed to hold after two pushes, and kept losing momentum as it rose, with clear resistance above. I followed in and opened a short, without expecting much. The price ended up dropping to 0.04886, leaving me with unrealized gains of +31.7%—a very satisfying profit.

I closed 70% first, moved the
post-image
ZKC-1.33%
LAB-3.59%
BTC+0.27%
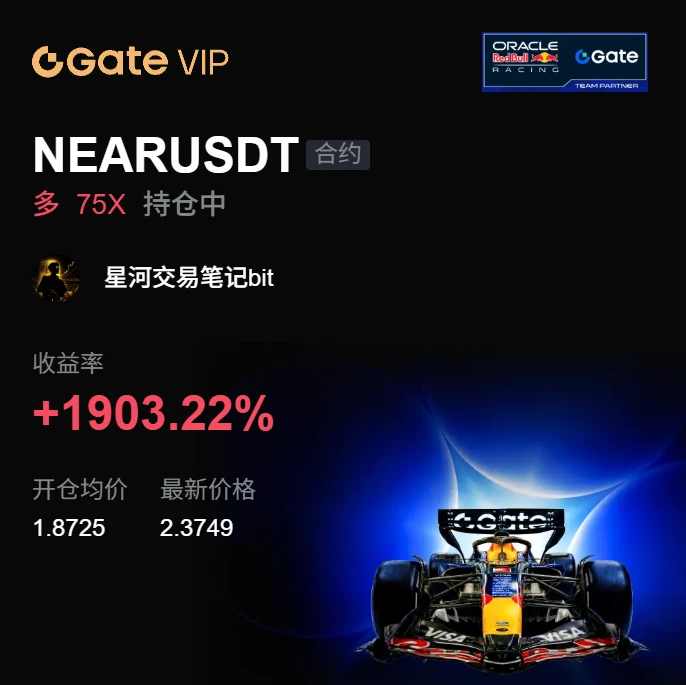
Going long this time was actually quite uncomfortable. Right after entering, I got caught by a false-breakout wick, which nearly took out my stop-loss at a key level. I didn’t cut the position at the key level because volume hadn’t expanded; instead, it looked more like a shakeout. The market then saw a series of small bullish candles, and the battle between bulls and bears quickly shifted in favor of the bulls. When the price reached around 2.3738, I took profit on 70% of the position and moved the stop-loss on the remainder above breakeven. Profit is currently at +1901.7%, and the remaining
post-image
LAB-3.59%
BTC+0.27%
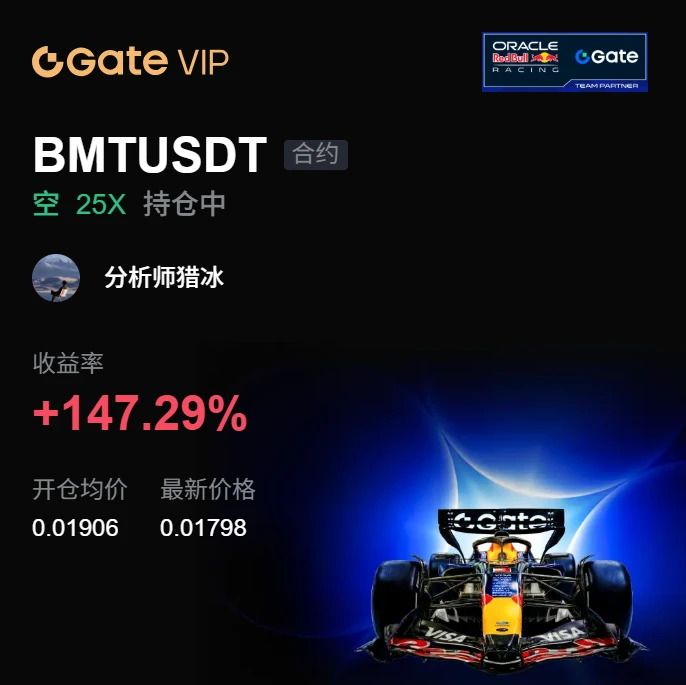
My hand trembled slightly when setting the stop-loss a few days ago; this morning I realized that was unnecessary filial piety. While everyone else was running, I watched $BMT ’s position with each upward push: every rebound was weaker than the last, resistance overhead was obvious, and volume failed to follow. This kind of move couldn’t fool anyone.

I went short directly at 0.01906, and by this morning it had already reached 0.01798, with a return of +147.29%. Nothing to brag about—I just followed the market.

I took 80% of the bulk off the table first, and moved the stop-loss on the remai
post-image
BMT+0.33%
BNB-1.08%
BTC+0.27%
【$RAYSOL Signal】Long · 1H momentum breakout / negative funding rate short squeeze
$RAYSOL RSI 85.92, MACD 1H/4H bullish expansion. Current price 1.3261, just below the 1H upper band at 1.3497. Funding rate -0.0315%, OI stable, depth imbalance -18.48%.
🎯Direction: Long
⚡Entry/limit order: 1.322122 - 1.326100
🛑Stop-loss: 1.259795
🚀Target 1: 1.425558
🚀Target 2: 1.475286
🛡️Trade management:
- After reaching Target 1, reduce the position by 50% and move the stop-loss up to breakeven. If the price falls back to the entry level, exit automatically to protect the principal.
Depth logic: RSI is in
post-image
BTC+0.28%
ETH+1.75%
SOL+3.89%
#GateTops7DayNetInflowsGlobally
GateTops7DayNetInflowsGlobally 🌍🚀 Gate is gaining significant attention after ranking at the top globally for 7-day net inflows, highlighting strong recent capital movement and continued activity across its expanding digital-asset ecosystem. Net inflows are an important market metric because they provide a view into how much capital is moving onto a platform over a given period, offering useful insight into user activity, liquidity, and changing market participation.
The latest momentum comes as the crypto market continues to develop into a broader financial
BTC+0.28%
Everyone’s staring at WLD at 0.42—but the 4h chart just whispered a secret the crowd missed.

$WLD /USDT - SHORT

Trade Plan:
Entry: 0.42 – 0.42
SL: 0.44
TP1: 0.41
TP2: 0.40
TP3: 0.38

Why this setup?
Why now? RSI on the 15m is screaming 73.95—overbought micro-spike inside a 1D **range**. That’s a classic bull trap setup. ATR on 1h (0.005989) shows low volatility, meaning price is coiling. Entry 0.42 with SL 0.44 gives you a 2:1 risk to TP1 (0.41). If 0.44 breaks, we flip to the alt long—but until then, gravity wins. Conf 77.4 isn’t a coin flip; it’s a weighted verdict.

Debate:
Are you fa
WLD+4.73%
#Gate用户突破6000万
【My Story with Gate Began with Grid Trading】 In November 2024, I officially joined the Gate family. At the time, I was a complete novice when it came to quantitative trading, so I decided to try out bot grid trading for the first time. To be honest, I was pretty nervous at first—setting parameters, choosing a range, and checking backtests; I was figuring out every step as I went. But watching the bot automatically buy low and sell high in a fluctuating market, earning steady profits from market volatility without having to monitor the market constantly, gave me that amazing fee
post-image
Why did EPIC become so epic? Because it narrated a pump — but the story's ending soon.
$EPIC ‌EPIC/USDT – Up 26%, near 24h high (0.4905), RSI likely overbought
Short (rejection from resistance)
Entry Zone: 0.4850 – 0.4900
TP1: 0.4750 / TP2: 0.4650 / TP3: 0.4550
SL: 0.4950
Long (pullback to support)
Entry Zone: 0.4550 – 0.4600
TP1: 0.4700 / TP2: 0.4800 / TP3: 0.4900
SL: 0.4480
Key Levels
Resistance: 0.4905 (24h high) / 0.4950
Support: 0.4750 / 0.4660 / 0.4550 / 0.4292 / 0.3718 (24h low)
⚠️ Not financial advice. DYOR and manage your risk.
post-image
EPIC+12.53%
  • 1
This short position was a typical right-side trade. I only entered after the price broke below the lower boundary of the consolidation range. Although the entry was not at the most optimal level, the trade offered relatively high certainty. As expected, the market did not turn back; during the entire downward move, there were hardly any decent rebounds, showing that the bears were clearly in control. When a minor divergence signal appeared midway, I chose to reduce my position rather than exit completely, because the higher-timeframe trend inertia was still intact. Ultimately, this trade close
post-image
ETH+1.73%
DOGE+2.74%
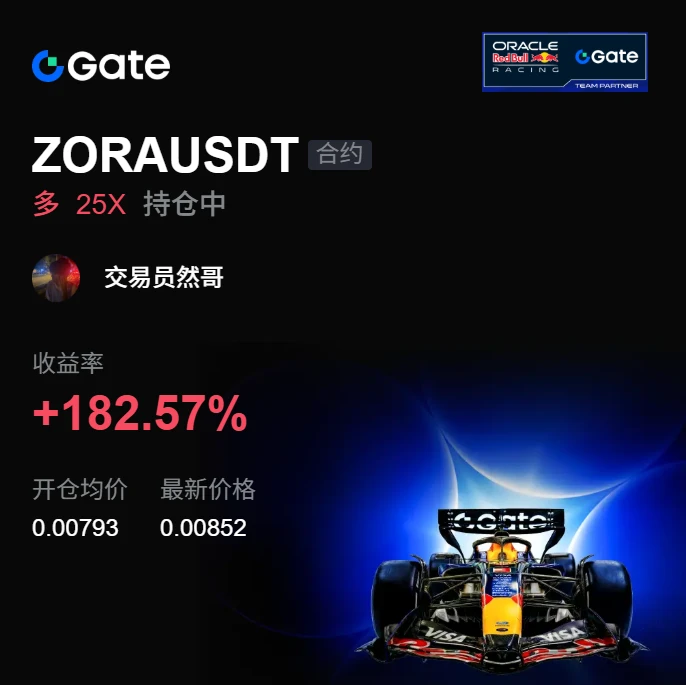
With this trend, I don’t even need to think—the account is dancing on its own. When the whole screen was glowing green, $ZORA was lying around $0.00793, completely motionless. While everyone else was cutting losses, I saw a pullback holding firm, with funds buying every dip. That signal was obvious enough, right?
As expected, when I checked the chart after lunch, it shot straight up to $0.00853 in a single move. The +182.57% profit went securely into my pocket. What a comfortable feeling. This move was purely because the market was in a good mood and casually scattered some gold coins, one of
post-image
ZORA-3.65%
DOGE+2.74%
ETH+1.73%
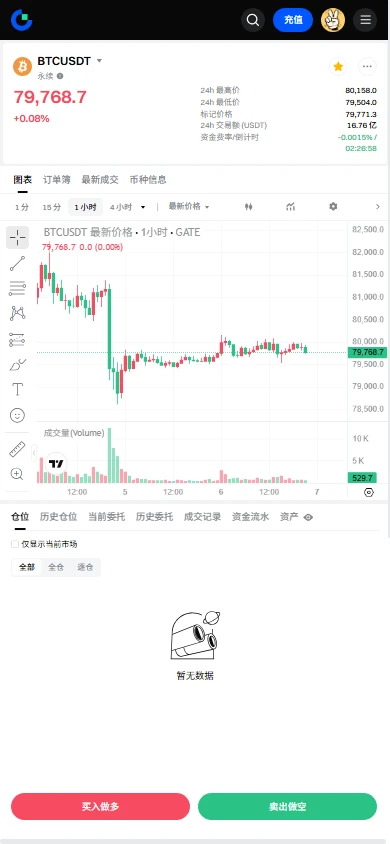
$BTC , is it going to hold at 80,000? Looks like this year's market isn't very good! It seems the wish to double will fall through! Bring on the bull market! 🐮🐮🐮🐮🐮🐮🐮🐮🐮🐮🐮🐮🐮🐮🐮🐮🐮🐮🐮🐮🐮🐮🐮🐮🐮🐮🐮🐮🐮🐮🐮🐮🐮🐮🐮🐮🐮🐮🐮🐮🐮🐮🐮🐮🐮🐮🐮🐮🐮🐮🐮🐮🐮🐮🐮🐮🐮🐮🐮🐮🐮🐮🐮🐮🐮🐮🐮🐮🐮🐮🐮🐮🐮🐮🐮🐮🐮🐮🐮🐮🐮🐮🐮🐮🐮🐮🐮🐮🐮🐮🐮🐮🐮🐮🐮🐮🐮🐮🐮🐮🐮
post-image
BTC+0.28%
  • 6
  • 1
BTC returns to $78,000! The market rebounds after finding suppor
live-cover
LIVE1,786
How long has it been since you walked with a bounce like you did as a child?😉
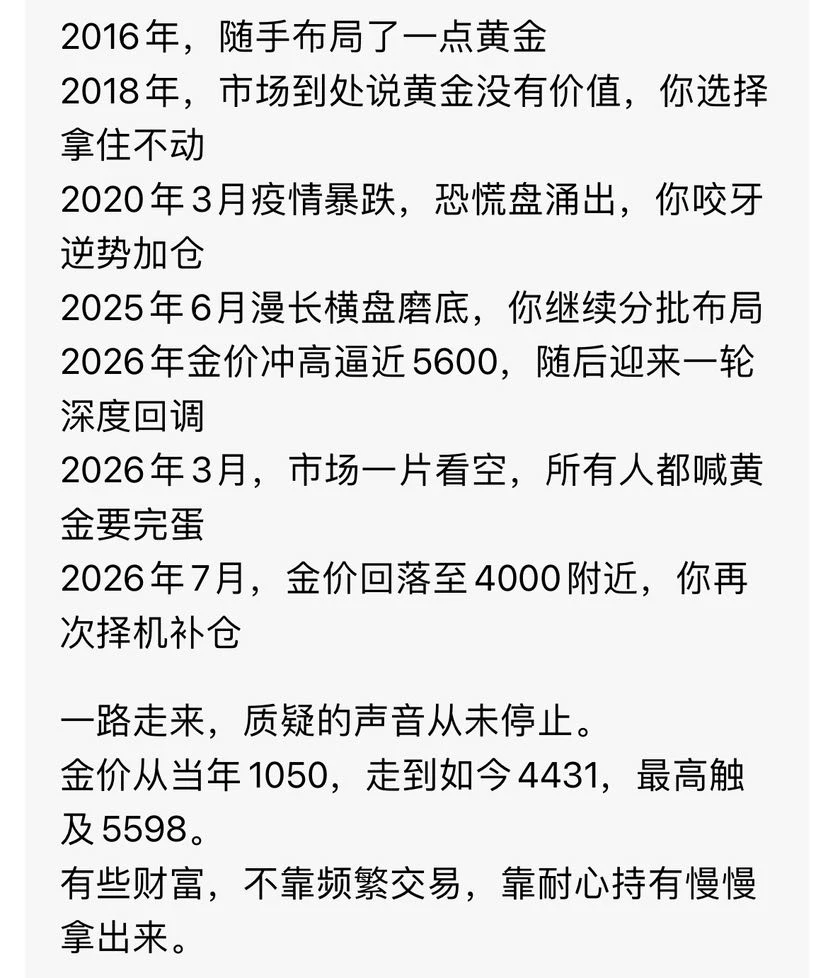
Long-term Holding of Gold | Wealth Is Built Through Patience
post-image
GLDX-0.46%
PAXG-0.09%
  • 1
🚨 BREAKING 🚨 :
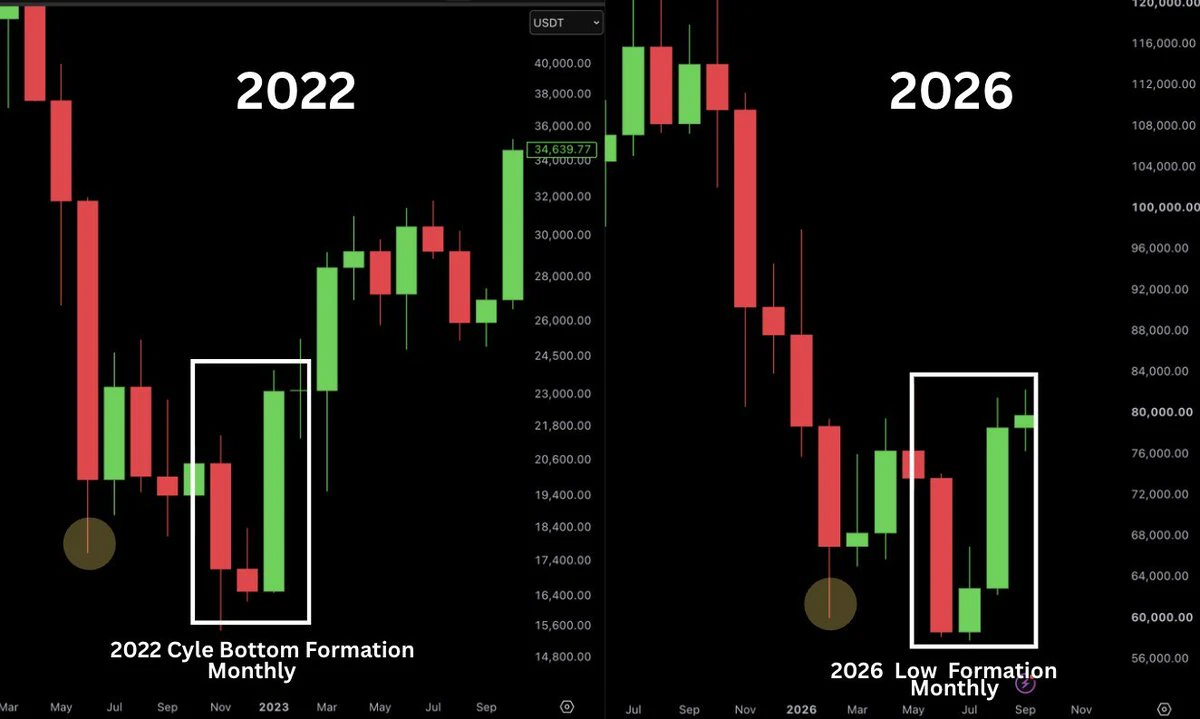
I just found the same pattern which has happened in 2022 and going to happen in 2026
JUST wait and watch everything will be fine
Don't lose hope
Could history repeats itself , what do you think 🤔?
post-image
Everyone’s watching DASH’s bounce—but the 4h chart just whispered a secret that most retail missed.

$DASH /USDT - SHORT

Trade Plan:
Entry: 67.59 – 69.07
SL: 75.46
TP1: 62.98
TP2: 59.41
TP3: 54.06

Why this setup?
- Bias is SHORT with 55% confidence, not blind hope.
- 1D trend is *range*, meaning this isn’t a breakout—it’s a trap door.
- RSI 15m at 44.5 shows zero momentum for bulls; ATR 2.97 says volatility is coiled.
- Why now? Price sits at 68.33, but TP1 at 62.98 is a 8% drop—before you blink.

Debate:
If DASH slices 67.59, do you trust the short to TP2 at 59.41 or fade it for a
DASH+0.54%
Load More

Join 40 M users in our growing community

⚡️ Join 40 M users in the crypto craze discussion

💬 Engage with your favorite top creators

👍 See what interests you

View More