Square
Following
Hot
News
Notifications
Profile
Share your thoughts
placeholder
Article
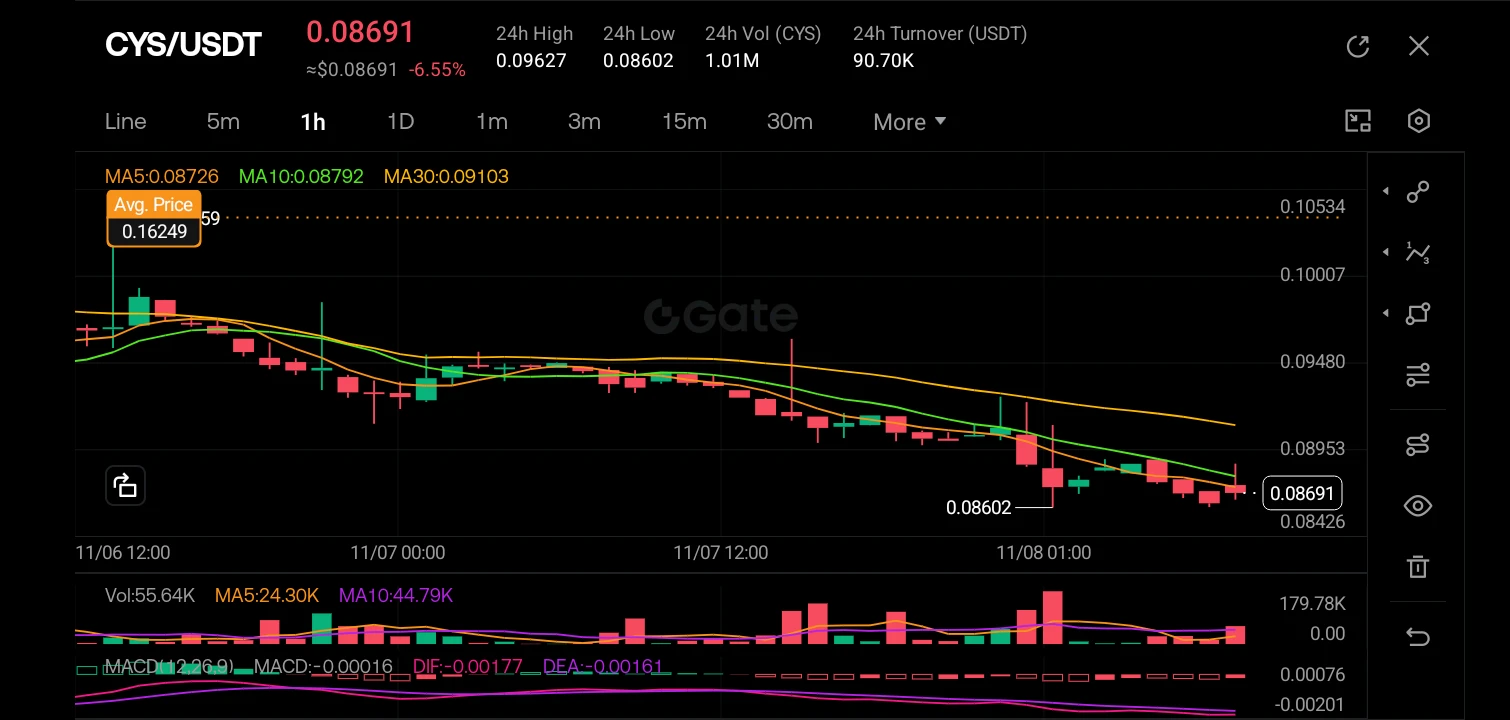
$CYS ‌
The 1-hour chart is locked in a brutal, unrelenting downtrend, with the price action consistently printing lower highs and lower lows while getting rejected by the descending moving averages (MA5, MA10, and MA30 are all fanned out bearishly above the price). The current price of 0.08691 is hovering dangerously close to the 24-hour low of 0.08602, indicating heavy selling pressure, and the MACD is deep in negative territory with the DIF and DEA lines pointing downward, confirming that bearish momentum is still in full control.

The recent price action features a series of predominantly
post-image
CYS-0.35%
  • 3
$UAI The short position reached its target successfully, and take profit was secured 👍❤️‍🩹

A recap of this trade: On November 7, I took a bearish view and opened a short position in $UAI around 0.1340, with take profit set at 0.0880 and a stop loss at 0.1785. The price continued to fall and eventually hit the take-profit target precisely, with $UAI down -42.25%.
Risk warning: This is shared solely as a personal trading record and does not constitute investment advice. Contract trading carries extremely high risks; please manage position sizes and stop-losses carefully.
post-image
UAI-7.51%
  • 1
Trenches
ZIG
Z
bade
b
ZIG
0x8c...1145
Market Cap
$.
Change
.
24h Vol
$.
Holders
.
STONK
S
bade
b
STONK
6GmA...UNgx
Market Cap
$.
Change
.
24h Vol
$.
Holders
.
IDOL
I
bade
b
IDOL
0x3b...ab07
Market Cap
$.
Change
.
24h Vol
$.
Holders
.
MAGGIE
M
bade
b
MAGGIE
8rHo...PmZV
Market Cap
$.
Change
.
24h Vol
$.
Holders
.
FLOAT
F
bade
b
FLOAT
Bv1a...BMmr
Market Cap
$.
Change
.
24h Vol
$.
Holders
.
How this beautiful young woman’s figure changes after pregnancy!
How her choice of lingerie styles changes
What do you all think???
Is this the same person????
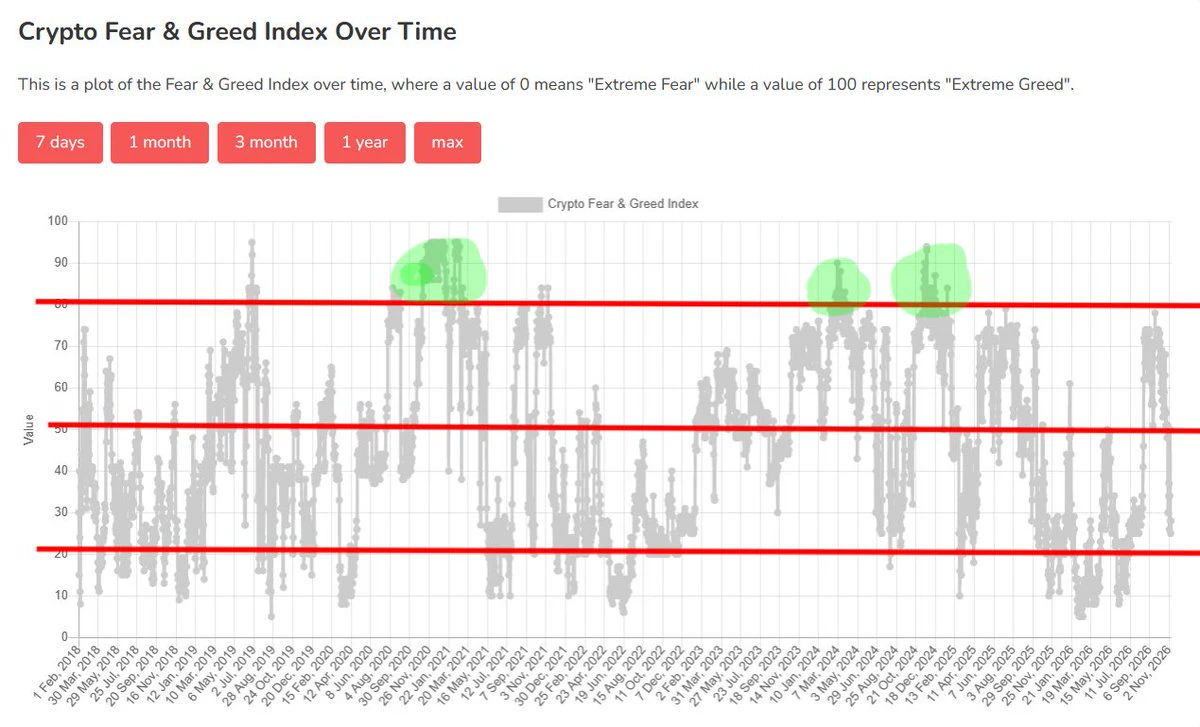
The last time sentiment was this low was in February, March and June when Bitcoin was in the low 60Ks, which offered the best entry of the year. Now we’re up 30% in price yet sentiment is back around the same level of 20. This means sentiment has been resetting while price prints a macro higher low above 70K presenting another opportunity.
P.S. for altcoins only above 80
post-image
BTC-0.67%
Market opportunities are always there,
but opportunities that are yours are rare.
Market action that doesn't fit your trading framework,
no matter how lively, has nothing to do with you.
Forcing your way in
means using your capital to pay for someone else’s market.
Only trade opportunities you understand;
staying out is also a trade.
post-image
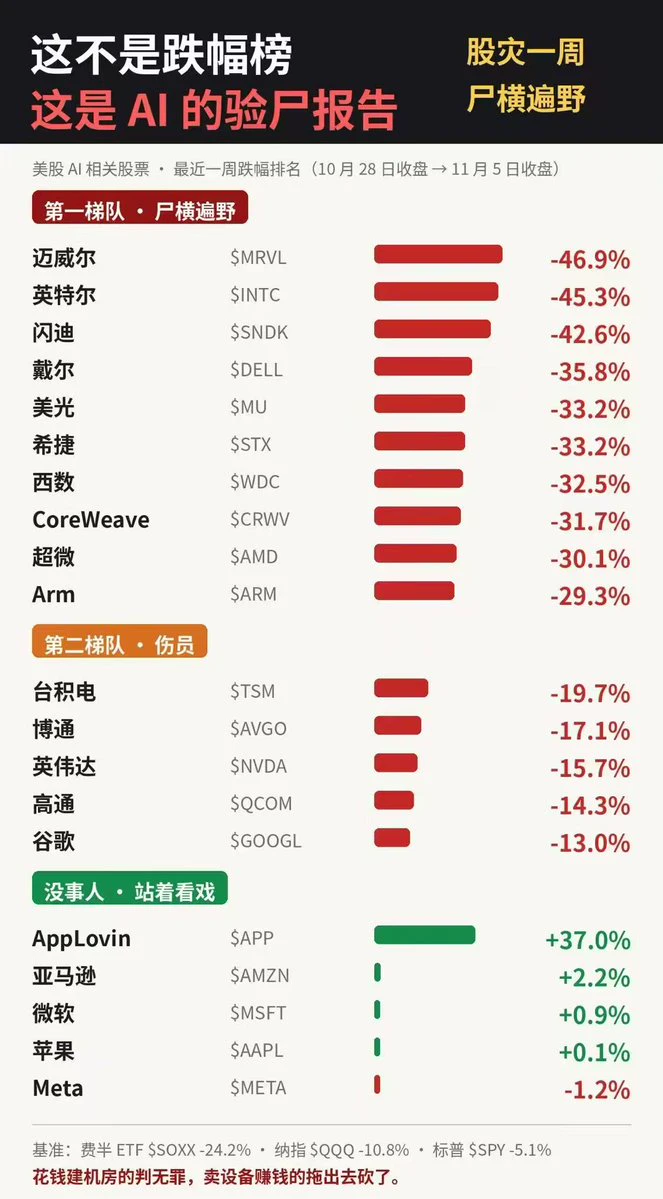
U.S.-listed AI stocks have taken a beating lately, especially computing, storage, and semiconductor stocks, which had surged the most before.
Take a look at this chart, from October 28 to November 5:
Marvell -46.9%
Intel -45.3%
SanDisk -42.6%
Dell -35.8%
Micron -33.2%
Western Digital -32.5%
CoreWeave -31.7%
AMD -30.1%
Even NVIDIA, Broadcom, and TSMC fell 15%–20%.
By contrast, tech giants like Microsoft, Apple, and Amazon have held up relatively well.
In this AI boom, GPU sellers are making money, server sellers are making money, storage sellers are making money, while data center builders are
post-image
INTC+8.00%
SNDK+3.53%
CRWV+6.18%
AMD+11.55%
NVDA+2.80%
  • 1
Are institutional funds collectively pretending to be asleep? BTC ETFs see $870 million in outflows—when will the next wave of dip buyers appear?

Bitcoin investors may be feeling a little down lately: retail investors are still studying candlestick charts, while institutions have already voted with real money.
U.S. spot BTC ETFs saw nearly $870 million in cumulative net outflows this week, and the retreating funds have once again made the market feel the harshness of reality.
But interestingly, outflows don't mean institutions have completely given up on Bitcoin.
For large investment institut
AUDUSD-0.96%
  • 28
Happy Deepavali to everyone celebrating 🪔
May your lamps stay lit and your liquidation alerts stay quiet.
post-image
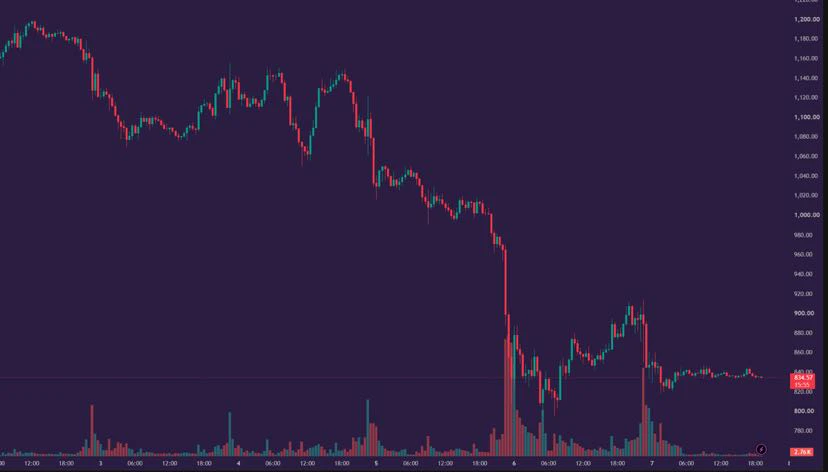
The storage sector has had what could be called a disastrous week😥

$SNDK fell from around 1170 at the start of the week to 835, hitting a weekly low of 794 and ending down nearly 29%

Keep in mind, this was one of the storage leaders the market had been most bullish on...

Thursday saw an especially dramatic wave of selling. After the Democrats won the midterm elections, the market began to worry that data center construction in the U.S. would face stricter regulation, and the entire AI supply chain was hit by valuation de-rating

SanDisk, Micron, and SK hynix were all caught up in the sell
post-image
SNDK-0.18%
BIRB | Short 🔴 | Bearish | 15 minutes 24 hours: -8.15% | Volume: 25.6M USDT
Short rationale: Price below EMA200; EMA20/50/200 in bearish alignment; RSI14 at 37.8; MACD histogram negative; ADX14 at 36.4; volume at 0.57x the 20-candle average; trend pullback/continuation.
Entry: 0.08865 Stop-loss: 0.0903247 Take-profit 1: 0.0865567 | Take-profit 2: 0.0853007 | Take-profit 3: 0.083626
Entry is for reference only; do not chase the price. The setup is invalidated if the stop-loss level is reached. For technical analysis only, not investment advice. $BIRB
post-image
BIRB-16.68%
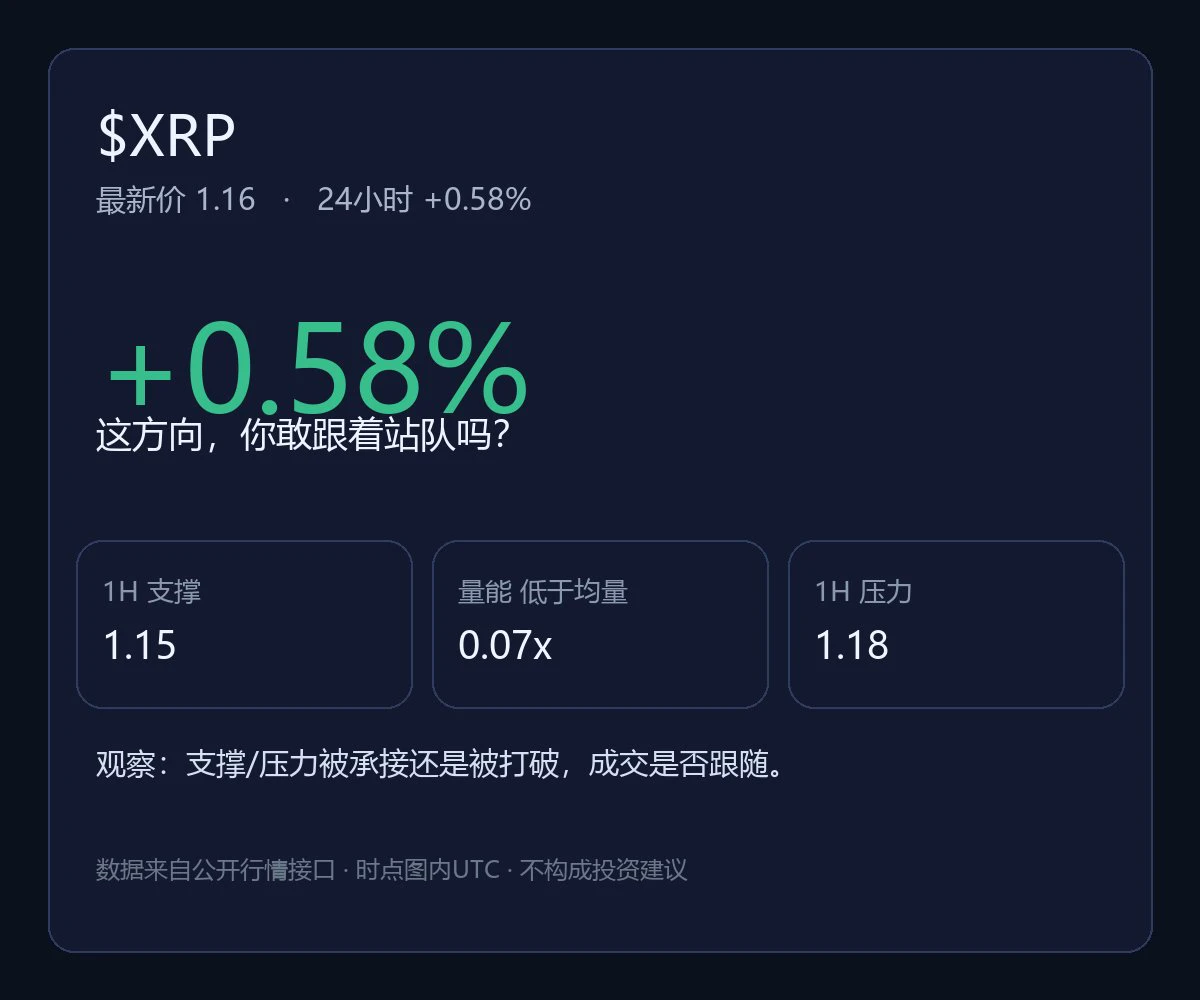
$XRP 's direction is holding for now, but low volume undermines its credibility

$XRP is currently priced at 1.1626, up 0.5796349165152925% over 24 hours, with an intraday high of 1.1821 and a low of 1.1495. The 1-hour and 4-hour trends are both weak, and the volume ratio is 0.06728641053227415. Price has moved first, but trading volume has not followed. This divergence is more worth watching than the color of a single candlestick.

In terms of key levels, the 1-hour support is 1.1495 and resistance is 1.1821. At 1.1626, the current price is about 0.0131 above support at 1.1495 and about 0.0195
post-image
XRP-1.15%
New streamer bts market
live-cover
LIVE1,422
Bitcoin Plunges 6% as U.S. Stocks Also Crumble! Is Smart Money Retreating, or Is This a Chance for Retail Investors to Get In?

U.S. stocks and Bitcoin are in the same boat this time: one is flashing green across the screens, while the other is leaving investors baffled.
On November 5, the Nasdaq plunged 5.52%, the S&P 500 fell 4.36%, and the Dow Jones dropped 3.44%. Bitcoin fell about 6% in tandem, briefly dipping below $76,000 intraday.
The post-election rally from the previous day was almost completely erased overnight.
Some see this as a buying opportunity, while others are already conside
AMD+11.55%
  • 12
BTC | ETH | Gold | Crude Oil
live-cover
LIVE4,837
#USCPIDataIncoming #ShareWeekly
America’s most closely watched inflation report is just around the corner. The Bureau of Labor Statistics is scheduled to release the Consumer Price Index (CPI) for October 2026 on Tuesday, November 10, 2026, at 8:30 a.m. Eastern Time. This is not just another data point. It is one of the primary inputs the Federal Reserve uses to decide the future path of interest rates, and financial markets from Bitcoin to the S&P 500 to gold and crude oil will react within seconds of the numbers hitting the wire.

What CPI Actually Measures
The Consumer Price Index tracks t
  • 4
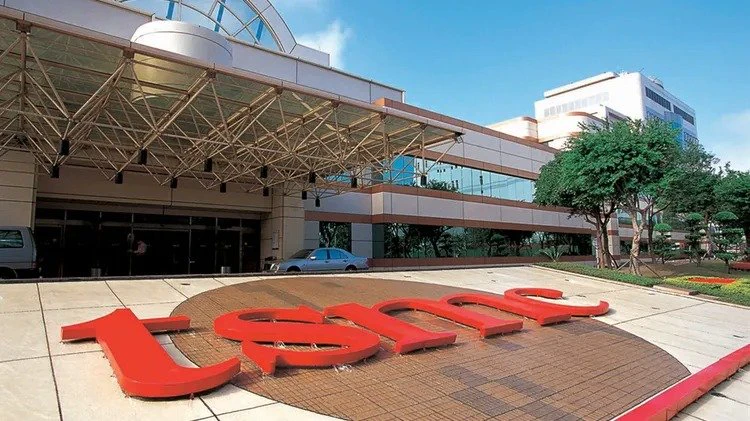
According to a report by The Information cited by IT Home, amid a global DRAM shortage and rising prices, TSMC is said to be researching the development of 3D DRAM at Nvidia’s request. If pursued, this could open up a new business, but would also expose the company to cyclical risks. TSMC denied the report, saying it would focus on logic chip foundry services.

The official position is that TSMC only does logic chip foundry work. However, the report cited two people familiar with the matter who said that, following a request from Nvidia, TSMC had begun developing a plan to manufacture 3D DRAM,
post-image
TSM+6.60%
NVDA+2.80%
BTC-0.67%
Like mother, like daughter. This time, the scammers made sure to treat them both equally😂
post-image
Guys, $UAI $UAI crashed perfectly as I predicted, and I'm currently sitting on hefty profits... Now, I'm going to close this short position because $UAI is showing buying pressure again...‼️
post-image
UAI-7.58%
#StockTalkSeason The Silicon Rebound: Institutional Relief Rally or True Structural Bottom?
The global technology sector closed out a week of extreme, high-velocity price action on a highly fragmented note. Following an aggressive macro sell-off that pushed major tech benchmarks to multi-month support wicks, an intense wave of Friday short-covering swept through the semiconductor complex. However, across the aggregate weekly cycle, traditional equity indices remain deeply trapped in negative territory, highlighting a strong divergence between short-term derivatives positioning and long-term ca
post-image
  • 3
Inorder for #Lyn $Lyn to continue its run it need to break 0.03071$ which nearest Resistance
post-image
LYN-0.44%
Load More

Join 40 M users in our growing community

⚡️ Join 40 M users in the crypto craze discussion

💬 Engage with your favorite top creators

👍 See what interests you

Trending Topics

USCPIDataIncoming

2.71k Views1.49k Discussing

The U.S. October CPI report will be released on November 10 at 8:30 a.m. ET. September CPI came in at 3.7% year over year, and markets will be watching closely for signs that inflation is cooling, especially in core CPI. A softer-than-expected reading could strengthen rate-cut expectations, while hotter inflation may pressure risk assets through higher Treasury yields and a stronger dollar. How do you think this CPI print will move $BTC, U.S. stocks and gold?

USAIStocksHitHard

24.25k Views3.7k Discussing

USNonfarmPayrolls

42.24k Views4.4k Discussing

View More