Share your thoughts
placeholder
Article
There is no extremely strong one-sided expectation in the short term, and market divergence is evident; compared with a sharp rally, the market is more inclined toward BTC pulling back to test 76000; if an extreme move sends it down to 74000, the risk-reward potential is greatest.
post-image
BTC+0.48%
Golden September and Silver October Chapter 4: Why Is Your Thinking Clear When Analyzing the Market, but You Lose Your Bearings as Soon as You Enter?
Armchair analysis is always the easiest.
Until you actually enter a position, you can never understand the torment of sitting on pins and needles during a trade.
$BTC
When looking at the market, anyone can explain the reasoning clearly: support and resistance, trend reversals, take-profit and stop-loss levels—all the logic seems neat and straightforward. But once real money is in the market and your account balance starts fluctuating, all the me
post-image
BTC+0.46%
The market has almost fully priced in Ethereum holding above 2400; a short-term break below 2400 is an extremely low-probability event, while the 2200/2300 support levels below are highly recognized by the market.
post-image
ETH+1.06%
Nobody is talking about the quiet move happening inside SYMBOL right now.

$BTC /USDT - LONG

Trade Plan:
Entry: 78479.35 – 78647.21
SL: 77757.60
TP1: 79167.54
TP2: 79570.38
TP3: 80174.65

Why this setup?
Why now? The daily trend is bullish, the 4h setup is leaning LONG with 95% confidence, and the 1h price is sitting at 78563.28, which is also the entry reference. The 15m RSI at 45.33 shows room to run before overbought, while the 1h ATR of 335.701612 tells us volatility is expanding enough to push toward the first target at 79167.54 and the second target at 79570.38. The entry zone betwee
BTC+0.46%
#GateIdleEarnAutoYieldUpTo3%
Idle Capital Gets a New Role
Stablecoins are often treated as the “waiting room” of crypto: capital sits in USDT or USDC while traders wait for the next BTC, ETH, or altcoin opportunity. Gate’s newly launched Idle Earn changes that equation by allowing eligible idle stablecoin balances to generate an annualized yield of up to 3% while remaining available for trading. Gate officially launched the feature on August 26, 2026, and its latest product information confirms that the displayed annualized rate can change dynamically with market conditions.
The 3% Number Nee
USDC-0.02%
GUSD+0.04%
BTC+0.48%
ETH+1.06%
  • 3
JUST IN: Ant Group open-sources Ling-3.0-flash-VL, a native multimodal model with MIT license and FP8/BF16 weights; MoE architecture, 124B params, up to 1M token context. Could spur enterprise AI tooling and on-chain data apps built around multimodal inputs. $BTC $ETH
post-image
BTC+0.48%
ETH+1.06%
On the one-hour ETH chart, the price first completed a breakout and reversal of the descending channel, successfully breaking above the channel’s resistance.
The current price is moving near the channel’s upper boundary. Regarding indicators, the Bollinger middle band provides short-term support, KDJ is in bullish territory, and the red MACD bars above the zero axis continue, indicating overall strength.
The upper channel resistance is around 2510-2515. A volume-backed breakout would open up further upside and form a rising flag pattern.
Ethereum reference: long at 2498, target 2538, risk cont
post-image
BTC+0.46%
ETH+1.09%
CRYPTO MARKET UPDATES
live-cover
LIVE1,423
🐶 The Gate Gold Dog livestream cover is here! Hot trends are heating up, and streamers are ready to start digging!
Meme hype shows no signs of slowing, and on-chain opportunities keep emerging. Put on the new cover to make your livestream stand out!
🎙 What are we talking about today?
🔹 Can the popular Memes on Robinhood Chain still make a run?
🔹 New coins are launching one after another—how can you find opportunities worth watching? What is smart money buying?
🔹 KOL rankings and Callout rankings: what are the new ways to engage in Meme social trading?
🔹 Gold Dog trading fees as low as 0.
post-image
MEME+0.58%
  • 2
  • 2
9.9, Wednesday, Shandi’s view!
Yesterday, Shandi’s daytime session weakened overall, with the market remaining under continued pressure. After the U.S. stock market opened, incoming funds drove a rally, but unfortunately the bulls failed to sustain the momentum, and another pullback emerged in the early morning hours.
The market has been oscillating back and forth, with intense bullish-bearish competition. In the short term, it is still digesting overhead pressure and has yet to establish a clear one-way trend.
In the short term, focus on support around 1680-1700. As long as this range is not
SNDK-2.71%
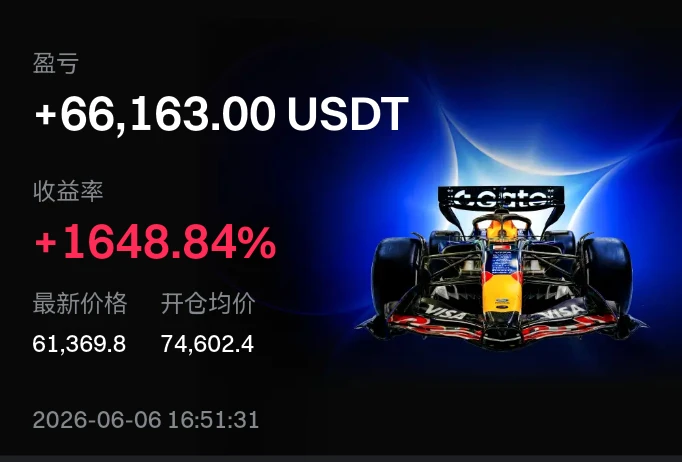
I switched to the background to reply to a message, and when I came back, it had already done the job. During the intraday bottoming process, $ETHFI was hovering around 0.4789. I watched it for a few minutes—whenever it dipped, someone was there to catch it, and funds were quietly entering, so I held on.
I originally thought I would have to wait until evening, but it took off directly in the afternoon, with the price reaching 0.5993 and floating gains of +1785.15%. Putting risk control in place beforehand is called rationality; cutting losses afterward is called making a last stand.
I took pro
post-image
ETHFI+4.08%
SOL+1.01%
BTC+0.46%
$CYS 1220 I was perfectly fine leaving ZEC alone, but my itchy hands went long on this piece of trash, CYS, again. What a self-inflicted disaster.
CYS-18.41%
#gStocks购买补贴最高返现1000U
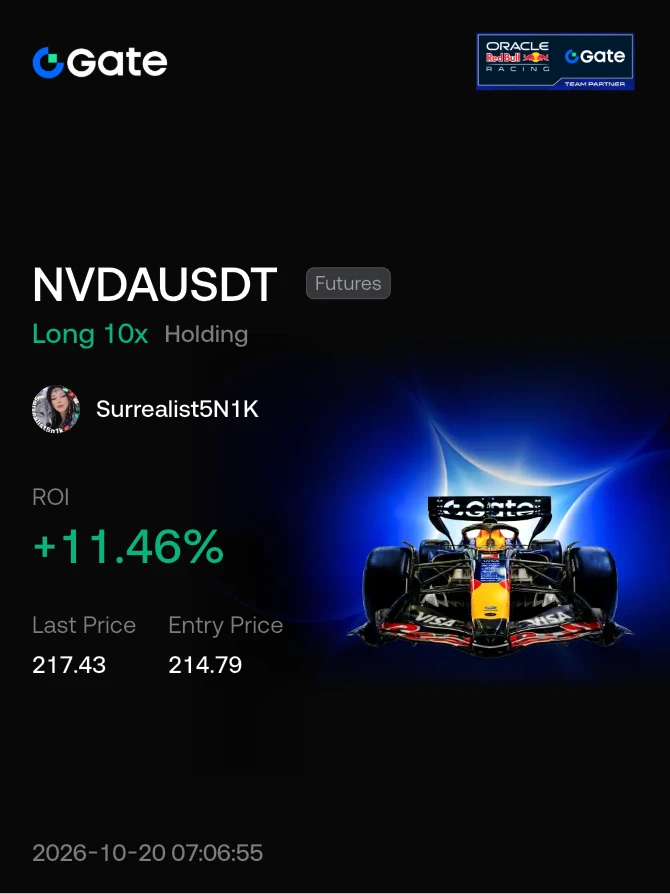
My Pick: NVDA
If I had to choose only one stock for the gStocks Trading Campaign, my pick would be NVIDIA (NVDA). I would not choose it simply because AI is popular. The stronger reason is the combination of earnings growth, data-center demand, forward guidance and a price structure that has recently recovered from a sharp post-earnings pullback.
The campaign itself adds another layer to the decision: eligible users can receive up to 2% cashback after meeting the required trading conditions, while the holdings reward pool contains 50,000 USDT worth of gStocks. Combined w
post-image
NVDA-2.00%
TSLA+3.99%
AAPL-1.15%
  • 5
No vision, couldn’t hold on—the profits on this move were paper-thin, but I absolutely loved it.

I had just finished writing an analysis: $TSLAX overhead resistance was obvious and it was rising without volume, but I didn’t expect it to fake a drop and then take off. While everyone else was running, I picked up a little at 361.70. The market hadn’t fully started moving yet—it felt like finding a bargain.

I was genuinely nervous during the repeated intraday fluctuations, but the moment it broke out at 367.44, it felt amazing. The +146.33% return isn’t much, but it’s safe and bankable.

Ta
post-image
TSLAX+2.63%
ADA+1.33%
SOL+1.01%
The 2,500 short target given in yesterday’s Ethereum analysis reached 2,450—perfectly hit.
Looking at today’s analysis, we can see from the chart that Ethereum is currently in a period of consolidation and accumulation before the storm. The Bollinger Bands are tightening further and further, indicating that the window for a major move is approaching. On the daily chart, the price is trading above the middle Bollinger Band. Although the MACD red bars continue to shrink and bullish momentum has clearly weakened compared with the previous rally, the broader bullish trend remains intact. The marke
post-image
ETH+1.09%
📚 Crypto Tip: What Is Funding Rate?
If you trade crypto perpetual futures, you may have seen the term Funding Rate.
Funding is a periodic payment exchanged between traders holding long and short positions. It helps keep the perpetual contract’s price aligned with the underlying market.
🟢 Positive funding → Long positions generally pay shorts.
🔴 Negative funding → Short positions generally pay longs.
Funding rates can provide insight into market positioning, but they are not a guaranteed signal that price will rise or fall.
⚠️ Leverage and futures trading carry significant risk. Always und
post-image
  • 10
  • 1
$1000 to $100,000 Crypto Trade Challenge Today
live-cover
LIVE1,095
No action, no analysis—just sheer luck. The order I placed a few days ago somehow filled itself. At the time, $BTR rebounded to a key level and then stalled; volume failed to follow, and buying support was insufficient. With this kind of price action, even if it does not fall, it cannot move higher. Before bed, I set a stop-loss and followed the plan, entering a short position. It is now at 0.05152, with an unrealized profit of +1484.47%. I feel embarrassed even mentioning this result—it is not that I read the market correctly; this was simply a gift from the market. I’ll take most of the pro
post-image
BTR+10.33%
SOL+1.01%
LAB-3.06%
☀️ GM! Another tug-of-war around $BTC today.
🐂 Bulls: UP!
🐻 Bears: DOWN!
BTC: Can you both just let go…
Meanwhile, ETH is already chilling with a coffee. ☕
👇 Which side are you on today?
💬 Join the conversation on Gate Square:
https://www.gate.com/post
post-image
Gate_Square
☀️ GM! Another tug-of-war around $80K today.
🐂 Bulls: UP!
🐻 Bears: DOWN!
BTC: Can you both just let go…
Meanwhile, ETH is already chilling with a coffee. ☕
👇 Which side are you on today?
💬 Join the conversation on Gate Square:
https://www.gate.com/post
repost-content-media
BTC+0.48%
ETH+1.06%
Nobody is talking about the SYMBOL setup hiding in plain sight right now.

$ETH /USDT - LONG

Trade Plan:
Entry: 2492.55 – 2500.01
SL: 2460.50
TP1: 2523.12
TP2: 2541.01
TP3: 2567.85

Why this setup?
Why now? The daily trend is firmly bullish, the 1h ATR is 14.90964 showing active momentum, and the 15m RSI sits at 58.74 with room to run. The entry zone is 2492.55 to 2500.01, targeting TP1 at 2523.12 and TP2 at 2541.01. This trade invalidates hard at 2452.44, which is the line in the sand protecting the position.

Debate:
Are we hitting TP2 at 2541.01 or getting trapped before the invalidati
ETH+1.09%
Load More

Join 40 M users in our growing community

⚡️ Join 40 M users in the crypto craze discussion

💬 Engage with your favorite top creators

👍 See what interests you

View More