

Square
Following
Hot
News
Profile
Share your thoughts
placeholder
Article
$SKL Current price: 0.00533. The first resistance above is the Bollinger upper band at 0.00547, while the first support below is MA5 at 0.00512; if that level is lost, watch MA20 at 0.00473.
The bias is bullish, but this is a trend-following trade in a high-volatility environment, not a bottom-fishing trade. Reasons: MA5>MA20 shows a bullish alignment, the MACD histogram is positive, RSI at 62.8 has not yet entered the overbought zone, and the trend structure remains intact; however, the amplitude over 30 candles is close to 29.6%, volatility is extremely high, and the Fear and Greed Index at
post-image
SKL+13.40%
ZEC-10.85%
ADA-7.78%
$VVV
Retail traders are 66% short, open interest quietly increased by 1.2%, and the funding rate is still positive—it's clear who is secretly accumulating. 22.88 is the level for longs to get on board; if shorts keep holding, 24.57 will reveal the truth 😤
post-image
VVV-9.88%
crypto market update
live-cover
LIVE83
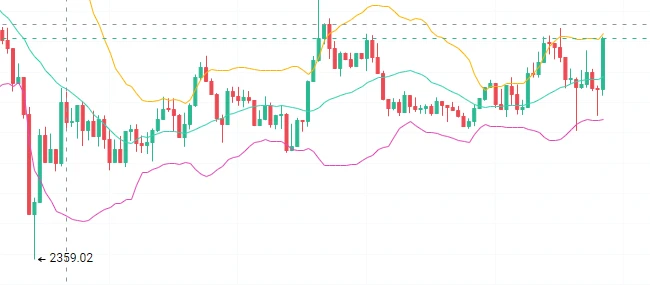
Bottom accumulation is complete, and room for a rebound in gold prices is gradually opening up
Recently, the market has continued to digest U.S. employment data. The slight cooling in employment data has raised market expectations for subsequent policy adjustments, providing support for gold prices.
From the four-hour chart, the price has gradually recovered from its previous low. Support from the lower Bollinger Band has held, and the market is moving upward toward the middle Bollinger Band. The RSI indicator is steadily rising, moving out of the low range, while bullish momentum continues to
post-image
XAU+0.67%
The lower levels of $ENA are drawing attention, but cheapness can never replace evidence that the decline has stopped. I would rather lay out the bearish case first.
Bears see the risk after a break below 0.1941, while bulls need to prove that buyers remain after a break above 0.2283. Current volume is 0.12x.
The current price is 0.2067, about 6.10% from the 1-hour support at 0.1941 and about 10.45% from the resistance at 0.2283. Positioning determines which side is more urgent. Stop guessing the bottom for now and wait for a new support structure.
It is more reliable to let the boundaries pr
post-image
ENA-8.09%
$TIA Current price 0.517, 24h +15.76%, trading volume 21.2M USDT, funding rate +0.0050%, Fear & Greed Index 64 (Greed). On the moving-average front, MA5=0.5036 has crossed above MA20=0.484465, the MACD histogram at +0.003991 remains bullish, RSI 63.0 is not yet overbought, and the Bollinger upper band at 0.52355 is right overhead. Assessment: Bulls have the upper hand, but the price is already pressing against the upper band and the funding rate has turned positive, creating a short-term structure that is “strong but crowded.”
A funding rate of +0.0050% means longs must pay to hold positions,
post-image
ZRO-10.14%
$ORCA Conclusion first: bearish in the short term; rebounds are opportunities to short, but do not chase shorts—wait for a rebound.
From a fund-flow perspective, ORCA fell 17.09% over 24h, with a trading volume of only 13.7M USDT, indicating a decline on shrinking volume. However, the funding rate is -0.0392%, meaning shorts are paying longs, which shows that short-side positioning in the derivatives market is already overcrowded. The typical risk of this structure is that once spot selling pressure is exhausted, short covering can easily trigger an upward wick, so entry position is more impor
post-image
ORCA-18.96%
PUMP-9.25%
$CXMT My position was too large. Last night’s low was caused by my stop-loss sell-off, and I got stopped out at the very bottom. That’s how helpless it feels.
CXMT-10.81%
After that oversold sweep, I caught the retracement relief from the rebound on $SOL
. It posted a strong 41% gain as it pushed toward resistance. 🚀 ⭐ 🔥 Profit: $108 Starting today, add $Q and $ZEC to your watchlist.
post-image
SOL-4.86%
ZEC-10.85%
This isn't a rebound—it's CPR for my short-position account, isn't it? While everyone else was running, $ZEC pulled up once and then weakened, volume failed to follow, and the bull-trap flavor was strong. I shared the short thesis around 1441.41. Pressure at highs is still pressure at highs; every surge falls just short. If you don't short this structure, what are you waiting for?

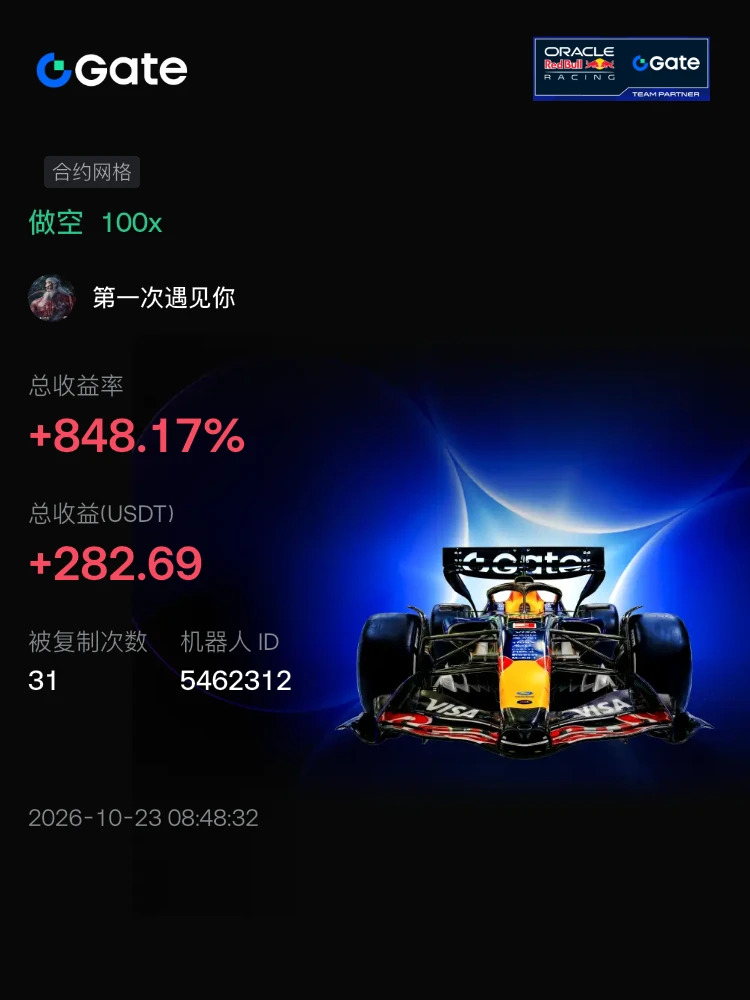
The market slid from 1441.41 to 1183.89, putting +1268.91% straight in my pocket. Nailed it.

The market exists to cure all kinds of defiance, especially in those who think they're the smartest.

Close 80% first
post-image
ZEC-10.85%
DOGE-4.70%
BNB-4.51%
Amid the broad decline across the sector, why is $ADA more worth watching?
The answer lies in relative strength: INJ is down 8.22% over 24h with a 16.82% trading range, while ADA is down 7.43% with a 14.61% range. Both the decline and volatility are more contained, indicating that selling pressure has been relatively well released. However, the technical picture has not yet turned bullish—MA5=0.23292 is below MA20=0.243225, showing a bearish alignment; RSI=36.5 is approaching the oversold zone, the MACD histogram at -0.0006026 remains negative, and the price is near the Bollinger lower band at
post-image
INJ-8.45%
PUMP hit by reverse-engineering access revocation -7.9%, rebounds +2.41%; I’m bullish
$PUMP Access was revoked through reverse engineering last night; current price 0.00568, 24h -7.9%, yet the chart didn’t collapse: after the incident, it moved from 0.005557 to 0.005691, rebounding +2.41%. I’m directly bullish at this level.

The daily structure remains intact—RSI 65.2 is strong, MACD has remained above the zero line for 11 days since the bullish crossover, MA7 has stayed above MA30 for 14 days, and the short-term moving averages remain in a bullish alignment.

Funds haven’t fled either—OI v
post-image
PUMP-9.25%
I just opened a quick short trade on $GTC
. The entry price is now 0.21071 or 0.21500. The first target is 0.2000, the second is 0.19500, the third is 0.19000, and the final one is 0.18500++. Set the stop-loss above 0.23500.
post-image
Hope you all managed to pick up some of your favourite tokens at a discount today. I know we did 🤝
Taking the rest of the night off, but I’ll be updating the major charts and key levels in the subscribers’ section tomorrow 🤟
post-image
On the evening of October 8, MAEXTRO Auto officially released the “Statement on Issues Related to the Base of the MAEXTRO Auto Brake Pedal Bracket.” The statement shows that MAEXTRO Auto’s braking system was developed and validated throughout the entire process in accordance with requirements exceeding national standards (GB 21670‑2025 / GB 7258‑2026) and industry standards (QC/T 788‑2018). Since the delivery of the first batch of vehicles, no brake pedal bracket base fracture failures have occurred under users’ actual usage conditions.
“We will further optimize the design of this component an
post-image
I was just about to go to the forum and rant, but then I saw my balance. Never mind—the market is always right.

A few days ago, when it repeatedly pushed higher in the afternoon, the overhead resistance above $CAP was right there. Every push upward fell just short, volume failed to follow, and there was no one to take the offer even when it moved up—the bull trap smell was too strong. I warned at the time that it was facing resistance at the highs, so don’t rush to enter.

Shorting all the way from 0.08720 to 0.0733, with floating profit at +313.18%, this short trade delivered the answer.
post-image
CAP+1.24%
XRP-2.38%
ETH-3.59%
$ZEC has already fallen enough, so why can’t we say it has bottomed?
$ZEC 24-hour -9.62%, current price 1,187.55. The 1-hour and 4-hour RSI are 39 and 29, respectively. Oversold conditions can create demand for a rebound, but a rebound only shows that the decline was sharp; a bottom still requires the price to stop damaging the structure.
Let’s pull the camera back to the 24-hour range: low 1,112.77, high 1,344.62. Where does the current price of 1,187.55 sit within this range? That directly affects the meaning of the same signal. Near the high, strength needs to prove it is not a push-and-dro
post-image
ZEC-10.85%
$ZRO ’s direction appears aligned, but its declining volume shows no commitment
$ZRO 24-hour change: -7.42%, current price 2.008. The 1-hour and 4-hour structures are both weak, yet current trading volume is only 0.12 times the average volume of the previous 20 candles. The direction is aligned, but participation has not caught up—this is the point most worth debating right now.
Set emotions aside; the structure provides very specific information. The 1-hour EMA20 is at 2.046, with the current price below it; the 4-hour EMA20 is at 2.079, also with the current price below it. Shorter time frame
post-image
ZRO-10.14%
crypto market update sol
live-cover
LIVE78
$JCT Quickly, quickly, open a short! This is a selling opportunity from the top,
I’ve already entered a short with 1 thousand—come on, let’s make profits!Target: 0.0020
post-image
JCT+57.93%
Load More

Join 40 M users in our growing community

⚡️ Join 40 M users in the crypto craze discussion

💬 Engage with your favorite top creators

👍 See what interests you

Trending Topics

Gate Money Officially Launches

3.45k Views12.86k Discussing

Gate officially launches Gate Money, a global integrated financial services app that brings digital assets, fiat, stocks, ETFs, gold, bank accounts, and payments into one Gate App. Users can manage assets, invest, send and receive funds, convert currencies, and make payments — all from a single account. Which use case are you most excited about? [👉 Learn more](https://www.gate.com/announcements/article/102094)

Fed September Minutes Lean Hawkish

64.14k Views2.72k Discussing

Samsung Q3 Operating Profit Surges 782.5%

36.88k Views1.93k Discussing

View More