Share your thoughts
placeholder
Article
I didn’t do anything—I just went to the bathroom, and by the time I came back, the candlestick chart had already done the work for me.
While everyone else was running, the $BEAT pump actually had no volume, getting weaker the higher it went. I didn’t hesitate at the time, immediately placed the short order, set the stop-loss, and went to wash my hands.
When I came back, the order entered at 0.1339 had already reached 0.1241, with a +141.16% gain delivered right to me. With this kind of move, I didn’t even need to think. The buildup was painfully sluggish, but the result was truly satisfying.
T
post-image
BEAT+4.08%
LAB+7.17%
ETH-2.80%
When I initially opened a long position in $UAI , I didn't actually plan to hold it for long. At the time, I judged that the short-term structure was relatively strong, so I tested the waters around 0.38587. Unexpectedly, after entering, the market kept moving more smoothly, directly offering profit potential far beyond expectations. Having a position steadies your mindset—you can hold through pullbacks, and only when the price surges do you remember that it's time to manage the position.
So today I made the decision to take profit directly on the +908.72% position, locking in most of the gains
post-image
UAI+30.82%
BTC-1.88%
XRP-3.40%
【$B Signal】Long — dual-timeframe MACD expansion breakout
$B 1H RSI 94.98, 4H RSI 89.46, dual-timeframe MACD bars expanding in sync, funding rate 0.0514%, order-book buy pressure share 1.38. The high-volume candle pushed from 0.1364 to 0.1977, with the latest 1H low at 0.1952, holding above.
🎯Direction: Long
⚡Entry/limit order: 0.199998 - 0.200600
🛑Stop-loss: 0.198594
🚀Target 1: 0.203609
🚀Target 2: 0.205114
🛡️Trade management:
- Upon reaching Target 1, reduce the position by 50% and move the stop-loss up to breakeven. If the price falls back to the entry level, exit at breakeven.
OI is sta
post-image
BTC, ETH, Gold, and Crude Oil Analysis
live-cover
LIVE1,070
$BTC Signal: 1H momentum recovery, probing long
$BTC 1H MACD histogram 13.48, buy ratio 0.60, funding rate -0.0003%. 4H short momentum is weakening, while the 1H Bollinger Bands are only $700 apart, approaching a convergence threshold. Order book depth imbalance is 22.69%, with bids at the top level clearly dominant.
🎯Direction: Long
⚡Entry/limit order: 79445.546 - 79684.600
🛑Stop-loss: 78887.754
🚀Target 1: 80879.869
🚀Target 2: 81477.504
🛡️Trade management: Execution strategy: After reaching Target 1, reduce the position by 50% and move the stop-loss up to the breakeven level. If the pric
post-image
BTC-1.88%
Everyone’s staring at $CL /USDT’s 91.05—but the real money is hiding beneath the range’s floor.

$CL /USDT - SHORT

Trade Plan:
Entry: 90.94 – 91.16
SL: 92.09
TP1: 90.27
TP2: 89.75
TP3: 88.97

Why this setup?
Why short now? The 4h signal says SHORT (55% confidence), and we’re stuck in a 1D range—that’s a compression zone. RSI on 15m is 52.68, not overbought, but ATR (0.43) shows volatility is thinning. When ranges tighten, breakouts fake out. Entry sits at 91.05 with TP1 at 90.27—a quick scalp. TP2 at 89.75 is where the range’s lower lip gives way. If 90.94 breaks, momentum shifts fast.

D
CL+0.59%
🔷️ K-Line & Structure Analysis of $CYS
​Current Trend: Short-term bearish impulse followed by horizontal range consolidation on the 15-minute timeframe.
​Candle Pattern: Sharp sell-off from 0.2492 down to 0.2368, followed by small-bodied candles (spinning tops/dojis) indicating lower selling pressure and base formation near local support.
​Moving Averages: Price is attempting to reclaim MA5 (0.2391) and MA10 (0.2390). MA30 (0.2422) acts as dynamic overhead resistance.
​Key Support Levels: 0.2368 (Local Support) | 0.2345 (24h Low)
​Key Resistance Levels: 0.2422 (MA30) | 0.2492 (Recent Swing
post-image
CYS-12.63%
SLINK Insider trading moves
live-cover
LIVE1,924
#USELESSSurgesAnother67%
USELESS extended its move and added another 67 percent in 24 hours after the public call from Bonk Guy. Market capitalisation has reached approximately 213 million dollars. Bonk Guy stated that his conviction on this trade exceeds the 2023 BONK position and that his current holding is up roughly 1.68 million dollars. The combination of a high-profile call and a vertical price reaction remains the backdrop.
On the 4-hour chart price is trading at 0.23790 after a high of 0.24050. The 9-period MA sits at 0.23876 and the 50-period MA is much lower at 0.12024. Bollinger Ba
USELESS-6.58%
  • 1
Markets rise and fall, and being stuck is a phase many people go through, but ruminating in place won't bring a solution🍑.
Don't pin your hopes on an accidental market rebound. Recognizing the problem and adjusting your approach is the key to breaking through. Put aside the tension of watching the market this weekend and give yourself some space to think.
It's easy to get stuck in a rut when fighting alone, so I'm looking for🪵 like-minded companions. If you're facing the 🍑trapped-position problem and want to sort through your thoughts together and give each other pointers, come join us$BTC
post-image
BTC-1.88%
ETH-2.80%
$XRP
A flawless chart, a perfect correction, and a beautiful breakout from the downtrend...
The next few weeks are going to be very exciting.
2.5$⌛️
3.5$⌛️
6$⌛️
13$⌛️
Save it, share it, and wait.
post-image
XRP-3.25%
  • 4
  • 1
This Week’s Results (August 31–September 4):
A total of 30 trades were made during the week, with 23 successfully taking profit, bringing in $25,086 in total (calculated for one person)!
Once you endure the grinding volatility, the day when the trend pays off will come. Gold never lets down those who persevere.
#黄金 #BTC收复8万美元 $BTC $ETH
BTC-1.85%
ETH-2.70%
Everyone’s staring at SNDK’s range—but the 4H just whispered a secret that most will miss.

$SNDK /USDT - SHORT

Trade Plan:
Entry: 1751.49 – 1761.03
SL: 1802.01
TP1: 1721.94
TP2: 1699.07
TP3: 1664.75

Why this setup?
- Price is pinned at 1756.26, exactly the 1H reference—no fakeouts, just a coiled spring.
- RSI (15m) at 48.99 = zero momentum, meaning shorts aren’t crowded yet.
- ATR (1H) at 19.06 gives us a clean 2.2% buffer to SL (1802) vs 3.8% to TP1 (1721.94).
- 1D trend is range, but 4H direction says SHORT—why wait for a breakout when the mean reversion is already armed?
- Con
SNDK+9.90%
No conviction, can’t hold—the profits on this move are paper-thin, but I love it.
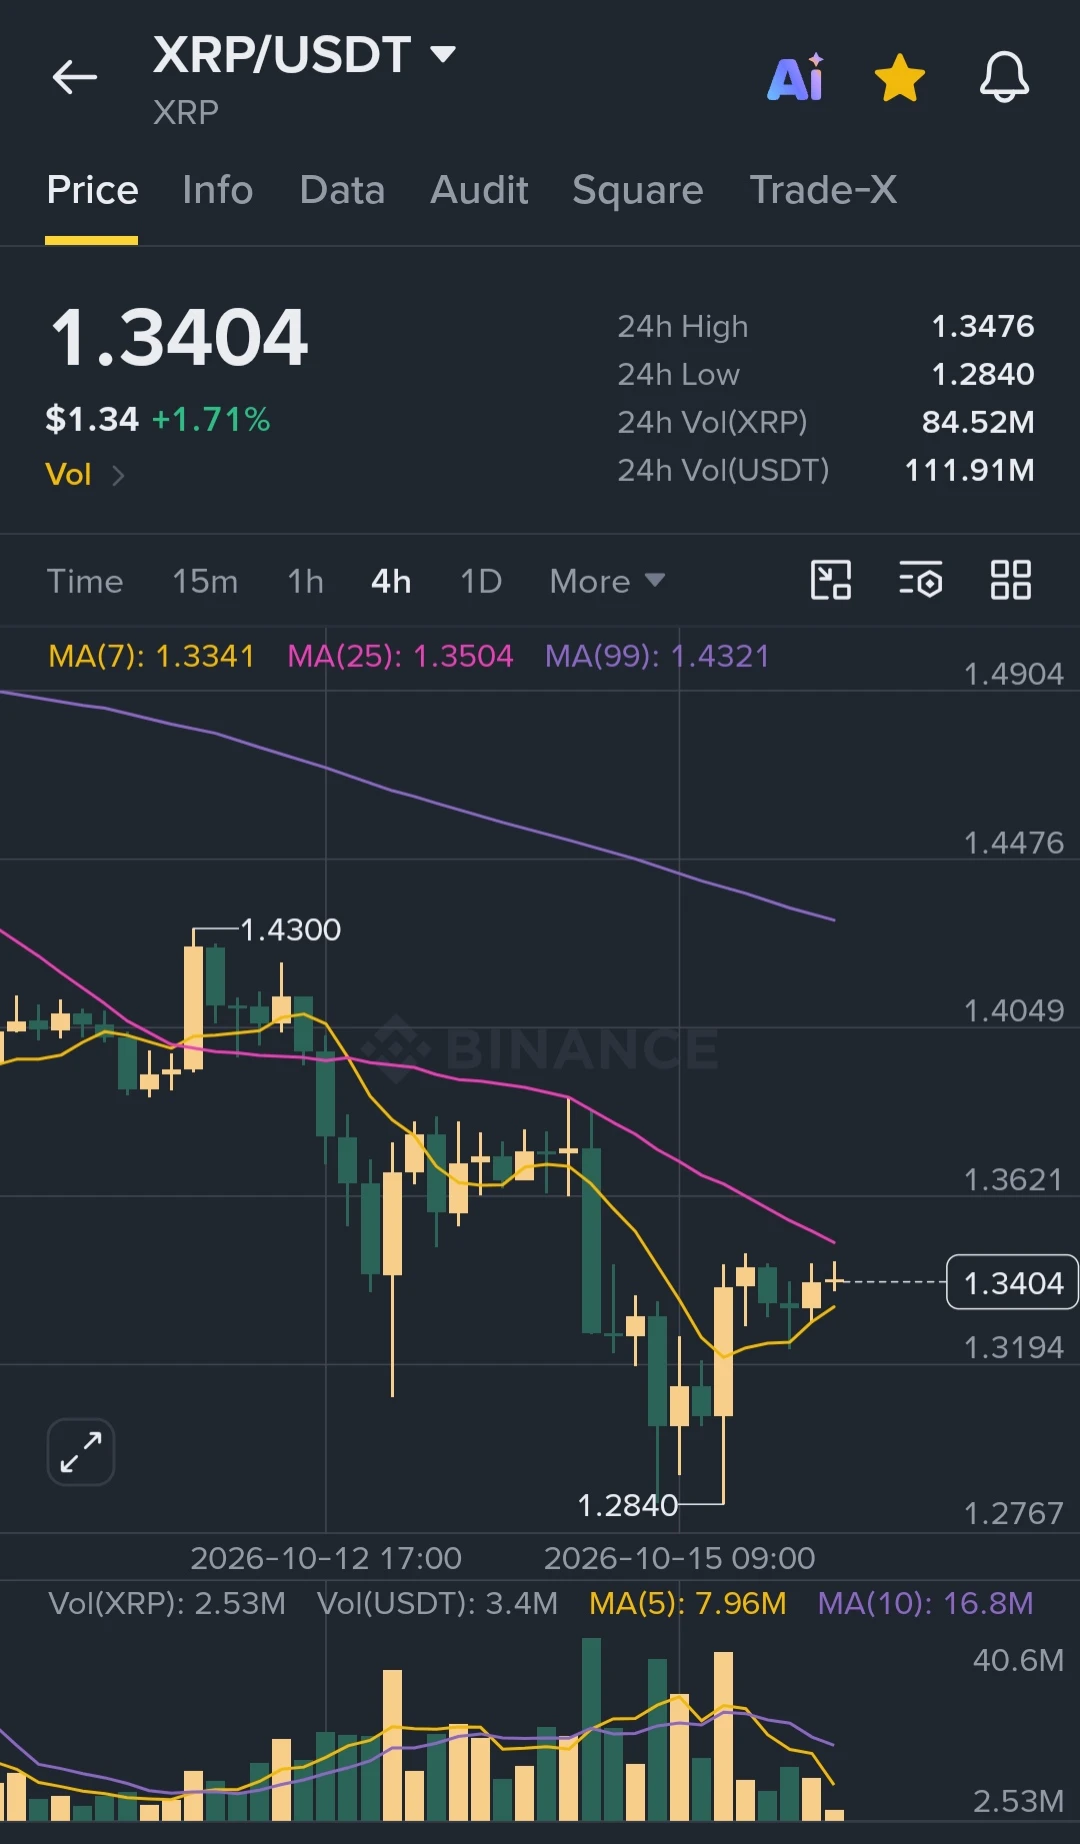
During the repeated intraday swings, $XRP repeatedly retested 1.3845 without breaking below. The bottom was being ground out but kept rising, and the price-volume action was healthy. I judged then that this was accumulation, not distribution, so I firmly went long and held on.
Just checked again: the price has reached 1.4032, which works out to +125.64%. That’s enough for a good meal. It was truly sluggish before, but the result is truly satisfying.
Take profits when it’s time. Lock in 80% first, and set the rem
post-image
XRP-3.40%
BTC-1.88%
ZEC-0.53%
Last night, during the nonfarm payrolls release, gold staged a rapid plunge!
Gold prices quickly fell from around the 4476 high, hitting a low near 4365. The market weakened instantly once the bearish nonfarm payrolls data was released.
We had already provided the target at 4440. In this kind of data-driven market, a single spike can send prices rapidly lower, leaving no time to make a decision after the move is over.
Those who followed the strategy basically exited smoothly around 4400, securing a solid 85-point move. #黄金 $XAUT
JiangYiGuanJin
9、9/4 Afternoon Market Outlook and Strategy
The intraday gold price came under pressure and pulled back after surging to 4487.23, with the current price at 4469.52. On the one-hour chart, short-period moving averages have turned downward, while the price is oscillating back and forth around the moving averages. Following a continuous rise, bullish momentum is gradually weakening, and the market has entered a high-level correction phase, shifting overall from a one-sided rally to a range-bound pattern.

The short-term resistance zone above is 4474‑4487, representing the intraday pressure area; the first support below is 4460, with key defensive support at 4432. If support is breached, further downside room will open up.

The US unemployment rate data is due later tonight. Major data can easily break the current narrow range-bound pattern. Frequent trading is not advisable during the consolidation phase; wait for key levels before planning an entry.
Recommendation
Short the 4474‑4487 area, set a stop-loss above 4494, and target 4460‑4440. Enter and exit quickly for short-term trades. #黄金 $XAUT
repost-content-media
XAUT-0.94%
$4 Signal】Long | 4H upper-band breakout + 1H volume-contraction consolidation
$4 RSI 83.7, 4H MACD histogram expanding, with price holding above the Bollinger upper band after breaking through it. 1H volume contracted to 206M, and the MACD histogram narrowed while remaining positive. The order-book bid/ask depth ratio is 0.32, with thick sell orders. The funding rate is 0.0638%, OI is flat, and the price has not broken below EMA20_1h.
🎯Direction: Long
⚡Entry/Limit order: 0.02794691 - 0.02803100
🛑Stop-loss: 0.02775069
🚀Target 1: 0.02845146
🚀Target 2: 0.02866170
🛡️Trade management:
- Execu
post-image
4+74.05%
BTC-1.85%
ETH-2.70%
SOL-1.68%
#BTCReclaims80K
Bitcoin is back above $80,000.
And this is more than just another number on the chart.
The $80K level has become one of the most closely watched psychological and technical zones in the Bitcoin market. Reclaiming it puts the spotlight back on the bulls and raises an important question:
Is Bitcoin preparing for another major leg higher?
Recent market data shows that the recovery is being supported by renewed institutional interest. U.S. spot Bitcoin ETFs recorded approximately $730.9 million in net inflows in a single day, their strongest daily inflow since January. That kind o
Everyone’s staring at the green 15m RSI, but the 4h chart is screaming something else for $ESPORTS /USDT.

$ESPORTS /USDT - SHORT

Trade Plan:
Entry: 0.01471 – 0.01479
SL: 0.01517
TP1: 0.01444
TP2: 0.01423
TP3: 0.01392

Why this setup?
- Daily trend is **bearish**, and the 4h setup gives a 95% confidence SHORT—this isn’t a coin flip.
- Entry zone: 0.01475 (0.01471–0.01479). The 15m RSI at 57 is just a dead-cat bounce inside a downtrend.
- Targets are stacked: TP1 0.01444 → TP2 0.01423 → TP3 0.01392. That’s a 5.6% drop from entry if momentum follows.
- Invalidation is clear at 0.01535—
ESPORTS+1.93%
Everyone’s chasing SUI at 0.7862—but the 15-minute RSI just screamed 84. That’s not momentum; that’s a fuse.

$SUI /USDT - SHORT

Trade Plan:
Entry: 0.7838 – 0.7886
SL: 0.8092
TP1: 0.7689
TP2: 0.7574
TP3: 0.7402

Why this setup?
Why now? The 1D trend is *range*, not breakout—so this spike is a liquidity grab.
- RSI 15m at 84.01 = overbought exhaustion, ripe for a snap-back.
- ATR 1h shows thin volatility (0.0095), meaning stops are tight; a push to TP1 (0.7689) could cascade into TP2 (0.7574).
- Entry zone 0.7838–0.7886 is the *rejection pocket*—price has visited it twice without clos
SUI+1.28%
This $LTC long trade has been quite comfortable, but what really gives me peace of mind isn’t the unrealized profit—it’s the act of locking in the gains. After entering around 50.48, the market moved upward amid volatility. There were a few pullbacks along the way, but I judged that as long as it didn’t break below the cost area, the structure remained intact.

When it rose to the first target, I closed 70% as planned and moved the stop-loss on the remaining 20% directly above the entry price. The benefit of this approach is that my mindset completely changes—the remaining position can fluctu
post-image
LTC+3.77%
LAB+7.17%
DOGE-2.02%
Load More

Join 40 M users in our growing community

⚡️ Join 40 M users in the crypto craze discussion

💬 Engage with your favorite top creators

👍 See what interests you

View More