


Share your thoughts
placeholder
Article
Everyone’s watching silver’s fake breakout—but the 4H tape just whispered a trap.

$XAG /USDT - SHORT

Trade Plan:
Entry: 66.15 – 66.37
SL: 67.34
TP1: 65.45
TP2: 64.91
TP3: 64.10

Why this setup?
Why now? $XAG /USDT sits at 66.26 with a SHORT bias (55% confidence), yet the 1D is rangebound, not trending. RSI on the 15m is only 53—no momentum behind the push. ATR (0.45) says volatility is thin, so the 66.15–66.37 zone is a magnet for stop hunts. If price rejects here, TP1 at 65.45 is the first domino; TP2 at 64.91 is the real prize. But the alt map (TP1 at 67.07) shows bulls are armed—so thi
XAG-1.30%
$SOL Signal】Shorts in control + order book imbalance
$SOL Order book depth imbalance -20.66%, Bid/Ask ratio 0.66, with sell-side depth directly suppressing any rebound. The 1H MACD histogram is -0.3454, while RSI at 41.64 has not reached oversold territory, and no active buying has emerged at the lows. The 4H Bollinger midline at 101.45 is repeatedly being contested, with price moving along the line, while the lower band at 97.37 leaves the bearish path open.
🎯Direction: Short
⚡Entry/limit orders: Enter in batches at 101.1756 - 101.4800
🛑Stop loss: 102.4948
🚀Target 1: 99.9578
🚀Target 2: 9
post-image
SOL-3.52%
no crying in the casino 🎰
post-image
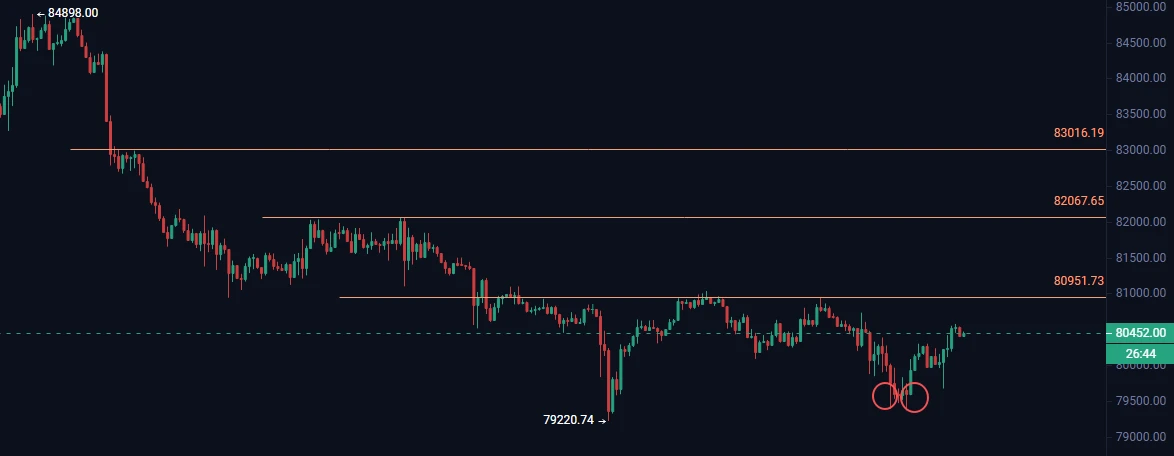
A few days ago, I was still calculating whether I had enough money for instant noodles this month; this morning, I was already wondering whether to add sausage. This wave from $BTC has really come through, with the opening price moving from 77967.8 to 79734.3 and delivering +393.09% gains—truly a lifeline.

Thinking back, when I took that last look before bed a few days ago, the market was still consolidating on declining volume. I judged that the bottom structure had already fully formed, and all it needed was a bullish candle to confirm the direction. As soon as the market opened today, it
post-image
BTC-2.48%
SOL-3.52%
ZEC+6.76%
Q Market Projection
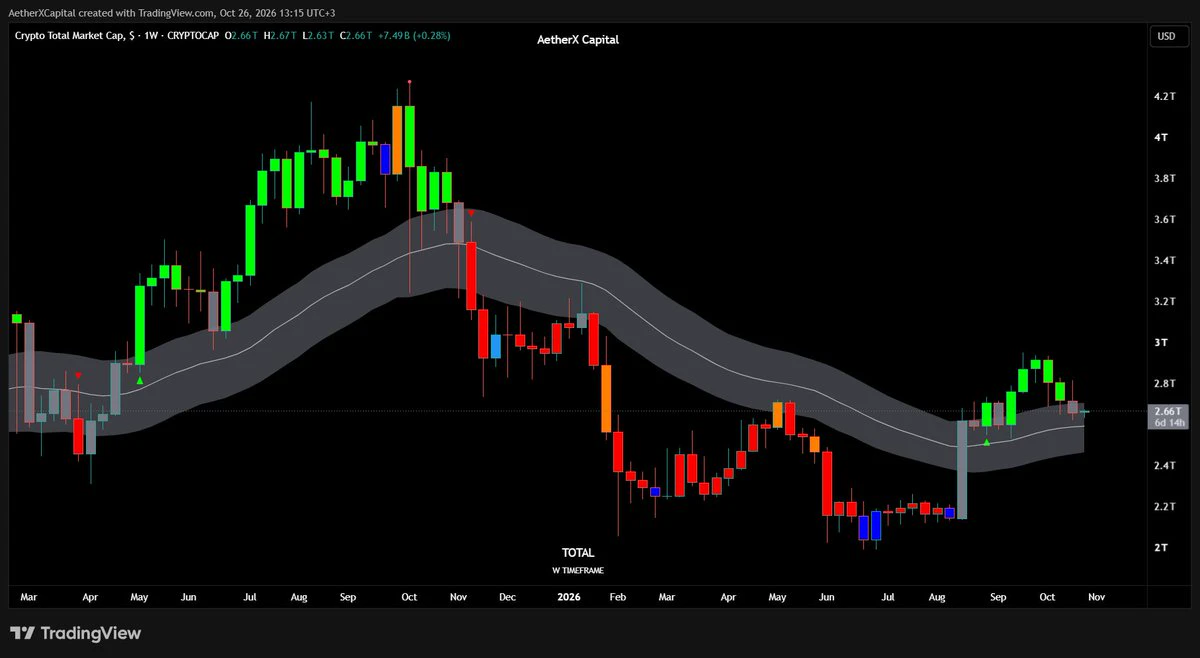
A very good medium- to long-term buying opportunity will form before the end of October.
Figure 1 shows the trading range from October 2025 to March 2026.
Figure 2 shows the recent consolidation range.
The false breakdown and recovery on November 21, 2025, correspond to our false breakdown and recovery on July 29, 2026.
After moving sideways and consolidating for some time, the high of 748 above will most likely see a false breakout before falling back to the lower boundary of the range at 686, then rebounding to the range midpoint at 714. After fluctuating between 686 and
BTC-2.50%
Everyone’s staring at SKYAI’s bounce—I’m watching the 95% short signal that just armed.

$SKYAI /USDT - SHORT

Trade Plan:
Entry: 0.05651 – 0.05715
SL: 0.05988
TP1: 0.05454
TP2: 0.05302
TP3: 0.05073

Why this setup?
- 4H bias is SHORT with 95% confidence, while the 1D trend stays bearish—this isn’t a dip, it’s a breakdown rehearsal.
- RSI on 15m sits at 46, meaning momentum hasn’t flipped bullish; it’s just catching its breath before the next leg down.
- Price is hovering at 0.05683, but TP1 at 0.05454 is only a 4% slide away—and TP3 at 0.05073 offers over 10% if the bears stay in contr
SKYAI-1.77%
XRP Technical Outlook: XRP Holds Breakout Zone as Bulls Target $1.56–$1.91
XRP is showing a strong bullish recovery after breaking out from the prolonged descending structure. Price has reclaimed the $1.35–$1.38 area and is currently holding around the $1.40 region.
The latest market structure remains constructive, but XRP needs to clear the $1.4104–$1.4439 resistance cluster for the bullish move to gain stronger confirmation. Recent market analysis also identifies the $1.35–$1.40 area as an important demand/support region.
📈 EMA Structure
- 20 EMA: $1.3297
- 50 EMA: $1.2326
- 100 EMA: $1.224
XRP-4.85%
  • 2
$BTC Signal】Go long—1H volume contraction, decline halted, buy at lows
$BTC Order book buy/sell imbalance: -83.59%; the sell wall remains intact; volume at 13:00 contracted to 1131, and active selling pressure has dried up. Price at 79531 is hugging the outside of the lower Bollinger Band, while the 1H chart left a $178 lower wick, with low-level buying support beginning to emerge. RSI(1H) has slid to 41, while the 4H MACD histogram remains positive, creating conditions for an oversold recovery.
🎯 Direction: Long
⚡ Entry/limit order: 79292.41 - 79531.00
🛑 Stop-loss: 78735.69
🚀 Target 1:
post-image
BTC-2.48%
$1000 to $100,000 Crypto Trade Challenge Today
live-cover
LIVE525
Beginner Trader - Real Account Live
live-cover
LIVE56
Hello everyone, this is my account
This is also my
fundamental reason for leaving this world.
post-image
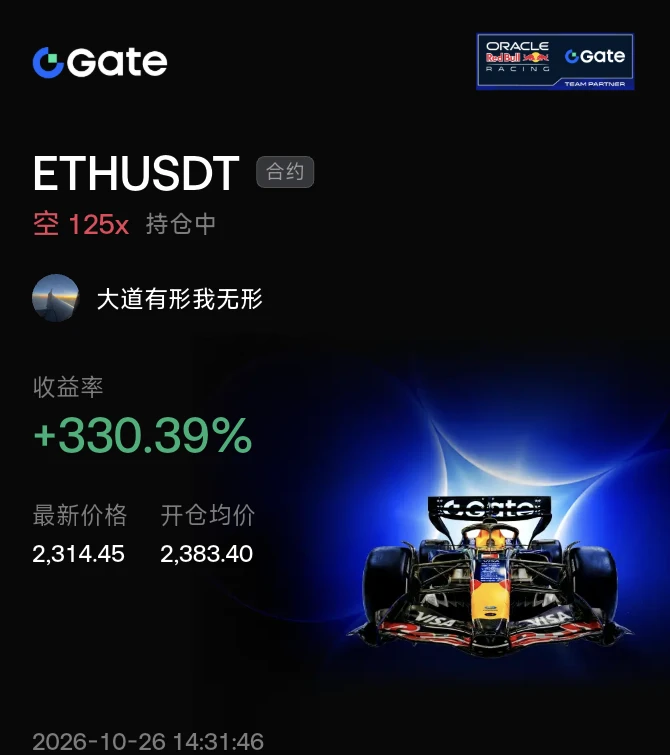
No action, no analysis, just pure luck—this result is embarrassing even to talk about. A few days ago, I took one last look before bed and saw $ETH consolidating at the bottom around 2086.30. It had been grinding sideways for several days without breaking down, so I thought, wasn’t this the perfect time to pick up a bargain? I opened a long and placed the order. When I opened the chart in the morning, it was at 2453.28, up +3057.29%—that was a satisfying chunk of profit. Staying out of the market isn’t a sin; opening positions recklessly is. I took profit on 80% of the position first, and mov
post-image
ETH-2.49%
BTC-2.48%
SOL-3.52%
I only meant to snag a free breakfast, but the market ended up serving me six months’ worth of dumplings.
During the intraday bottoming phase, $NVDAX moved sideways around 216.97 for so long I was nearly falling asleep, but there was clearly buying support below and the low-volume sell-off couldn’t push it down. I judged the bottom to be solidified and went long immediately, without hesitation.
I just checked the chart, and the price has already climbed to 230.16, +566.36%. This bite of meat went down nicely—everyone on board should be waking up laughing.
Take 80% off the table first, and mov
post-image
NVDAX+0.46%
ETH-2.49%
DOGE-4.50%
Everyone’s long silver—until they see what’s hiding at 66.24 on $XAG /USDT.

$XAG /USDT - SHORT

Trade Plan:
Entry: 66.12 – 66.36
SL: 67.39
TP1: 65.38
TP2: 64.81
TP3: 63.95

Why this setup?
• 4H bias is SHORT with 55% confidence—not a slam dunk, but the range-bound 1D trend favors selling rallies, not chasing breakouts.
• RSI (15m) at 51.27 is dead neutral, giving price room to drift lower without being oversold.
• ATR (1h) at 0.477 suggests a slow bleed—TP1 at 65.38 is a 1.3R move, TP2 at 64.81 adds another 0.8R.
• Why now? The “Waiting” status means the invalidation at 66.98 is your
XAG-1.30%
$120,000 in tuition fees, getting liquidated on leverage during last year’s SOL rally, plus chasing trash coins due to FTX’s lingering fallout, left me completely wiped out at the bottom of the bear market. I’ve only just recovered to $70,000 on this move today. I can’t claim to have turned things around, but the lesson is etched in my bones: FOMO without data to back it up is just giving money away.
Looking at $USELESS ’s current chart, my hands are shaking a little. The current price is 0.2506, up 35% in 24h, after surging as high as 0.2879 before crashing back down, with a low of 0.1833 and
SOL-3.52%
USELESS+31.87%
BTC-2.50%
I originally wanted to cut my losses and sacrifice the position to the heavens, but before I could, the meat cooked itself. When the sell-off first hit in the early session, $SOXS already gave off a strong sense that something was wrong: trading volume was low, and there was simply no one willing to buy the rebound. It was even more obvious when I checked the market after lunch—the resistance above was rock-solid, and the rebound was extremely weak.
My judgment at the time was simple: with this kind of price action, any move up would just hand money to short sellers. I went short at 52.38, wi
post-image
SOXS-9.68%
SOL-3.52%
ADA-5.45%
With this trend, I don’t even need to think—the account is dancing on its own.
While everyone else was still watching from the sidelines, I kept my eye on those few rebounds. The volume didn’t follow, and the price stayed under pressure—clearly, there was no one willing to take it higher. I quietly entered a short at 0.3043, and it felt great. At the time, I even wondered if I was acting too soon, but the market immediately proved me right.
Now the price has slid to 0.2368, with returns at +435.46%. That was a satisfying bite of profit. The timing was right, and the wait was worth it. I’ve tak
post-image
BNB-1.14%
SNDK+11.68%
$ETH Signal】Short-term short, 4H long bearish candle + selling pressure dominant
$ETH The 4H long bearish candle fell 2.18% through EMA20, with aggressive selling dominant and a buy ratio of 0.47. The 1H MACD histogram’s negative value expanded, with the rebound stalling around 2460. Order book depth was -1.15%, with clear suppression from sell-side orders.
🎯Direction: Short short
⚡Entry/limit order: 2445.5513 - 2452.9100
🛑Stop-loss: 2477.4391
🚀Target 1: 2416.1163
🚀Target 2: 2397.7195
🛡️Trade management:
- Execution strategy: Reduce the position by 50% after reaching Target 1 and move th
post-image
ETH-2.49%
$DASH zec—these two are the kings of altcoins; hold forever.
DASH+27.16%
XAUT just printed a 4h signal most gold bugs will call fake — but the math says otherwise.

$XAUT /USDT - SHORT

Trade Plan:
Entry: 4420.2 – 4430.2
SL: 4472.8
TP1: 4389.5
TP2: 4365.7
TP3: 4329.9

Why this setup?
Why now? The 1D range isn't respecting 4425 as support — it's acting as resistance. RSI on 15m sits at 47.2, meaning no oversold bounce fuel left. ATR (19.8) confirms enough volatility to travel the full 55-point path to TP1. Target stack is clean: 4389 → 4365 → 4329. Invalidation sits at 4465, just 40 points above entry — asymmetric risk/reward favors the short.

Debate:
Are you f
XAUT-0.91%
Load More

Join 40 M users in our growing community

⚡️ Join 40 M users in the crypto craze discussion

💬 Engage with your favorite top creators

👍 See what interests you

View More