Share your thoughts
placeholder
Article
Moving to $NVDA ‌ – holding steady but facing resistance!"
Nvidia is trading at $230.40, up +0.87% on the day. The 24h high is $234.75 and the low is $229.63. EMA5 ($230.50) and EMA10 ($230.64) are slightly above price, while EMA30 ($225.30) is well below, indicating the longer-term trend is still supportive. MACD is slightly negative at -0.09, but DIF (2.48) is approaching DEA (2.58) – a bullish crossover could be forming. After-hours price is down -0.41% to $229.45, signaling some weakness. I'm watching the $229.63 support – a break below could send it toward $224.97.
Trading Plan:
· Entry:
post-image
NVDA-0.42%
  • 7
  • 1
Everyone’s watching $HOME /USDT pump—but the 4h tape just whispered a 95% secret.

$HOME /USDT - SHORT

Trade Plan:
Entry: 0.00614 – 0.00616
SL: 0.00627
TP1: 0.00606
TP2: 0.00599
TP3: 0.00590

Why this setup?
- 1D trend is bearish; this 15m RSI at 66 is the last gasp before gravity.
- Price is pinned at 0.00615, but the real order book says 0.00606 (TP1) is the first magnet.
- ATR (1h) is razor-thin at 0.000052—meaning volatility is coiling for a violent snap DOWN.
- Entry invalidates only above 0.00617—we’re 2 ticks from the line in the sand. Why now? Because the 4h structure hasn’t
HOME+2.16%
Everyone is staring at the 4H chart, but the 15-minute RSI just whispered a secret about $ETH /USDT that most will ignore.

$ETH /USDT - SHORT

Trade Plan:
Entry: 2453.94 – 2459.42
SL: 2482.95
TP1: 2436.98
TP2: 2423.84
TP3: 2404.14

Why this setup?
Why now? The daily trend is range-bound, but the 4H signal is a low-confidence SHORT (55) waiting for confirmation. The 15m RSI at 59.79 suggests a minor push before rejection. Entry zone: 2453.94–2459.42. Invalidation sits tight at 2460.93—a break flips the script. If rejected, TP1 at 2436.98 is the first magnet, then TP2 at 2423.84. ATR (1h) of
ETH-2.75%
Everyone’s staring at LINK’s RSI—but they’re blind to the 95% confidence trap.

$LINK /USDT - LONG

Trade Plan:
Entry: 11.779 – 11.827
SL: 11.574
TP1: 11.975
TP2: 12.090
TP3: 12.262

Why this setup?
- 1D trend is bullish, yet 15m RSI at 71.13 screams overheated—this is the classic pre-pump shakeout.
- Price is armed at 11.803 with TP1 at 11.975; the 4h structure is coiling, not reversing.
- ATR (0.0955) is tight—meaning the breakout, when it comes, will be violent. Why wait for confirmation when the stop (11.574) is only 1.9% away?

Debate:
Are you fading this RSI spike or loading the
post-image
LINK-2.44%
in on $BULLA ‌– still up but the momentum is fading fast!"
BULLA is currently trading at $0.063152, up 81.68% on the day. The 24h high is $0.081046 and the low is $0.025231 – that's a massive range. EMA5 ($0.064151) and EMA10 ($0.066546) are both below price, while EMA30 ($0.064292) is slightly above – meaning price is hovering right around the 30-period average. MACD is negative at -0.002700, with DIF (0.001568) below DEA (0.004268) – this is a bearish signal showing momentum is fading. Volume is still strong at 1.75M, but MA10 (7.13M) is below MA5 (10.17M), suggesting buying pressure is eas
BULLA+59.53%
  • 5
  • 1
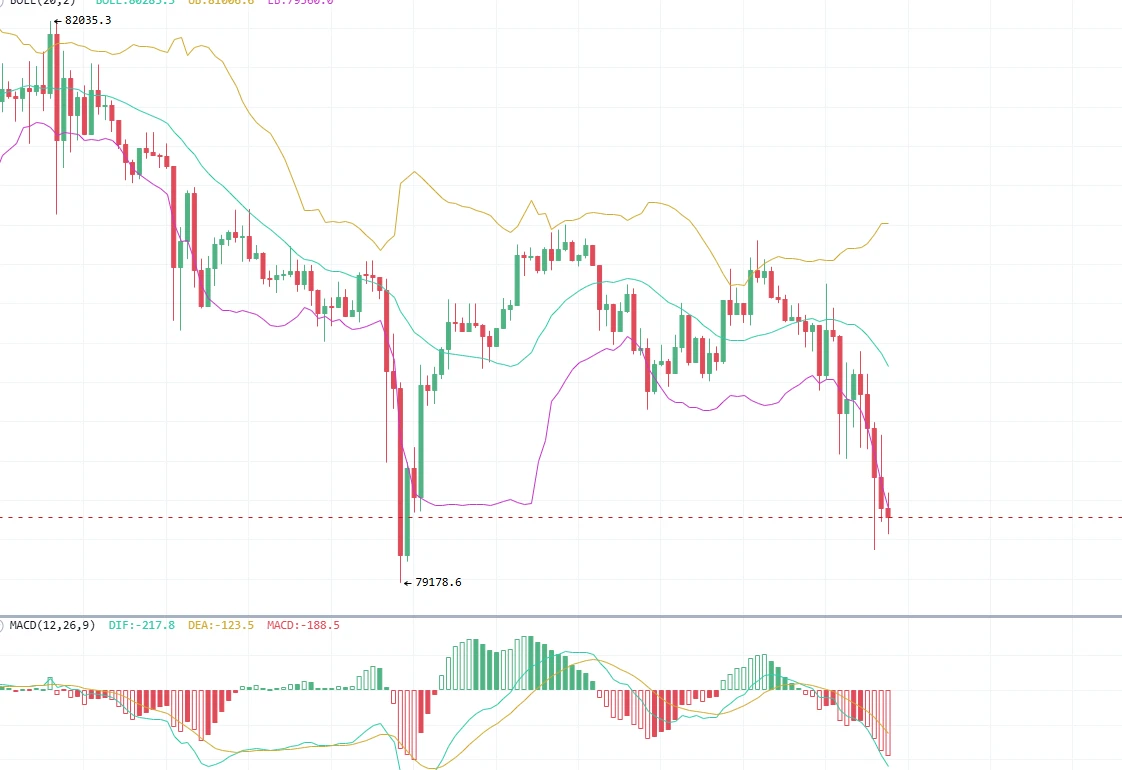
The weekend market is quiet, with little to analyze, and overall the focus is on range-bound recovery. Last night’s nonfarm payrolls data triggered sharp market volatility. It is recommended to stay on the sidelines over the weekend and patiently wait for possible reversal opportunities on Monday.
Technically, the hourly chart is still repeatedly battling within the range. Yesterday’s two large bearish candles precisely retested the support below, and the long wicks were not caused by heavy bearish volume, instead leaving room for a subsequent rebound by the bulls. As long as the low is not br
post-image
BTC-2.00%
ETH-2.75%
A well-known blogger’s reflections after two consecutive losses—personally, I think every sentence is a gem!
Everyone will encounter a stop-loss! After taking a loss:
Some revenge-trade all in, fantasizing about making it all back in one trade;
Some are devastated and seriously reflect, only to revenge-trade all in again;
Very few people actually turn off their devices and reflect after taking a stop-loss, then re-enter according to their plan. Perhaps this is why the vast majority of people in the crypto space lose money?
Back in high school, we learned to “retain the essence and discard the
post-image
  • 1
Borrow directly on Hyperliquid
post-image
HYPE-2.45%
Finding a job as a broadcaster is really hard!
You even have to put up with the boss pounding you!
post-image
Everyone is watching WLD bounce, but the 4h tape just whispered something they’ll ignore until it’s too late.

$WLD /USDT - SHORT

Trade Plan:
Entry: 0.3996 – 0.4020
SL: 0.4162
TP1: 0.3893
TP2: 0.3816
TP3: 0.3701

Why this setup?
Why now? The 15m RSI is screaming at 80.23—overbought on a knife’s edge.
- 1D trend is *range*, not breakout—so this pump is a guest, not a resident.
- ATR (1h) at 0.0049 means the squeeze is tight; the path of least resistance is down.
- Entry ref at 0.4008 with TP1 at 0.3893 is a 2.8% drop before you blink.
This isn’t a dip-buy. It’s a fade-the-spike setu
WLD+3.20%
$USDJPY The dollar slumped to start September as traders cut bets on a Federal Reserve rate hike this month and a surging yen rippled across global currency markets.
Investors now see roughly even odds of a rate hike at the central bank's Sept. ‌
USDJPY+0.28%
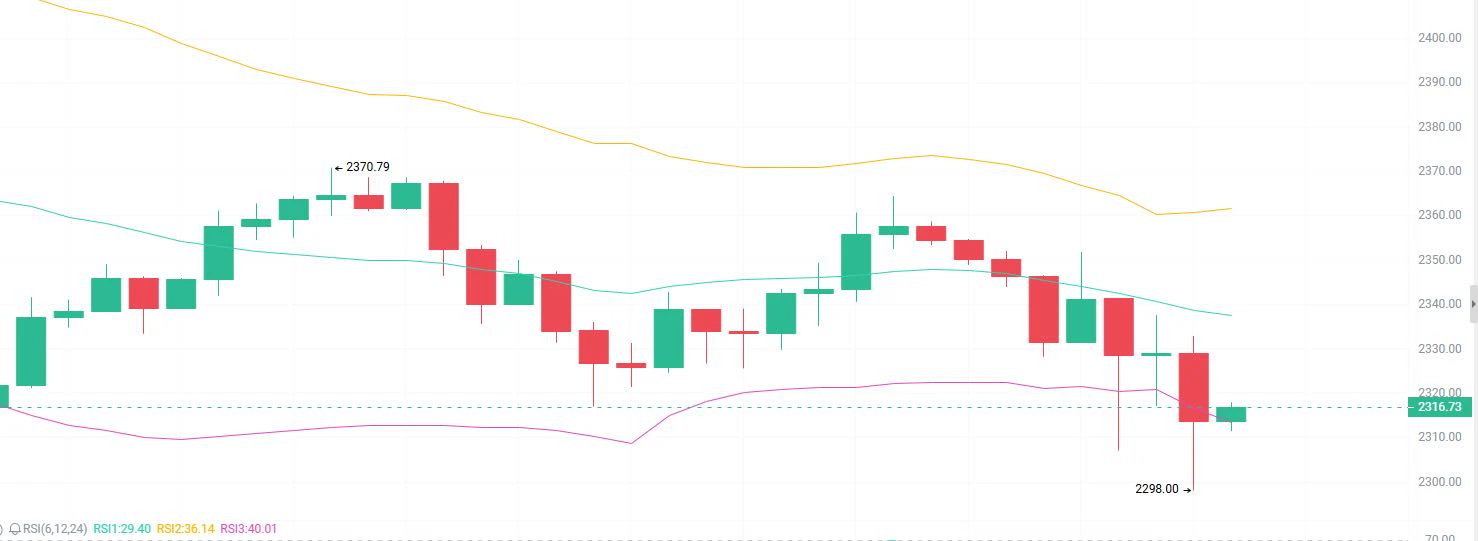
$ETH Signal】1H rebound meets resistance, 4H bearish pressure, target the pullback for a short
$ETH The 1H MACD green bars are expanding, with the price pushed up to 2456. The 1H RSI is only 47, with momentum failing to keep up. The 4H MACD bearish trend is expanding, and the Bollinger Bands are opening downward, with the middle band at 2448 already lost. Trading volume is shrinking, and the funding rate is 0.0057%, slightly bullish but not strong. The best bid/ask are imbalanced, with a bid-ask ratio of 1.80, but aggressive buying at 48%, indicating weak willingness to chase higher.
🎯Directi
post-image
ETH-2.75%
BTC-2.00%
SOL-1.83%
9.5 ETH Analysis
ETH rose sharply on the one-hour chart before turning lower, with the current price constrained by resistance from the moving average at the Bollinger middle band. This is a weak rebound within a downtrend, not a trend reversal. RSI has not formed a valid reversal, while MACD shows an apparent bullish divergence, representing an impulsive correction during the decline. 2458.90 above forms a supply-zone resistance level; if bulls fail to complete a pullback confirmation, the rebound space will be limited. 2445.32 below is the intraday liquidity support level. Once it breaks dow
post-image
BTC-2.00%
GT+6.73%
#Huzhou Xishanyang Just Posted Some Juicy Gossip!
Caught having sex in a car; the woman ran off without her pants on.
🚨 Strategy’s Bitcoin bet is now sitting on a $4.93B unrealized gain.
$MSTR gains since the company began its BTC investment in 2020 :
1. Billions deployed into BTC
2. 800K+ bitcoin:native accumulated
3. Bitcoin became its core treasury asset
post-image
BTC-2.00%
MSTR-1.49%
I already reminded everyone in mid-to-late August to stock up on spot gt. It can still be bought after the subsequent major-cycle correction. This bull market will reach a significant height, so it is worth looking forward to.$GT
GT+6.73%
  • 4
Visa approved
Flight Emirates Enroute Paid with crypto
See you at Token2049 in Singapore
For brands collabs & Side Events DM me
#Token2049
post-image
V-1.00%
Load More

Join 40 M users in our growing community

⚡️ Join 40 M users in the crypto craze discussion

💬 Engage with your favorite top creators

👍 See what interests you

View More