Square
Following
Hot
News
Notifications
Profile
Share your thoughts
placeholder
Article
Break below, break below
Everything breaks below, wiped out completely!!!
Hope the bear market lasts at least 2 months
Let’s talk again in 2027
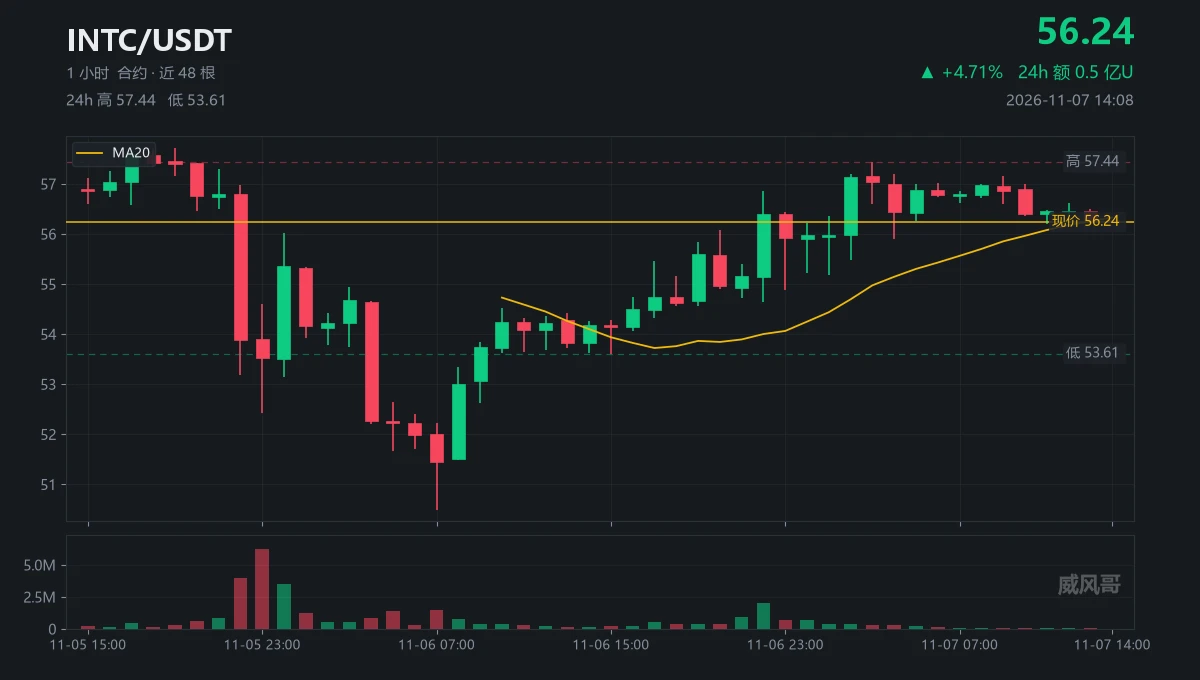
In trader jargon, it’s called a V-reversal—in plain terms, it fills the hole right back in.
From 50.49 to 57.44, up 13.8% in two days—the hole is filled.
57.44 The high was hit at 03:00; it hasn’t been touched again in the eleven hours since.
56.25 Current price, 2.1% below the high.
2,022,283 Volume on the 22:00 candle, 5.2 times the average; it was the only candle with any volume all day.
3,612 Volume at 14:00, 0.9% of average; the weekend order book has only this much left.
-0.0054% Funding rate; shorts are paying, but the pool is thin, so they’re not paying much.
56.33 MA20; price is stuck
post-image
INTC+0.05%
  • 1
Trenches
ZIG
Z
bade
b
ZIG
0x8c...1145
Market Cap
$.
Change
.
24h Vol
$.
Holders
.
BTC
B
bade
b
BTC
C5xp...pump
Market Cap
$.
Change
.
24h Vol
$.
Holders
.
GM
G
bade
b
GM
0x13...7777
Market Cap
$.
Change
.
24h Vol
$.
Holders
.
Diamond
D
bade
b
Diamond
5VCE...pump
Market Cap
$.
Change
.
24h Vol
$.
Holders
.
STONK
S
bade
b
STONK
6GmA...UNgx
Market Cap
$.
Change
.
24h Vol
$.
Holders
.
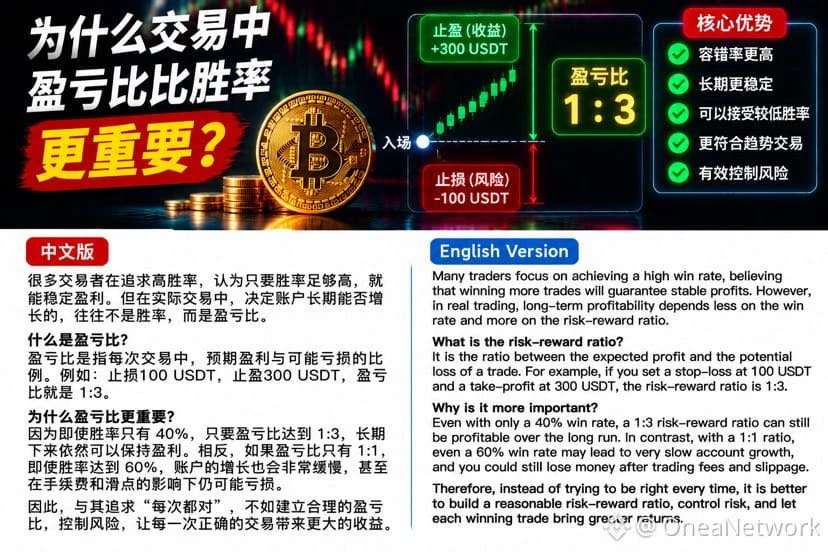
How to maintain sustained high energy:
Many traders pay particular attention to their win rate after entering the market. They hope to win 7 or 8 out of every 10 trades, and may even believe that only a high win rate can lead to consistent profits.
But in reality, what determines whether an account can grow over the long term is often not just the win rate, but also another frequently overlooked metric: the risk-reward ratio.
What is the risk-reward ratio?
Simply put, the risk-reward ratio is the relationship between the expected profit and the potential loss on a trade.
For example, if a trade has a 100 USDT stop-loss and a 300 US
post-image
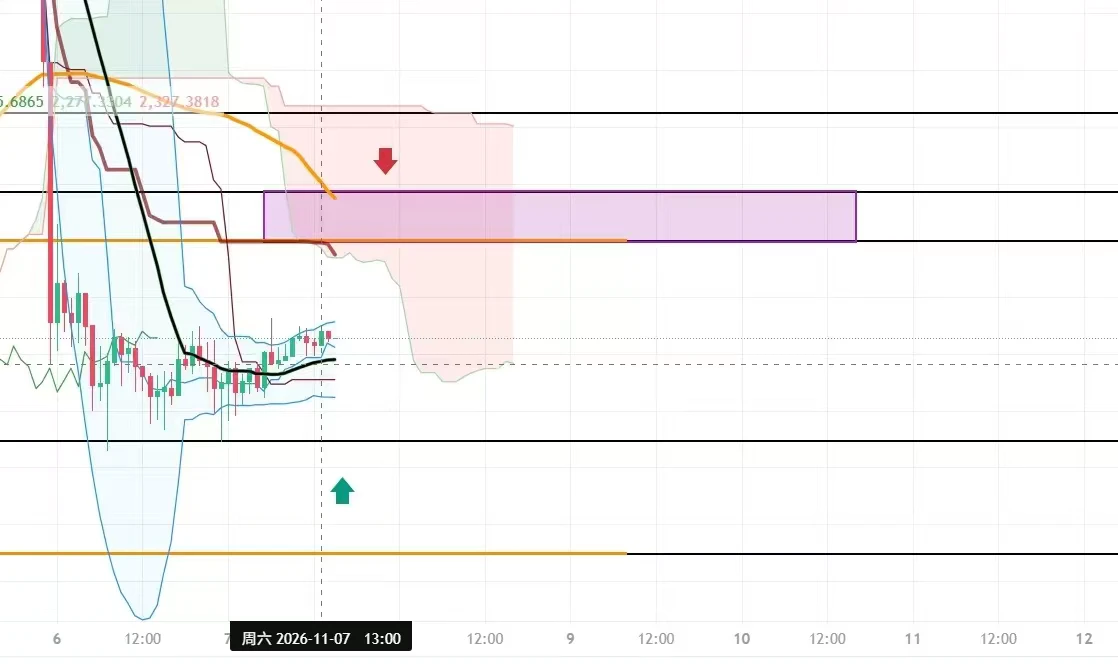
Ether is currently operating within a medium-term bearish framework, with this being an oversold rebound and recovery after a deep decline. The daily bearish structure remains intact, with no confirmed trend reversal signal; downside momentum on the 4-hour chart is gradually fading and entering a consolidation phase; on the 1-hour chart, price is staging a modest short-term rebound from low-level support, with short-term bullish sentiment showing some recovery. The three timeframes converge at 2279 to form resistance, making this the short-term dividing line between bulls and bears. As the reb
post-image
ETH-1.26%
HOT TOPIC PREDICTION
live-cover
LIVE995
What Is Correlation? Why Can Two Coins Often Rise and Fall Together Yet Not Have the Same Risk?

In cryptocurrency trading, many people notice that when BTC rises, ETH often rises too; when the market falls, many altcoins also decline together.

This co-movement can be analyzed using the correlation coefficient. But an important question is: if two coins often rise and fall together, does that mean they carry the same risk?

The answer is no.

First, what is the correlation coefficient?

The correlation coefficient is a statistical measure of the direction and strength of the linear relationsh
post-image
BTC-0.67%
ETH-1.26%
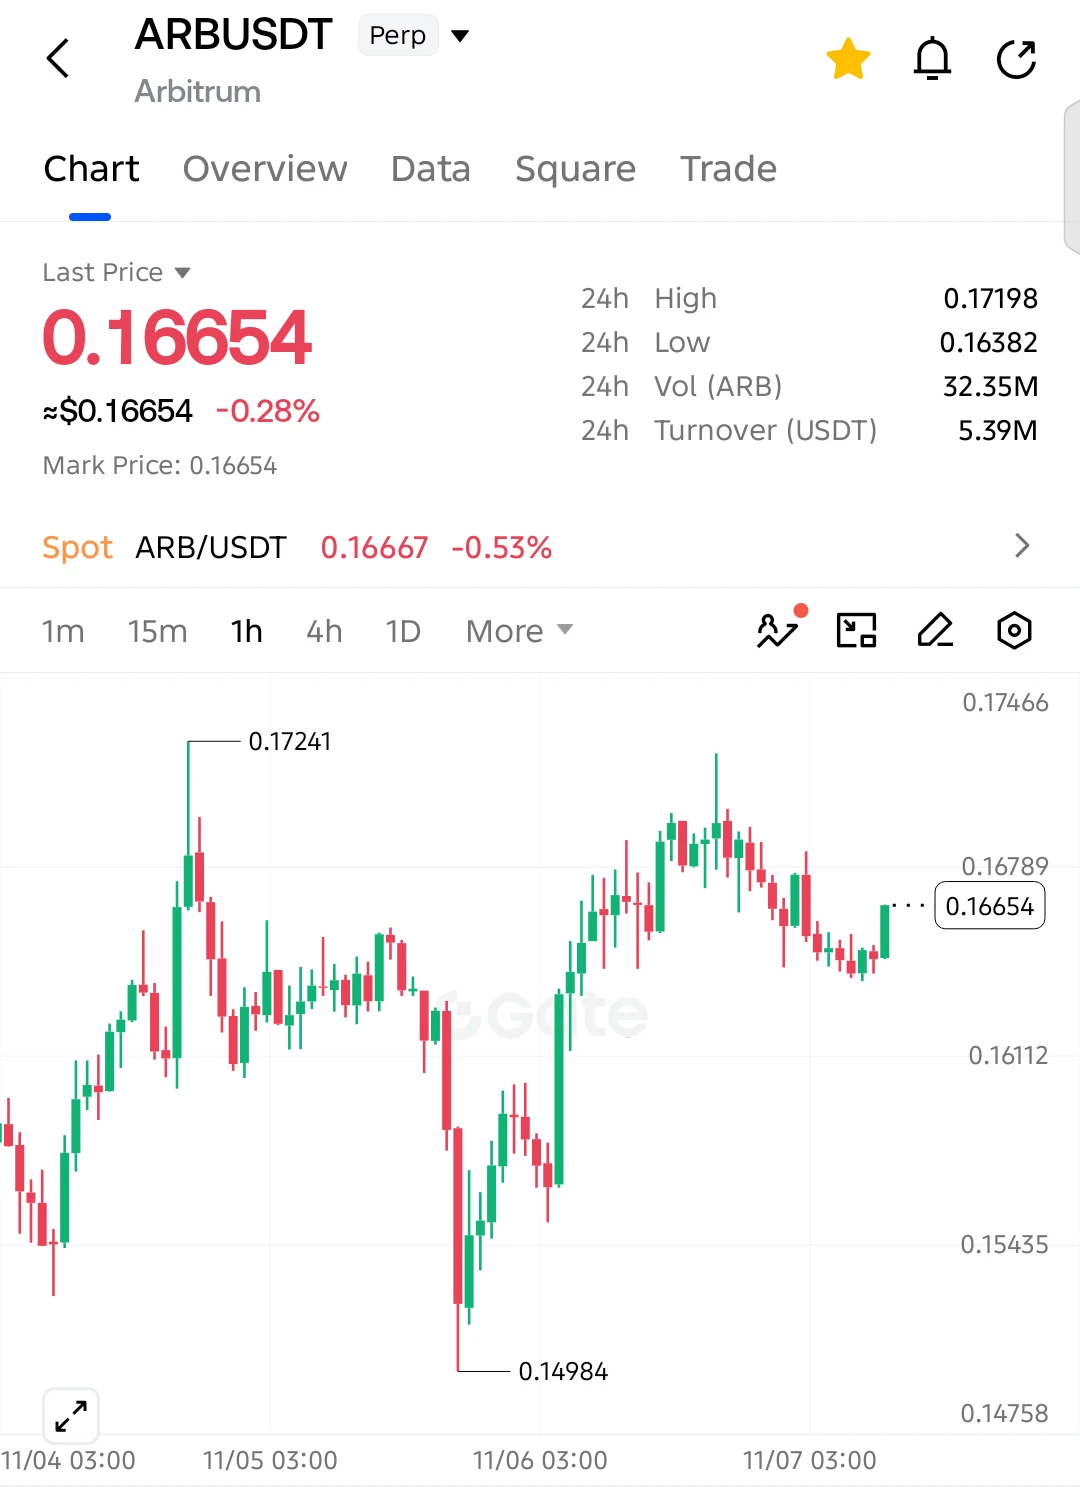
$ARB LONG SETUP — BULLS FIGHTING BACK!

$ARB is showing renewed buying pressure after defending key support, with a potential bullish continuation developing!

Entry: 0.16654
SL: 0.16350

TP1: 0.16880
TP2: 0.17050
TP3: 0.17198
Final Target: 0.17400

Buyers are stepping back in after the recent pullback, with price recovering above 0.1650. Holding 0.16382 keeps the bullish structure intact, while a breakout above 0.16789 could open the door toward 0.17241 and higher.

Invalidation: A sustained break below 0.16350 weakens the bullish setup.
post-image
ARB+1.17%
$UNI On-chain overbought sentiment is heating up! Large dip-buying orders are lying in wait and moving in. The pullback is in its final stage, and the “backing up to pick up passengers” is about to end!
post-image
UNI+3.05%
Never worked with sahil
post-image
Thanks, Musk, for the big payday. Now I can get back to dollar-cost averaging and buy some spot to add to my position 😉
post-image
Blue V already has 6K followers,
and we're just 470 away from surpassing 10K total followers.
Let's push a little harder
and aim to reach our goal within 3 days—
a month and a half ahead of schedule!
You got this🌺🌺🌺
post-image
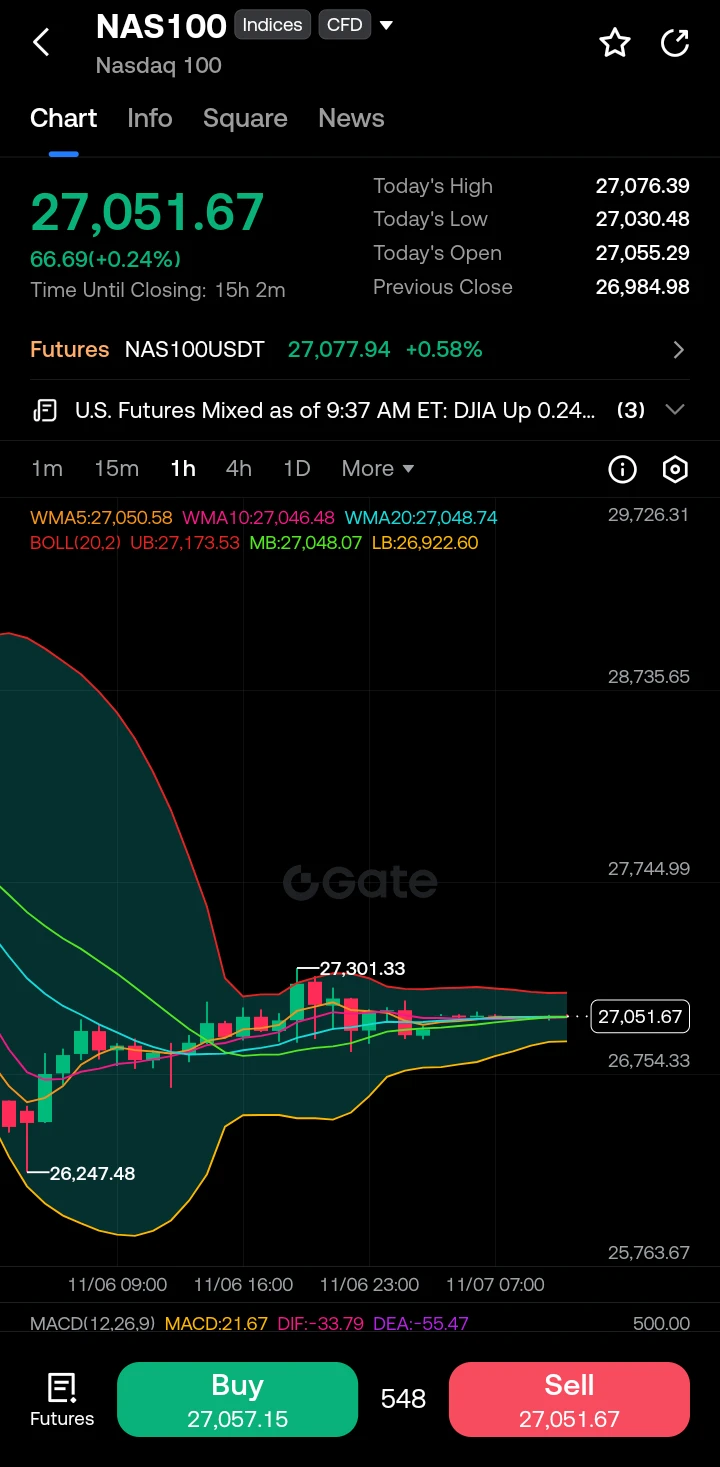
NAS100 1H Structure & Bias
$NAS100 ‌
Price sits at 27,051.67, tightly coiled at the confluence of WMA5 (27,050.58), WMA10 (27,046.48), WMA20 (27,048.74) and Bollinger middle band (27,048.07).

Upper band resistance sits at 27,173.53. Lower band support at 26,922.60. Local swing high marked at 27,301.33; prior swing low at 26,247.48.
MACD (12,26,9) shows histogram positive at +21.67 while DIF (-33.79) remains above DEA (-55.47).

Momentum has shifted from deep negative territory and is attempting to cross higher on the 1H.

Key Observations.

Price is mean-reverting after the rejection from 2
post-image
NAS100+1.90%
  • 4
ARIA | Long 🟢 | Bullish | 15-minute 24-hour: +12.83% | Volume: 35.5M USDT. Long rationale: Price above EMA200; EMA20/50/200 in bullish alignment; RSI14 at 67.8; MACD histogram positive; ADX14 at 21.8; volume is 1.44 times the 20-candle average; breakout from the 20-candle range. Entry: 0.15503 Stop-loss: 0.143574 Take-profit 1: 0.16935 | Take-profit 2: 0.177942 | Take-profit 3: 0.189399Entry price is for reference only; do not chase. The strategy is invalidated if the stop-loss level is hit. Technical analysis strategy only; not investment advice. $ARIA
post-image
ARIA+22.03%
The final rule allowing alternative investments such as crypto assets to be included in 401(k) retir
live-cover
LIVE1,876
$AKE The truth behind the surge: Major players are “taking out shorts to make an example of them”—chasing longs now is like catching a falling knife!

The pump isn’t an act of kindness; it’s meant to liquidate shorts. High volume doesn’t mean a bottom—it’s a trap for longs.

My view: The one-hour chart shows high volume and a long upper wick, alongside fund flows showing “long-term bleeding and a short-term pulse.” This rally is essentially a short squeeze, not a reversal. The whale long/short ratio is 88.2%; longs are sitting on +290k in unrealized profit, while shorts are stubbornly holding
AKE+6.39%
If you think there are decent KOLs in crypto, you’re absolutely wrong
And rekt
The “good guy” kol @MINHxDYNASTY told you to buy $zp zipcoin
“Life is a video game”
Oh and btw “I made you fomo into these plays so I can afford my dream car” 😂
It’s not just Ansem
It’s not just Minh
It’s every single one of them
0 integrity left in this space
In BTC trading, many traders have had this experience: the price suddenly breaks through an important resistance level, and they think an uptrend has finally begun, so they immediately enter by chasing the rally. Before long, the price quickly falls back into its previous range, or even triggers their stop-loss. This phenomenon is commonly known as a fake breakout.
So, how can you identify a fake breakout?
First, watch trading volume. A genuine breakout usually needs some volume to support it. If the price breaks through a key level but trading volume does not increase significantly, market pa
post-image
BTC-0.67%
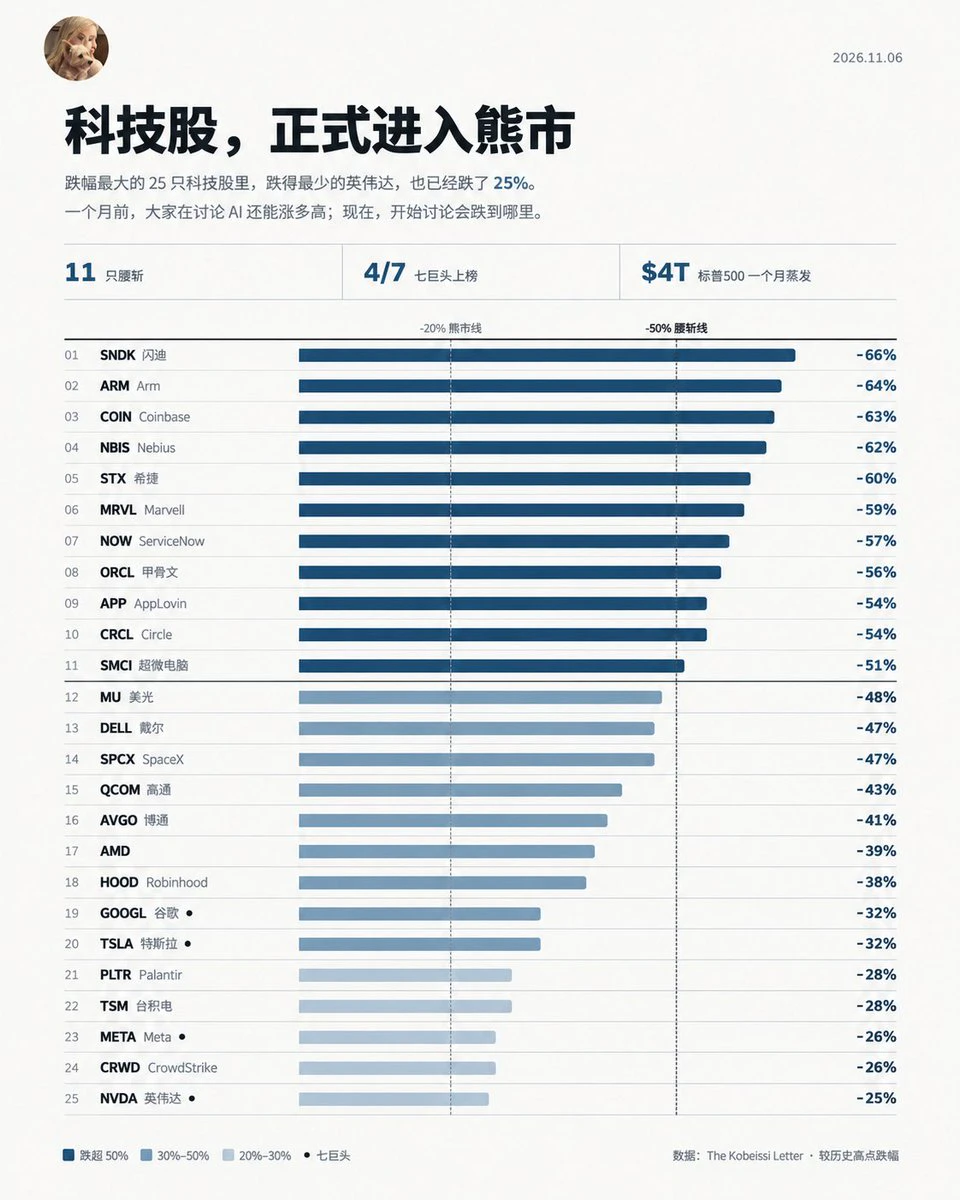
The only ones on this list I’d dare buy are
NVDA, META, GOOG, SPCX
All the other hardware companies are second-tier
If the market really gets dumped, they could fall all the way back to 2024 levels
post-image
NVDA+2.80%
GOOG+0.71%
SPCX+8.74%
$MITO is performing impressively, up as much as 18.82%! A strong breakout has pushed the price close to $0.0080. If buyers break through $0.00809, a new rally may be ahead! Entry: $0.00770 – $0.00785Target: $0.00810 / $0.00835 / $0.00860Stop-loss: $0.00735
post-image
MITO+8.51%
Load More

Join 40 M users in our growing community

⚡️ Join 40 M users in the crypto craze discussion

💬 Engage with your favorite top creators

👍 See what interests you

Trending Topics

USAIStocksHitHard

15.97k Views3.64k Discussing

U.S. stocks sold off sharply on Thursday, November 5 (UTC). The Nasdaq closed down around 5.5%, entering correction territory, while the Philadelphia Semiconductor Index plunged roughly 12%, with chip stocks including $NVDA and $AMD posting steep losses. Beyond profit-taking, investors are growing concerned about the pace of AI data center construction, capital spending, and future returns on investment. The key question now is whether the AI sector’s lofty growth expectations need to be repriced. Where do you think the next opportunities will emerge: chip stocks, tech giants, or other sectors?

USNonfarmPayrolls

23.64k Views4.25k Discussing

StakeOnLaunchpoolToShare450KVLX

2.62k Views773 Discussing

View More