Share your thoughts
placeholder
Article
Layout for Bitcoin, Ethereum, and Dogecoin
live-cover
LIVE3,124
  • 1
Back in May, I published a YouTube video explaining why I was setting limit orders and accumulating $ZEC around $305.
Since then, price has reached that level and gone on to rally more than 280%.
A good example of the importance of having a clear thesis, identifying key levels in advance, and remaining patient when the market presents the opportunity. #zecash
post-image
ZEC+15.63%
Everyone’s staring at the 1D range—but the 4h clock is ticking against DOGE.

$DOGE /USDT - SHORT

Trade Plan:
Entry: 0.09099 – 0.09159
SL: 0.09413
TP1: 0.08916
TP2: 0.08774
TP3: 0.08561

Why this setup?
Why now?
- 15m RSI (55.69) is fading, not thrusting—momentum is stalling before the kill zone.
- Short bias at 55% confidence is a “lean,” not a scream—but the entry (0.09129) sits right under 1h ATR resistance (0.001183).
- TP1 at 0.08916 is a 2.3% drop; TP3 at 0.08561 is a 6.2% slide if the range cracks.
- The trap? If 0.09159 breaks, the alt scenario flips to long—so this is a kn
DOGE+6.23%
#BTCReclaims80K
Bitcoin’s Growing Twin: Why the Gold Correlation Just Hit 0.50
Here’s a development worth paying attention to: the 90-day correlation between Bitcoin and gold has surged to +0.50.
It’s the highest level we’ve seen since the COVID-19 crash of 2020. To put that into perspective, this metric has more than doubled since the start of the year. Back in 2022, during a relatively stable post-crash recovery, that same correlation peaked at a modest +0.30.
So, what changed?
The primary catalyst appears to be a specific policy shift from the U.S. Treasury. On August 19, they announced pl
post-image
BTC+0.11%
  • 3
The privacy sector is really strong this time. That day, after catching a wave of zec, I casually chased dash.
I took a look today when I had some free time. Even zen, with its Christmas tree structure, is pumping.
All I can say is, the market is really full of fomo.
$ZEC $DASH #美国8月非农超预期
ZEC+15.55%
DASH+4.61%
  • 9
  • 2
I think BTC has more or less topped out this cycle, reaching as high as $86,000 before another deep correction.
post-image
BTC+0.11%
Gold shorts are sleeping at 4438—but the 4h tape says the trap door is already open.

$XAU /USDT - SHORT

Trade Plan:
Entry: 4437.73 – 4439.89
SL: 4449.16
TP1: 4431.05
TP2: 4425.87
TP3: 4418.10

Why this setup?
Why now?
- $XAU /USDT is stalling right at the 1h pivot (4438.81) with a 15m RSI of 58—weak bounce, not a breakout.
- 1D trend is range, so the path of least resistance is mean reversion to the downside.
- ATR (4.31) is tight—this coil snaps fast. First stop: TP1 at 4431, then TP2 at 4425.87 if sellers hold.
- Confirmation is weak (55.4), but the setup is a low-risk short wit
XAU-0.14%
#RedBullTradingTourSeason6 is creating a powerful wave of excitement, learning, competition, and opportunity for traders and trading enthusiasts around the world. This season is more than just another trading event—it represents a journey of discipline, strategy, knowledge, confidence, and the continuous pursuit of becoming a better trader.
Trading is often presented as a simple process of buying and selling, but anyone with real experience knows that successful trading requires much more. It requires patience when the market is uncertain, discipline when emotions become strong, confidence wi
post-image
Seriously, $UAI ’s move this time succeeded because of one word: “wait.”
During those days of sideways trading, people in popular coin groups posted limit-up gains every day, but I didn’t move. In Reminiscences of a Stock Operator, Livermore emphasized that you must wait for a breakout at a key point. Getting itchy during a narrow-range consolidation is just working for the platform.
When the line of least resistance turned upward, I opened a 50x long position on Gate’s UAIUSDT perpetual contract at 0.38561 and held it to 0.54677, directly producing a terrifying +2014.14% return on paper!
But
post-image
UAI+20.07%
BTC+0.13%
ETH+1.60%
These returns have me feeling deeply uneasy, afraid the market will come to its senses tomorrow and blacklist me.

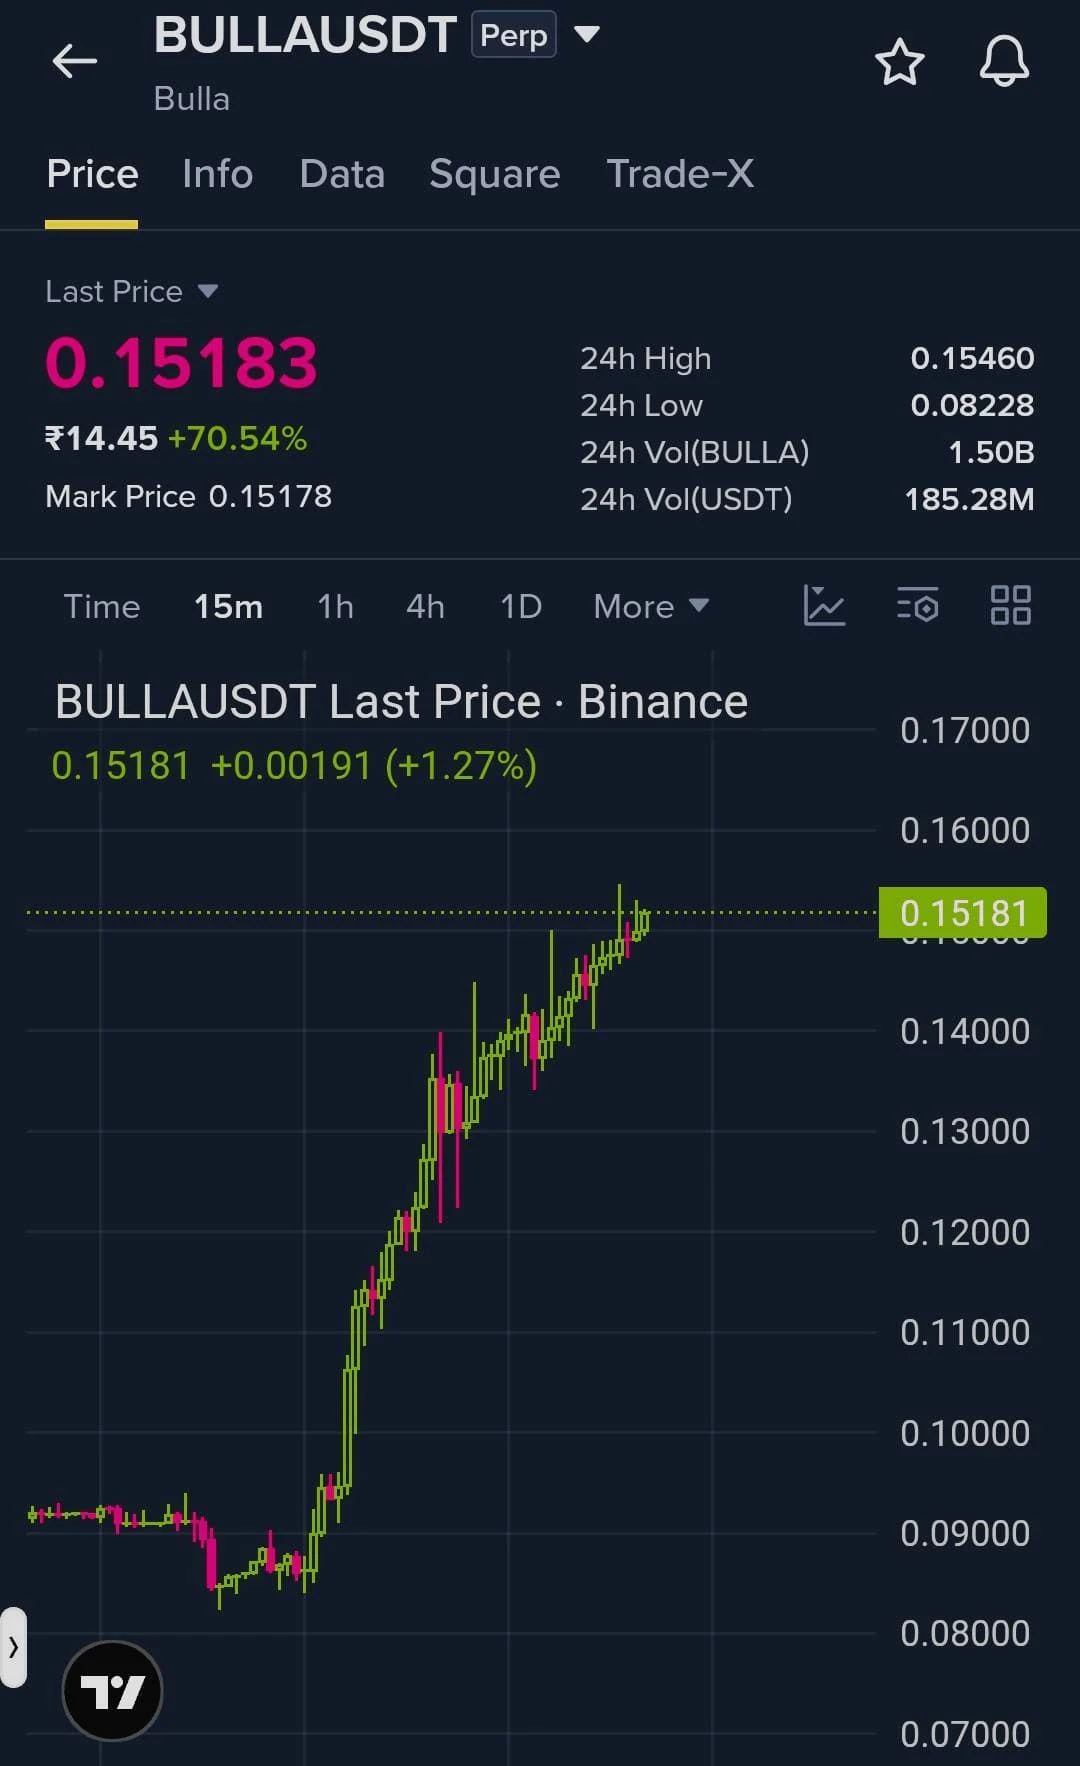
The last thing I saw before bed a few days ago was $BTR making a strong short-term surge, but the more I looked, the more hollow it felt. The rebound lacked volume, and it kept leaving long upper wicks at key levels. The overhead resistance was far too obvious. With the market giving such a clear bearish signal, not taking the trade would have been rude.

I entered a short directly at 0.17647.

While everyone was still watching from the sidelines, the market had already started
post-image
BTR-6.85%
BTC+0.13%
SNDK+1.39%
GM ILOVE PUPPIES🐶🐶🐶#美国8月非农超预期
post-image
  • 6
Robinhood utility coin named DOXA is up over 100% last 10 min following large whale buying
You aren't bullish enough
Doxa will go higher
Market prediction
live-cover
LIVE1,740
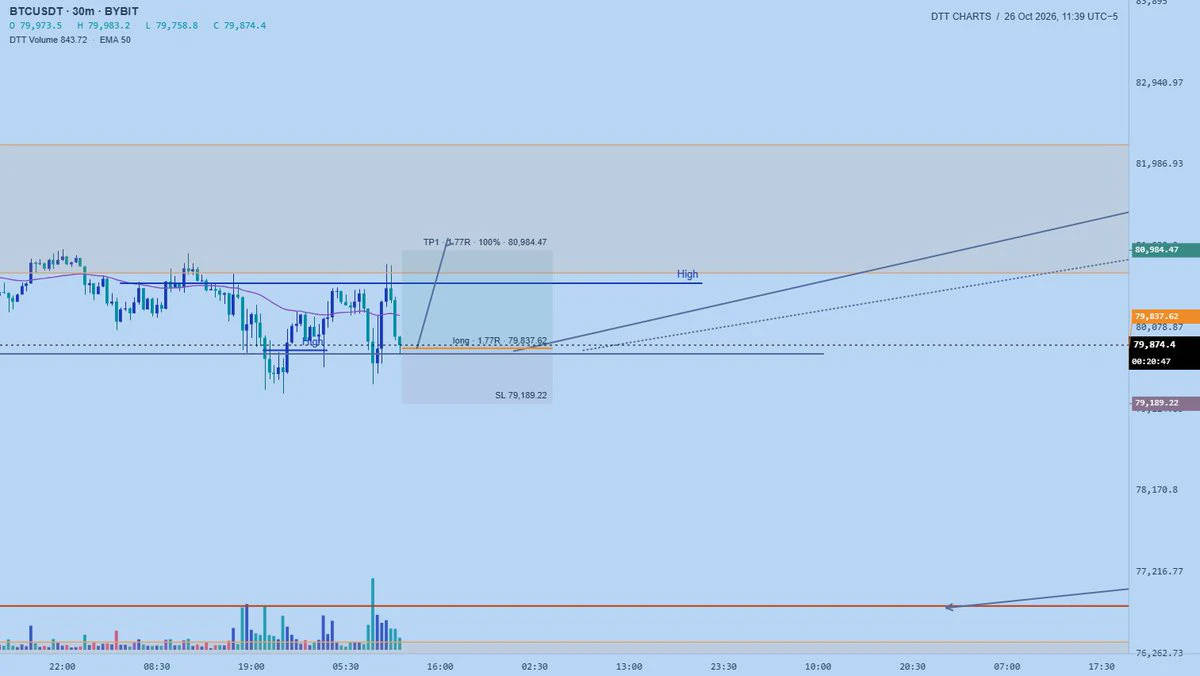
$BTC Signal】1H bullish momentum continues + low-funding-rate short-squeeze opportunity
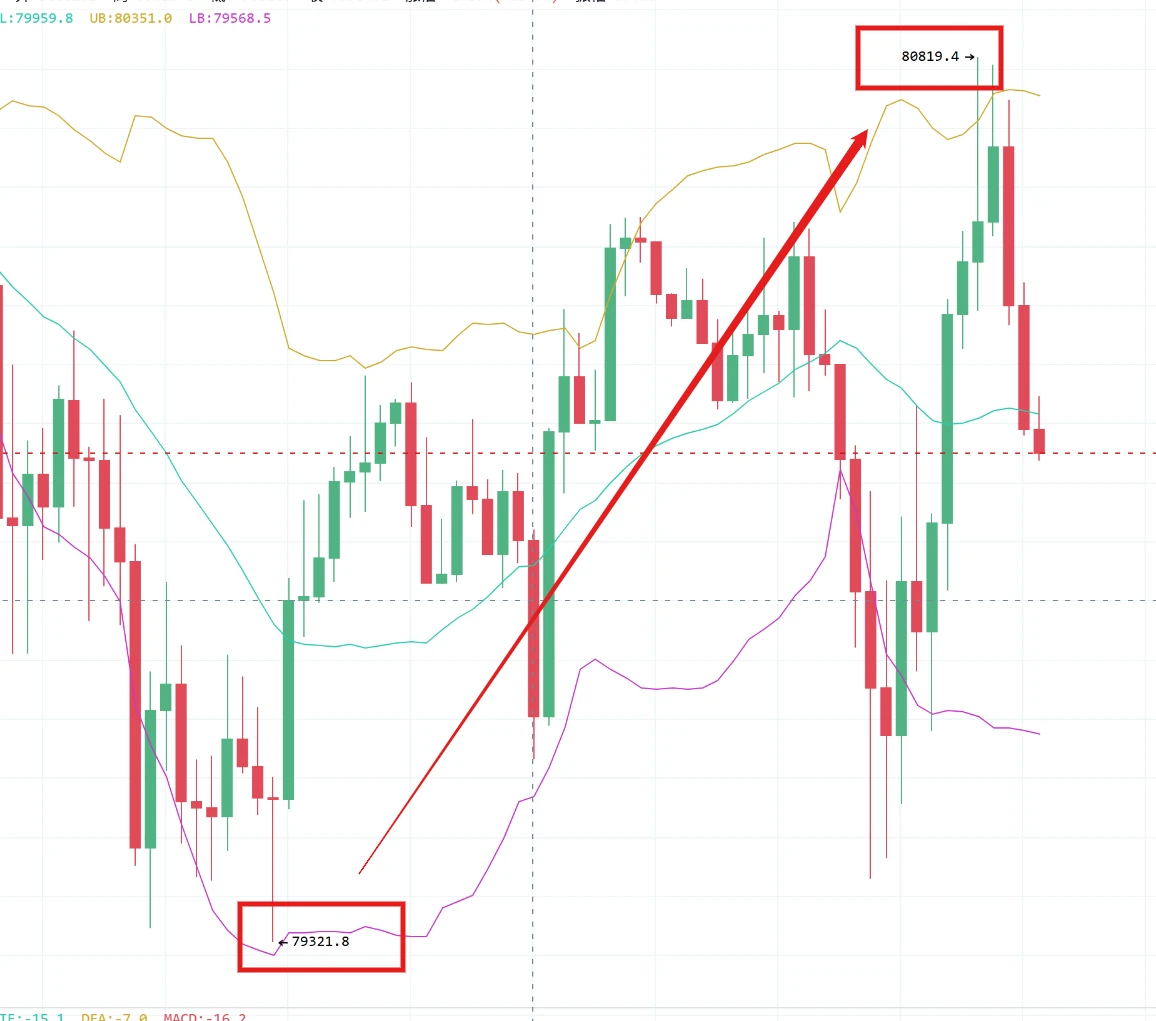
$BTC 1H volume and price are rising together, with the current price near 79956. The MACD histogram continues to expand, with 1H bullish momentum prevailing. The 4H bearish MACD histogram is narrowing, easing pressure from the larger timeframe. Order book depth imbalance is -81%, with sell orders piling up, indicating real short-term selling pressure. The funding rate is low at 0.0041%, with limited leverage pressure. The price is holding above EMA20, clearly defining the bull-bear dividing line.
🎯Directio
post-image
BTC+0.13%
ETH+1.56%
SOL+2.73%
ETH’s current two phases, short and long, $ETH
have both been completed. Take profits where appropriate and exit where necessary. Making money requires gradual accumulation; you can’t be greedy at all🎉🎉
Impatience, high-frequency trading, and blindly ➕➖ positions are not sustainable🥳🥳🥳🥳.
Nice隔壁王叔
$ETH subscription post order, check promptly 🚨🚨🚨🚨 (contract plan)
ETH+1.60%
  • 12
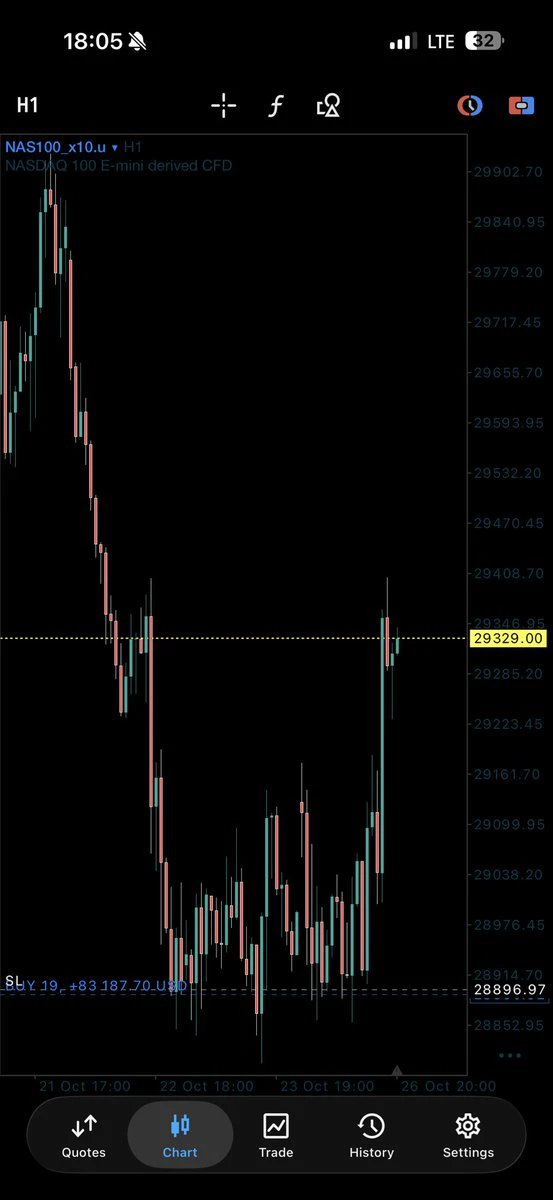
$NAS100 After Weathering Countless Storms, the Nasdaq-100 Index Climbs Back Above 29544
    On September 4, 2026, the Nasdaq-100 Index edged up 0.21% to close at 29544 points.     
Over the three trading days at the start of September, it edged up 0.3%. Scattered gains hardly make a feast, but they are like a ray of warm autumn afternoon sunshine—not blazing, but reassuring.      
In August, the Nasdaq rose 4.18% for the month, laying the groundwork for the autumn rally. Year to date, the index has risen 17.01%.   
 Looking back at July, the road was far from smooth.   
At the time, earning
NAS100+0.06%
  • 3
$IOST Signal】4H bullish continuation + 1H low-volume pullback
$IOST RSI 90.27, after a short-term spike to 0.0008125, it fell back to 0.0007782. The 4H MACD histogram is expanding, while the 1H MACD histogram is narrowing. Depth imbalance: -39.21%, with sell-side depth dominant. The price has consistently held above 0.00075. Funding rate is 0.01%, OI is flat, and no long positions have been seen exiting.
🎯Direction: long
⚡Entry/Limit Order: 0.000777033 - 0.000778200
🛑Stop-loss: 0.000770418
🚀Target 1: 0.000789873
🚀Target 2: 0.000795710
🛡️Trade Management:
- At Target 1, reduce the positio
post-image
IOST+24.22%
BTC+0.11%
ETH+1.56%
SOL+2.73%
$FLOCK Signal】Long: Buy-depth imbalance + 4H MACD expansion
$FLOCK Buy-depth imbalance at 10.27%, Bid/Ask 1.23, 4H MACD red bars expanding, current price 0.07176 near the upper Bollinger Band at 0.0727. 1H RSI 71, funding rate 0.005%, longs are not overheated.
🎯Direction: long
⚡Entry/Limit order: 0.0715447 - 0.0717600 (enter directly in the current price area)
🛑Stop-loss: 0.0710424
🚀Target 1: 0.0728364
🚀Target 2: 0.0733746
🛡️Trade management:
- Execution strategy: Reduce the position by 50% after reaching Target 1, and move the stop-loss up to breakeven. If the price falls back to the en
post-image
FLOCK+43.43%
Everyone’s chasing $MU /USDT longs at 1025—but the 15m RSI is screaming 85.7. Who’s really late here?

$MU /USDT - SHORT

Trade Plan:
Entry: 1024.05 – 1025.51
SL: 1033.89
TP1: 1017.94
TP2: 1013.39
TP3: 1006.55

Why this setup?
- 1D trend is **range**, not breakout—so this push up is a liquidity grab, not a trend shift.
- 15m RSI at **85.73** = overheated; mean reversion is the statistical edge right now.
- 4h bias is SHORT with 77% confidence; entry zone 1024.05–1025.51 is the exact resistance pocket.
- Why now? ATR (1h) is 2.92—tight stops are vulnerable; the first drop to TP1 (1017.
MU+1.23%
This $ZEC long has been going quite smoothly, with the price pushing higher all the way and getting closer and closer to my initial target. Instead of closing everything at once, I first took partial profits as planned, reducing the position to a size I can comfortably hold. I placed protective levels for the remaining orders and will let the market play out.
+2938.8% unrealized profit is in hand, and it would be a lie to say I feel no emotional fluctuations. But I know where the core logic of this trade lies. As long as that level is not breached on a closing basis, I do not plan to interfere
post-image
ZEC+15.55%
SNDK+1.39%
LAB-3.77%
Load More

Join 40 M users in our growing community

⚡️ Join 40 M users in the crypto craze discussion

💬 Engage with your favorite top creators

👍 See what interests you

View More