Square
Following
Hot
News
Notifications
Profile
Share your thoughts
placeholder
Article
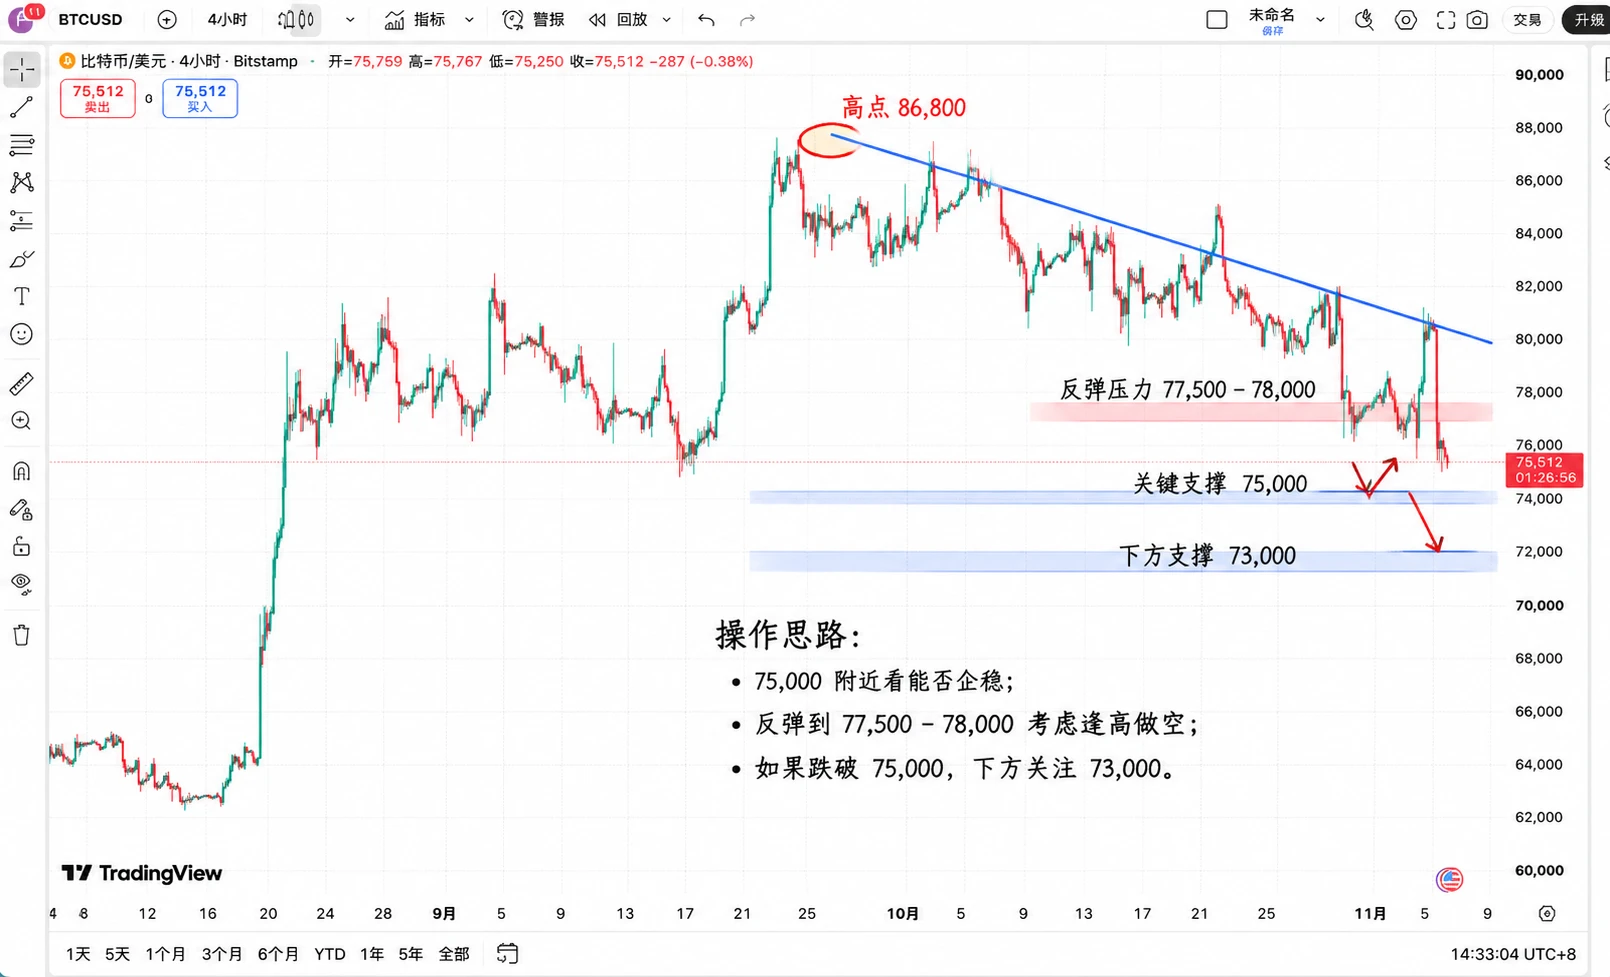
$BTC Yesterday it was still pushing toward $81k; today it got dumped straight back to $75k! Anyone who chased longs was probably blindsided by this move again.

On November 6, BTC fell to a low of $75,158, down more than 6% in 24 hours, with futures trading volume exceeding $21.3 billion.

Even more exciting, U.S. October nonfarm payrolls are due at 21:30 tonight, with the market expecting around 65k new jobs.

First, my take: the short-term outlook remains bearish, and there’s no need to rush into buying the dip.

This drop isn’t just about ugly price action. Four-hour futures open interest a
post-image
BTC-0.65%
  • 3
Second-round screenshots from Dabao's livestream room
  • 1
Trenches
ZIG
Z
bade
b
ZIG
0x8c...1145
Market Cap
$.
Change
.
24h Vol
$.
Holders
.
BTC
B
bade
b
BTC
C5xp...pump
Market Cap
$.
Change
.
24h Vol
$.
Holders
.
STONK
S
bade
b
STONK
6GmA...UNgx
Market Cap
$.
Change
.
24h Vol
$.
Holders
.
DESSA
D
bade
b
DESSA
npz2...pump
Market Cap
$.
Change
.
24h Vol
$.
Holders
Diamond
D
bade
b
Diamond
5VCE...pump
Market Cap
$.
Change
.
24h Vol
$.
Holders
.
📡 Signal Card | Reposted from KOL “Bitcoin Fengge”
Asset: $ETH Long entry: 2435 Stop loss: 2360 Targets: 2520 / 2560 Time: Not specified
I’m only reposting this as-is. Fengge is responsible for backing the signal’s authenticity. Whether to follow it and how much to put in are up to you, folks—don’t go all-in with your life savings 🫠
I reposted one of Fengge’s $ETH trades earlier today, and now here’s another. This is happening more often than I change my profile picture.
Shared as a personal record; not investment advice. #SpaceX partners with Qualcomm to build a 5G network in the US
ETH-1.26%
SPCX-9.15%
QCOM-9.69%
11/06 Daytime Level Update: Follow for Ongoing Precise Level Updates
BTC / ETH / SOL / Gold / U.S. Stocks
Overall strategy: After consecutive sharp sell-offs, the market is getting closer to the bottom zone I'm watching, but this correction isn't over yet.
Tonight, focus on guarding against a final sharp drop triggered by news; over the weekend, I expect a choppy bottoming process
At this stage of this U.S. stock decline, focus on accumulating spot in batches with low leverage. Do not take heavy positions.
Don't try to guess the bottom; wait for the final wave of panic to play out. Don't fall
post-image
BTC-0.67%
ETH-1.26%
SOL-0.77%
SNDK-22.24%
ETH is currently showing a multi-timeframe confluence of pressure and a downward structure:
On the daily timeframe, the previous rebound structure has come to an end, with price retreating under pressure and closing with a large bearish candle, breaking below the short-term support platform. Bullish rebound momentum has faded, and the trend has shifted into a corrective phase;
On the 4-hour timeframe, candlesticks have repeatedly broken down, the Bollinger Bands are opening downward, bearish momentum is being released in force, and the market's center of gravity continues to move lower, with f
ETH-1.26%
11.06 Qiqi Lun Jin Midday Review: Gold continued to weaken and probe lower intraday, with bears holding the upper hand ahead of Nonfarm!

Gold prices maintained a weak pace intraday, fluctuating lower all the way and hitting a low of 4035.86, with the current price hovering near the lows around 4047. The market priced in bearish expectations early, as funds took profits ahead of the Nonfarm release, putting clear pressure on prices.

Short-term moving averages continued to cap prices, while bearish momentum on the MACD expanded somewhat. Overall, the market remained in a weak consolidation pat
post-image
XAU+0.38%
  • 1
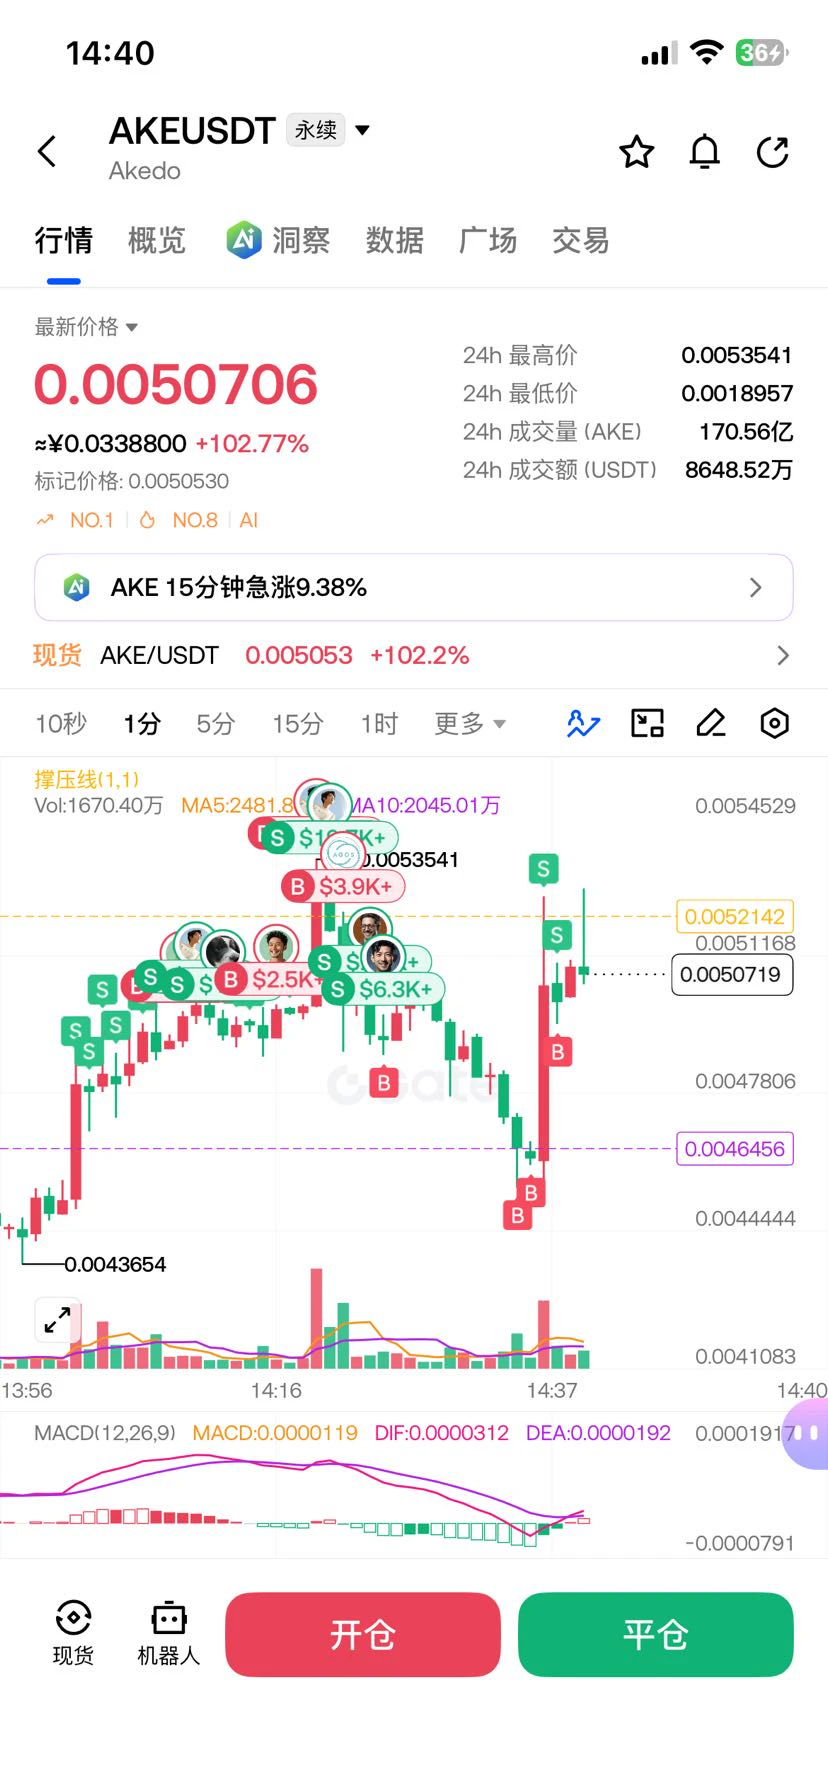
$AKE These are the real profit-makers...
post-image
AKE+6.07%
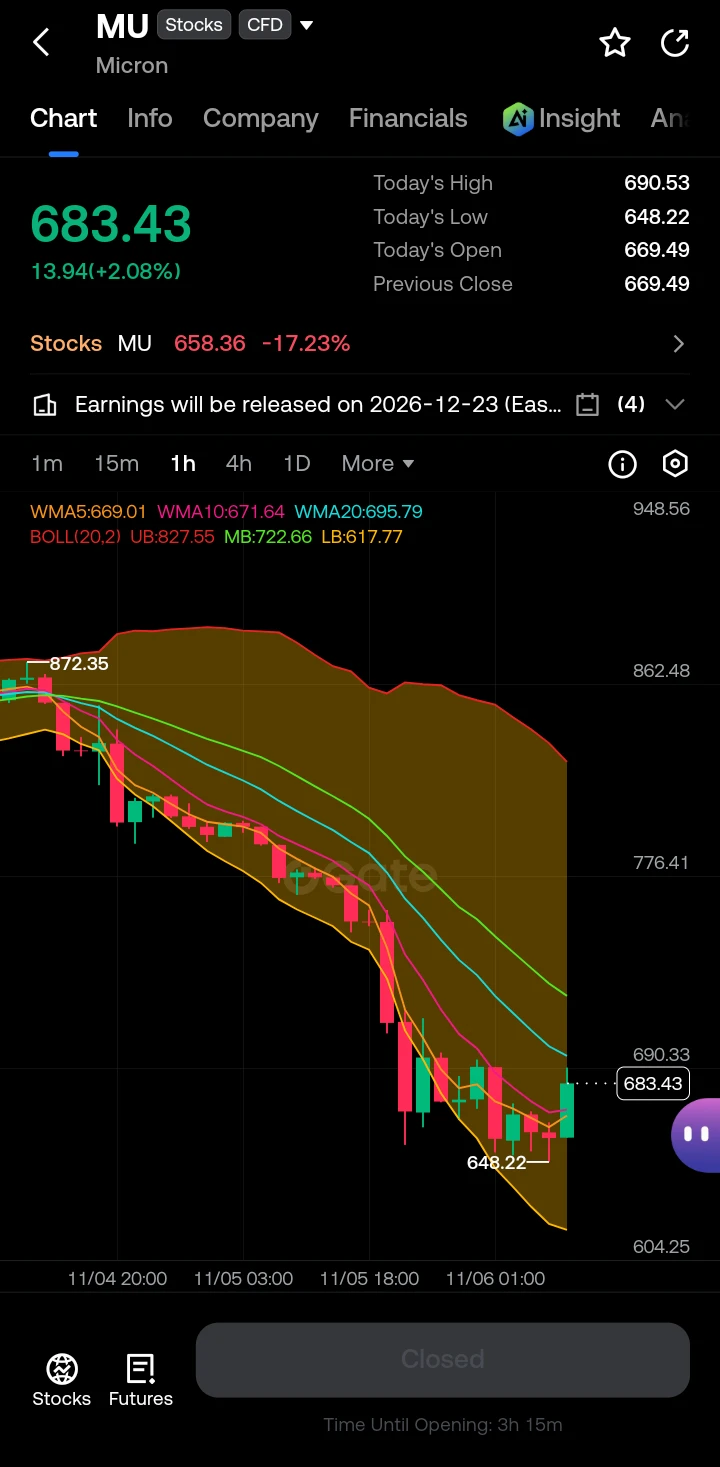
$MU ‌

Technical Breakdown: Analyzing Micron’s (MU) Sharp Correction

The chart for Micron Technology (MU) currently displays a textbook example of a powerful downtrend and subsequent consolidation. For technical traders, this price action offers several clear signals regarding market momentum and potential support levels.

Let’s break down the current chart structure, examining the moving averages, Bollinger Bands, and recent candlestick formations.

1. The Initial Breakdown and Downtrend

The most prominent feature of this chart is the steep, multi-day decline originating from the highs nea
post-image
MU-17.23%
  • 10
  • 1
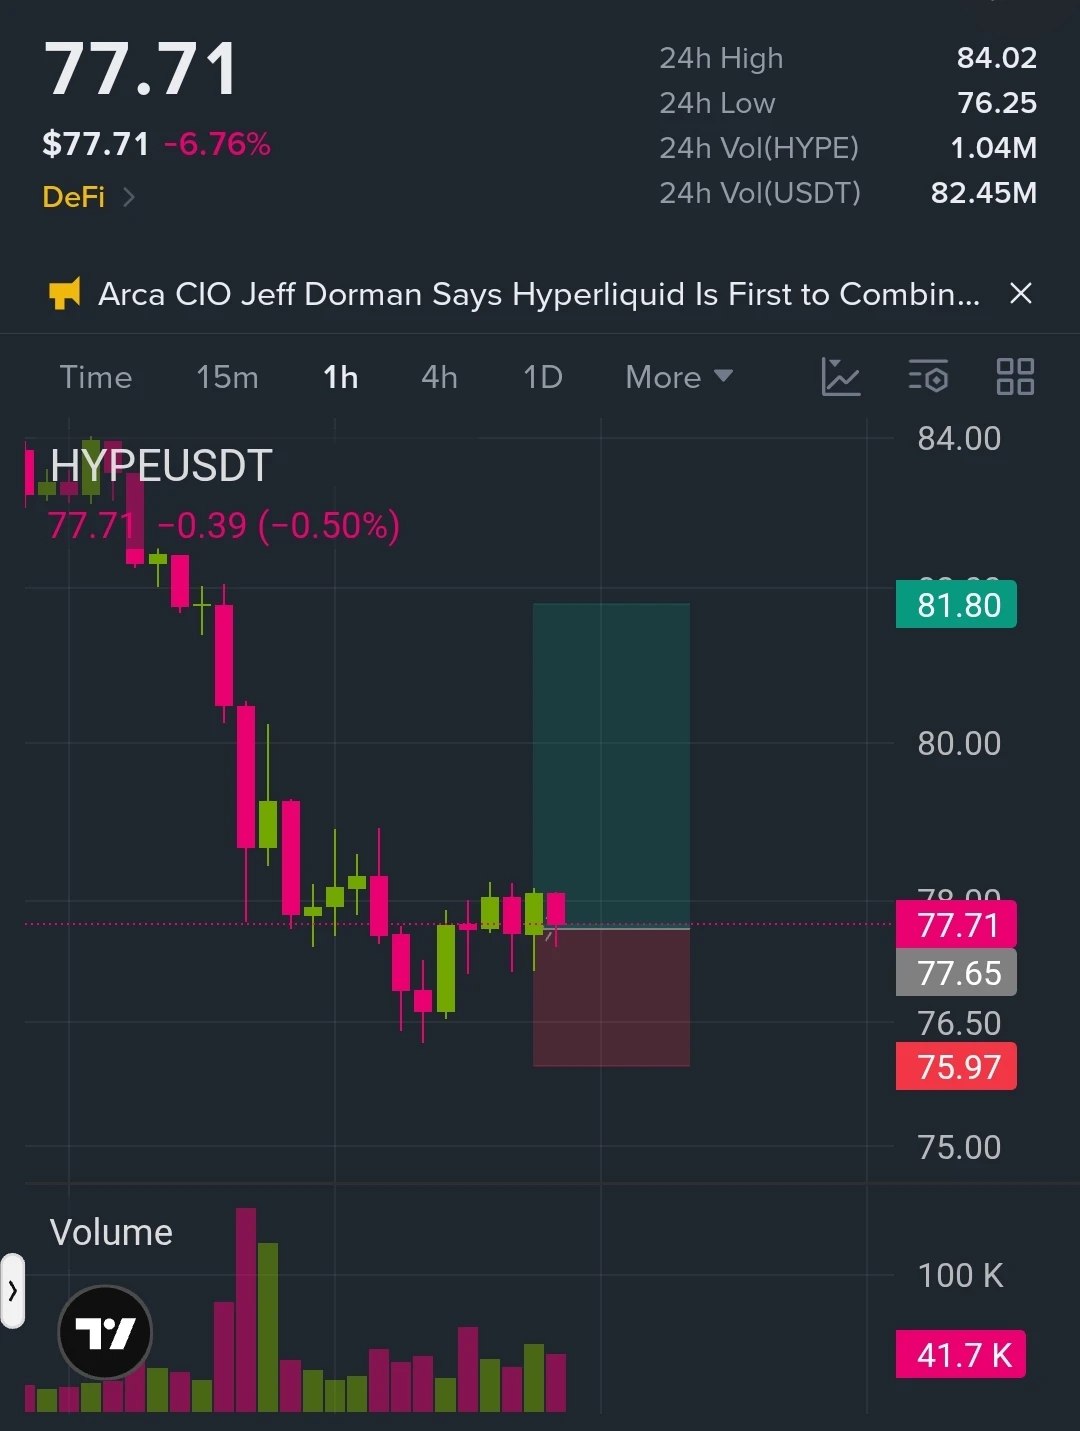
I'm watching a potential BIG LONG on $HYPE ‌
TP: $79.00 / $80.00 / $81.80

SL: $75.97

You know what caught my attention?

After a sharp decline from $84, HYPE found buyers around $76.50 and started stabilizing. Sellers pushed price lower, but the recent candles are showing signs of consolidation rather than uninterrupted selling $HYPE

The market may be building a short-term base. If buyers reclaim $78.50–$79.00, trapped short positions could provide additional fuel for a recovery toward $80 and $81.80.

The important level is $76.50.

If buyers defend this support, the next liquidity targe
post-image
HYPE+0.24%
📣 Daily Standouts | Share a post worth discovering

What have you written lately that deserves a closer look? 🔎

Market views backed by reasoning, honest trade reviews and useful explainers—we’d love to see them.

💬 Drop a Gate Square post link + one reason to read it
Nominate your own work or recommend another creator. Found an interesting perspective? Visit the original post and join the conversation.

🕒 We’ll scout the replies for this afternoon’s picks
🎁 Selected creators get a 3-day traffic boost + featured placement

Your next post could be featured 👇

‍#DailyStandouts #GateSquare
post-image
  • 9
  • 3
I had a short position that was doing great, but I didn’t hold it longer and closed at 0.27. Watching it crash, I thought it would rebound based on the previous market move, but it just kept dropping like it was dead, stopping out several of my long positions in a row. I lost $5,000
  • 1
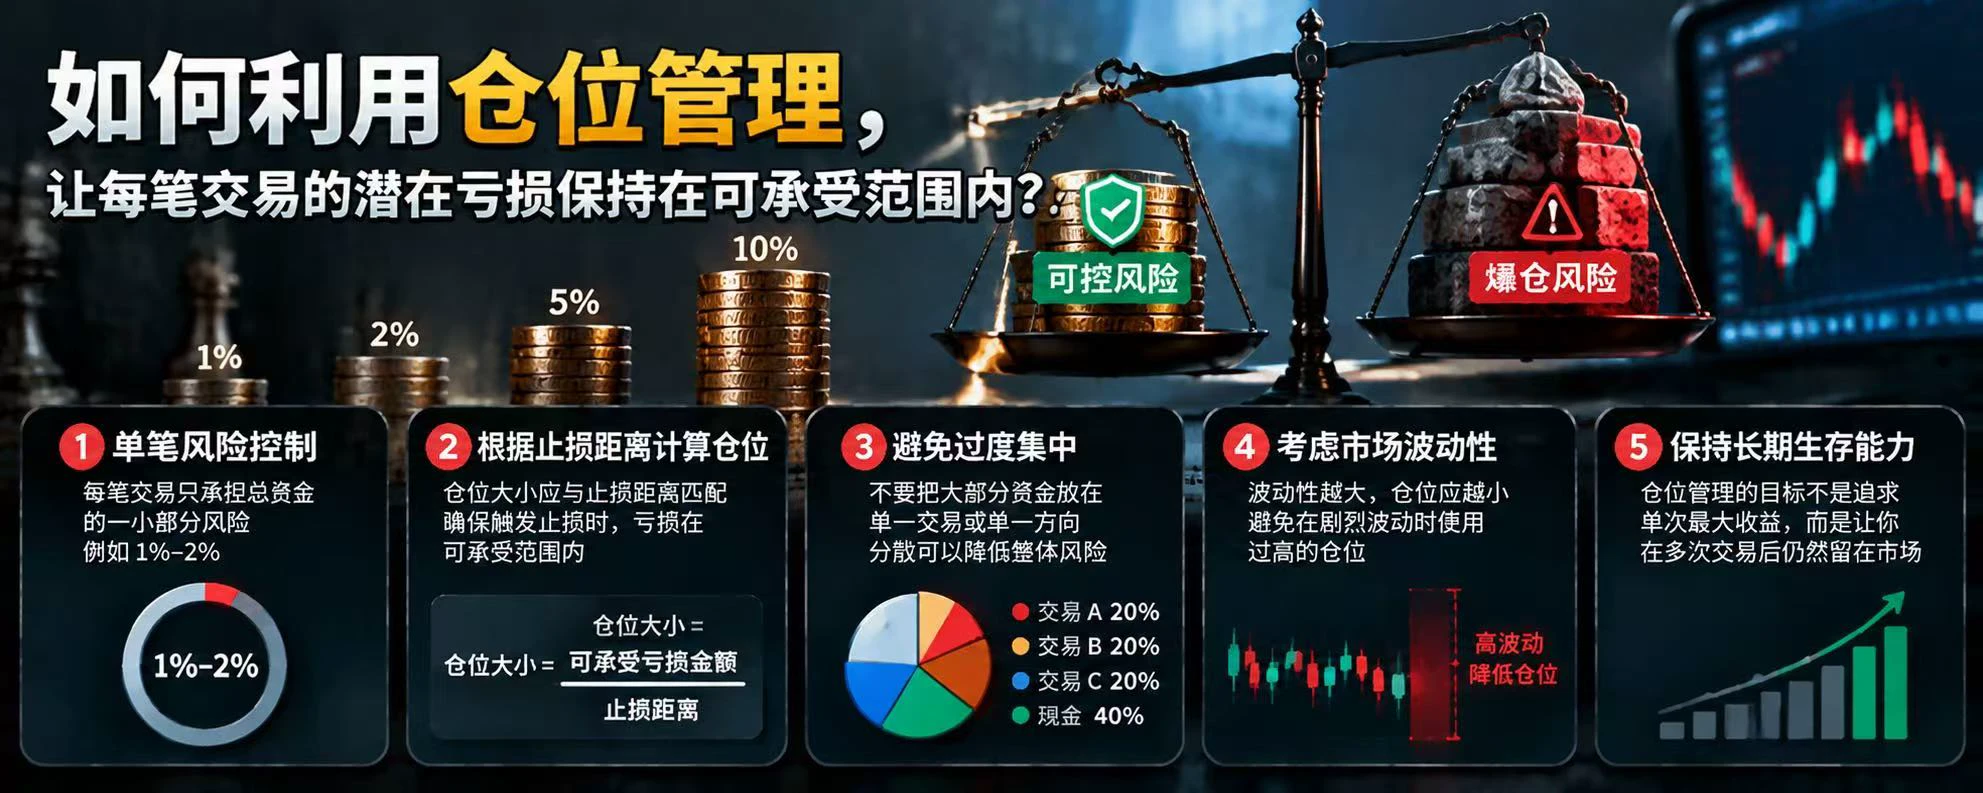
What Is Maximum Drawdown? Why Can a Profitable Long-Term Trading Strategy Still Experience Unbearable Consecutive Losses?

In cryptocurrency trading, some strategies may be profitable over the long term but experience significant losses along the way. If traders do not assess in advance how far their account could fall, they may be forced to exit before the strategy has a chance to recover. Maximum drawdown is an important metric for measuring this risk.

First, what is maximum drawdown?

Maximum drawdown (MDD) is the largest percentage decline in an account’s net asset value from a previous p
post-image
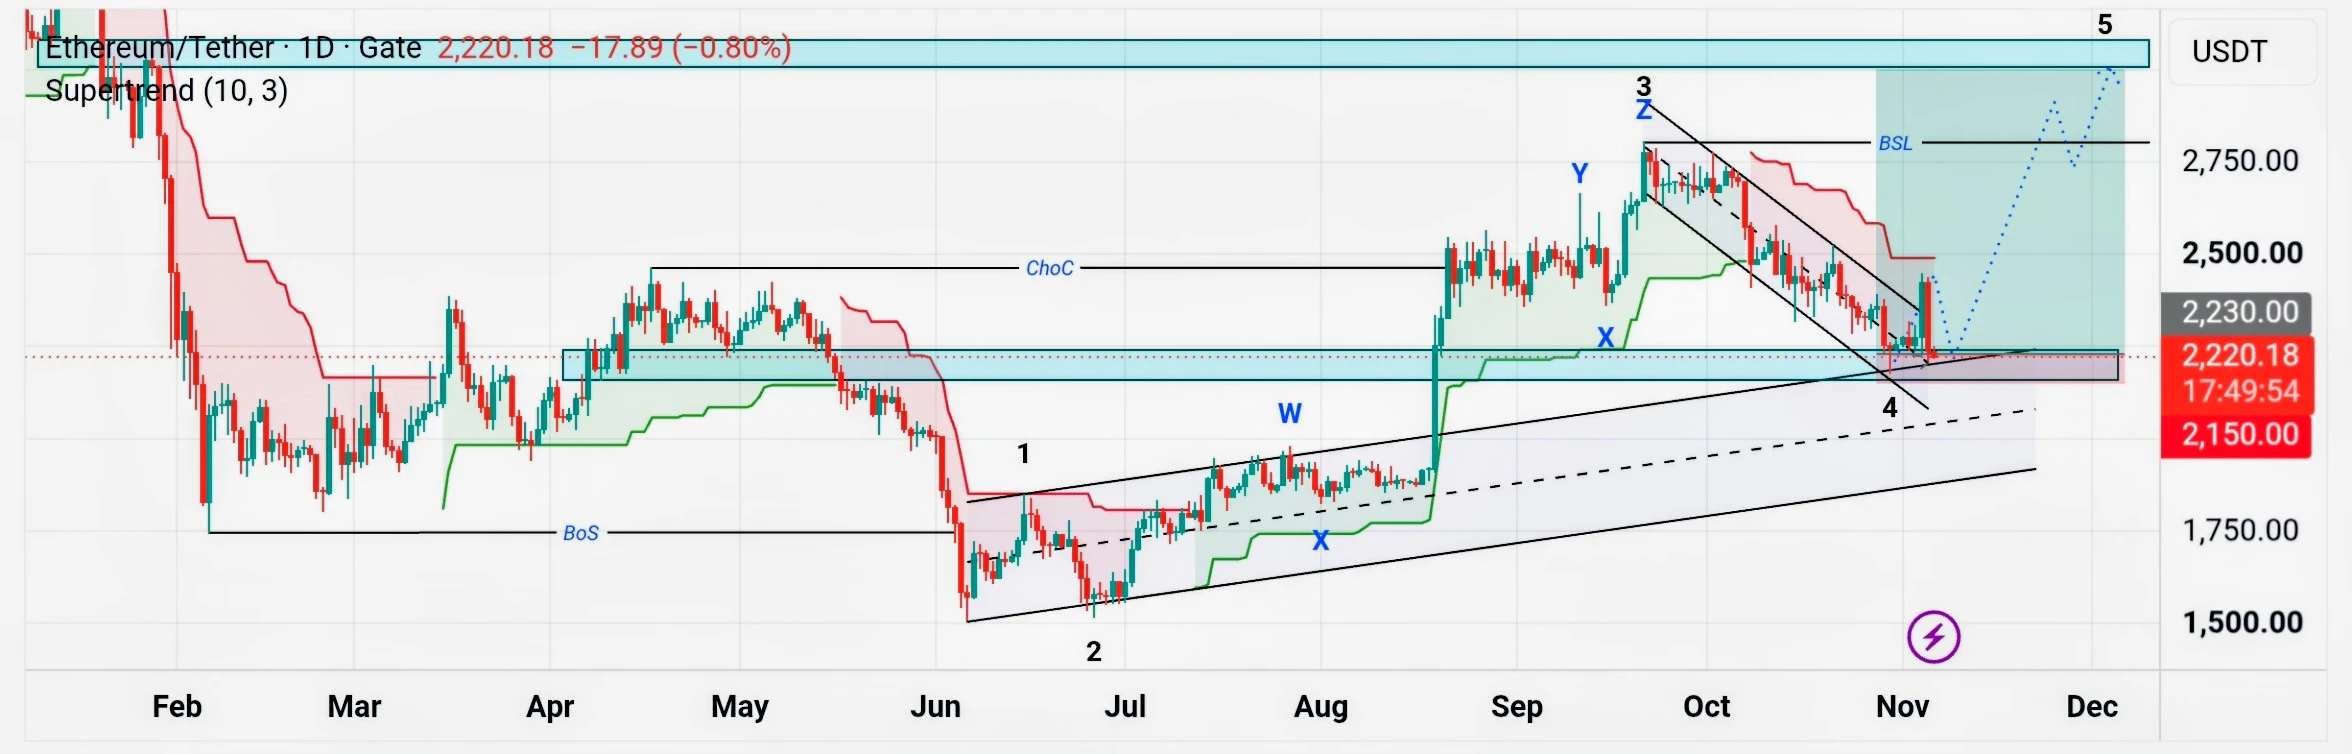
$ETH ‌-After the price broke out of the wave 4 channel shown in the chart, it immediately reversed back inside. Interpreting the price action this way, it could potentially be the formation of a micro wave 2, setting up for a bullish wave 5.
-Those with a bearish outlook might view this as a "false break."
-Therefore, using the most recent low (wave 4) as an invalidation level is a prudent risk management step for any long positions.
post-image
ETH-1.26%
Friends have the funds ready, but can’t find anyone to exchange for U. U merchants are doing insanely well…
What’s going on? U.S. stocks have crashed, Bitcoin is going to zero, the Qing dynasty is about to fall—why isn’t anyone running?? 🤣🤣
post-image
BTC-0.67%
[ NEW STREAMER ] MARKET POSITION
live-cover
LIVE1,913
$UAI The coin I bought the dip on has taken off again, making 490% in no time. Can you pump it to $1 so I can achieve financial freedom? 😎
post-image
UAI-7.58%
#Gate安全卫士
Security is one of the most important foundations of the cryptocurrency industry. As digital assets continue to attract millions of users worldwide, protecting accounts, funds, and personal information has become more important than ever. Gate is taking another step toward creating a safer trading environment through Gate Guard, its free security protection service designed to help users strengthen their account safety and manage potential risks.

In the crypto market, security is not something that should only matter after an incident happens. It requires continuous attention, stro
  • 3
U.S. Crypto Regulation Advances on Two Fronts
live-cover
LIVE2,023
Load More

Join 40 M users in our growing community

⚡️ Join 40 M users in the crypto craze discussion

💬 Engage with your favorite top creators

👍 See what interests you

Trending Topics

USStocksFaceHistoricSelloff

2.23k Views3.59k Discussing

U.S. stocks suffered a sharp selloff on Thursday, with the Nasdaq closing down more than 5% and the Philadelphia Semiconductor Index falling over 12%. AI and chip stocks including $NVDA and $AMD were hit especially hard. Markets are reassessing AI valuations, data-center spending and future returns. Is this just short-term deleveraging, or the start of a deeper correction in the AI trade? Which sectors are you watching next?

GateLaunchesPoSECProofOfSecurity

13.06k Views580 Discussing

USNonfarmPayrolls

11.25k Views4.03k Discussing

View More