




Share your thoughts
placeholder
Article
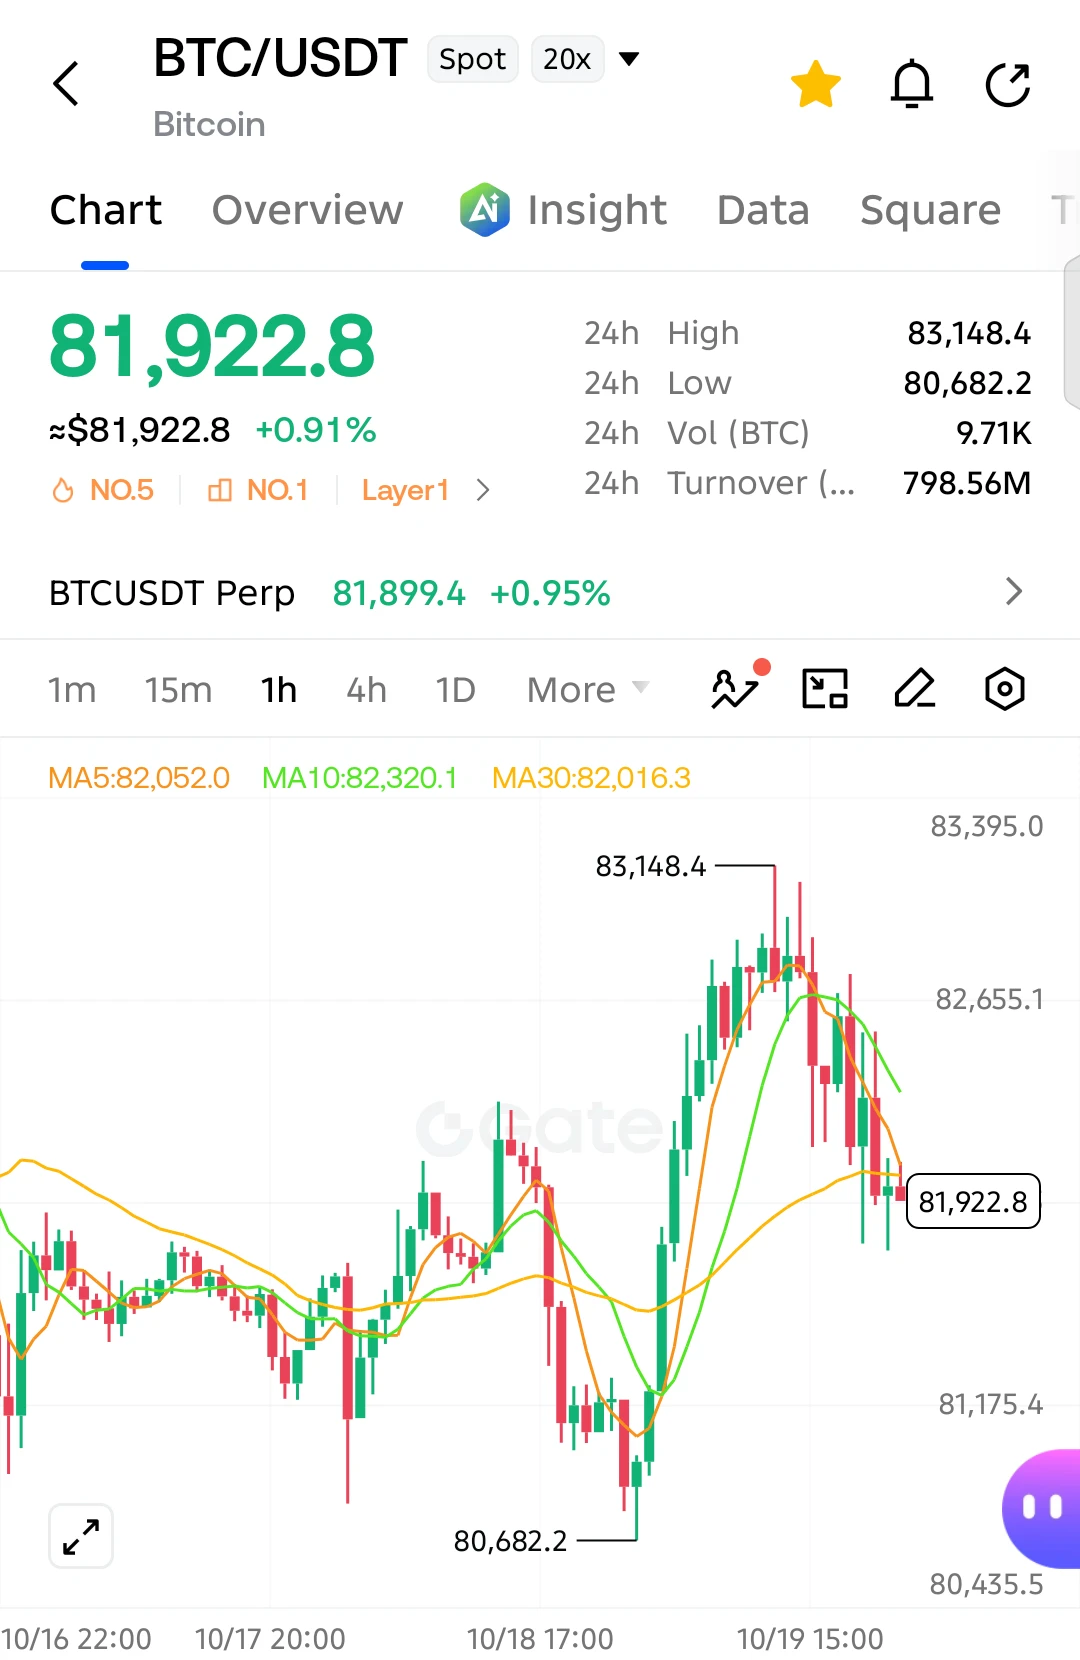
$BTC Signal】Short + 4H moving average resistance/order book selling pressure
$BTC The 4H price is below EMA20 and EMA50, while selling pressure above the 76855 Bollinger middle band remains unresolved. The 1H MACD histogram is expanding, with bulls pushing prices higher in the short term, but follow-through near the 76663 upper band is weakening. Order book depth is -8.49%, Bid/Ask is 0.84, and sell orders are stacked more densely. The funding rate is 0.0032%, OI is stable, and shorting is not overcrowded. Place short orders around the current price zone, with a risk/reward ratio of 1.50. The
post-image
BTC+1.15%
CRYPTO TODAY TREND
live-cover
LIVE1,627
#Arc生态热门代币波动加剧 +#Gate广场中秋团圆局
🚀 ARC HAS ENTERED THE MARKET — NOW THE REAL TEST BEGINS
Circle Arc officially live on Sep 16, and the first 24 hours have already delivered exactly what we often see when a new blockchain ecosystem opens its doors: enormous attention, explosive trading activity, rapid price discovery, and equally aggressive corrections.
But Arc deserves to be viewed through a wider lens.
This is not simply another chain launching another group of speculative tokens. Arc has been designed specifically around financial infrastructure, with USDC as its native gas asset, EVM compatib
CryptoChampion
#Arc生态热门代币波动加剧 +#Gate广场中秋团圆局
🚀 ARC HAS ENTERED THE MARKET — NOW THE REAL TEST BEGINS
Circle Arc officially live on Sep 16, and the first 24 hours have already delivered exactly what we often see when a new blockchain ecosystem opens its doors: enormous attention, explosive trading activity, rapid price discovery, and equally aggressive corrections.
But Arc deserves to be viewed through a wider lens.
This is not simply another chain launching another group of speculative tokens. Arc has been designed specifically around financial infrastructure, with USDC as its native gas asset, EVM compatibility, targeted sub-second deterministic finality, and a focus on payments, trading, DeFi, FX and tokenized real-world assets.
Circle has also said that more than 100 applications and ecosystem builders were involved around the launch.
That gives Arc a much broader foundation than the first-day token charts might suggest.
🔥 THE FIRST WAVE HAS BEEN EXTREME
The early market has already produced some spectacular moves.
Based on the September 17 market figures being discussed, ARGUS fell more than 40% over 12 hours, LONG declined more than 70%, and COOL dropped more than 75%.
Those percentages are not just numbers on a chart.
A 40% loss requires approximately a 66.7% gain to recover.
A 70% loss requires approximately 233.3%.
A 75% loss requires a 300% recovery.
This is why extremely volatile launches require a different mindset.
The same liquidity that can push a token upward extremely quickly can also amplify selling pressure just as aggressively.
📊 MARKET CAP DOES NOT EQUAL LIQUIDITY
One of the most important things to understand about young ecosystems is the difference between valuation and actual liquidity.
Early Arc market data showed examples such as LONG around a $7.76 million market cap with roughly $324,000 liquidity, COOL around $6 million with approximately $360,000 liquidity, and TOLLY around $5.25 million with roughly $275,000 liquidity.
That means only a relatively small amount of liquidity may be available compared with the headline market capitalization.
So when significant buying or selling enters the market, price can move dramatically.
A token having a $7 million market cap does not mean there are $7 million of readily available bids waiting underneath the price.
That distinction becomes especially important during a new-chain launch.
⚡ ARGUS SHOWED HOW FAST ATTENTION CAN MOVE
ARGUS has already demonstrated how quickly attention can translate into large trading activity.
Its early rally pushed its market capitalization above $30 million according to initial market reports, while trading activity reached million-dollar-scale levels.
That kind of momentum can attract more traders, more liquidity and more attention.
But it can also create expectations that the next move must be another massive rally.
Markets do not work that way.
A token can rise 100%, 200% or even 500%, and still experience a sharp correction afterward.
The size of the previous move does not guarantee the size of the next one.
🔍 WHAT SHOULD WE WATCH NEXT?
For me, the next phase is less about finding the biggest green candle and more about studying the underlying market structure.
I would watch:
• Price movement
• 24-hour trading volume
• Liquidity
• Market capitalization
• Holder distribution
• Transaction activity
• Actual product usage
• Community activity
These metrics together can tell a much more complete story than price alone.
For example, a 30% correction with healthy liquidity and strong volume is very different from a 30% decline accompanied by disappearing liquidity and rapidly falling activity.
The quality of the move matters.
🌐 ARC IS BIGGER THAN MEME TOKENS
This may ultimately be the most interesting part of the entire launch.
The first wave of Arc assets is highly speculative, but Arc itself is targeting a much broader financial ecosystem.
USDC-native gas could make transaction costs easier to understand for financial applications because users do not necessarily need to maintain a separate volatile gas token.
Its focus on payments, DeFi, FX, trading and tokenized assets creates multiple potential sources of network activity.
Meme tokens can attract attention.
DeFi can attract capital.
RWA can connect blockchain infrastructure with traditional assets.
Payments can generate transaction demand.
FX can create settlement use cases.
And USDC can provide a stablecoin-based foundation across these activities.
That is a considerably larger thesis than simply asking which Arc token might pump next.
🏗️ ARC THE NETWORK ≠ EVERY ARC TOKEN
This distinction is extremely important.
Arc can develop into useful financial infrastructure even if some early tokens fail.
Likewise, an individual token can rise hundreds of percent without proving that its underlying project has sustainable long-term utility.
The first wave is about speculation and price discovery.
The next stage should be about survival.
Which projects maintain liquidity?
Which continue producing meaningful volume?
Which attract real users?
Which keep building after the initial excitement disappears?
Which communities remain active after major corrections?
Those questions will become increasingly important.
🛡️ GATE TRENCHES ADDS ANOTHER LAYER
Gate’s early support for Arc also puts the ecosystem directly into the trading conversation.
Gate Trenches provides zero-gas-fee trading for Arc assets, reducing one layer of transaction friction when exploring newly launched assets.
But there is an important distinction:
Zero gas does not mean zero risk.
Lower execution friction can make trading more convenient, but it cannot protect a trader from a 40%, 70% or 75% price decline.
Risk still comes from volatility, liquidity, valuation, market structure and execution.
🚀 THE REAL ARC TEST IS STILL AHEAD
The first 24 hours have shown that Arc can generate attention.
ARGUS demonstrated explosive price discovery.
LONG and COOL demonstrated how thin liquidity can amplify both upside and downside.
The sharp September 17 corrections demonstrated that early Arc trading is absolutely not a one-directional market.
But the bigger question is what happens next.
Can liquidity deepen?
Can developers continue building?
Can users arrive?
Can DeFi and RWA applications gain traction?
Can payment and financial applications create sustainable transaction demand?
That is the transition I will be watching.
The first phase asks:
“What can pump?”
The next phase asks:
“What can survive?”
And the mature phase asks:
“What can actually become useful?”
Arc has only just opened its doors.
The charts are already moving violently, the first tokens are experiencing extreme price discovery, and Gate is supporting the ecosystem from the beginning.
For me, the most important story is not simply which Arc token makes the biggest move.
It is discovering which projects can maintain liquidity, volume, users and real utility after the launch hype fades.
That is where the real Arc story begins. 🌐
#GateMeme狂欢季 #weeklyshare @Gate_Square #ShareWeekly
repost-content-media
ARC-1.37%
ARGUS-2.56%
TOLLY-7.22%
USDC0.00%
GM fam!
Say it back? ☕
post-image
🔥 Featured Lead Trader Recommendation | Head of the Shanhai Community
Specializing in XAU gold CFDs and skilled at capturing short-term trend opportunities,
following market momentum and responding flexibly to fluctuations in the gold market.
👉 Copy his trading strategy with one click:
https://www.gate.com/zh/copytrading/trader/tradfi/185786
#跟单 #CFD #黄金交易 #XAU #短线交易
CopyTrading
🔥 Featured Lead Trader Recommendation | Head of the Shanhai Community
Specializing in XAU gold CFDs and skilled at capturing short-term trend opportunities,
following market momentum and responding flexibly to fluctuations in the gold market.
👉 Copy his trading strategy with one click:
https://www.gate.com/zh/copytrading/trader/tradfi/185786
#跟单 #CFD #黄金交易 #XAU #短线交易
repost-content-media
XAU-0.12%
  • 4
GM if you’re bullish! 🔆
post-image
Technical analysis applied properly is powerful
💯
post-image
$ETH bounced, bounced.
ETH+2.22%
Range-bound TAO is secretly building a SHORT breakout most traders will miss.

$TAO /USDT - SHORT

Trade Plan:
Entry: 225.7 – 227.1
SL: 233.2
TP1: 221.3
TP2: 217.9
TP3: 212.9

Why this setup?
Why now? The daily trend remains range-bound, but the 1h price sits at 226.4 inside a tight 225.7 to 227.1 entry zone, signaling exhaustion at the top of the range. The 15m RSI at 61.93 shows mild bullish overextension, giving sellers a realistic target to pull it back down. With the 1h ATR at 2.818079, each candle carries enough volatility to reach TP1 at 221.3 and TP2 at 217.9 comfortably. The line i
TAO+5.64%
Insiders are quietly setting up a short on SNDK while the range traps buyers.

$SNDK /USDT - SHORT

Trade Plan:
Entry: 1535.51 – 1541.25
SL: 1565.95
TP1: 1517.71
TP2: 1503.92
TP3: 1483.25

Why this setup?
Why now? The 1h price is 1538.38, the 15m RSI sits at 59.16 showing neutral exhaustion, and the 1h ATR of 11.485579 confirms the daily range still has room to break. The entry zone between 1535.51 and 1541.25 aligns with that 1h level, TP1 at 1517.71 offers the first measurable target, and TP2 at 1503.92 extends the reward while the invalidation level at 1613.37 acts as the hard line in th
SNDK-0.23%
🚨 RUSSIA’S MOEX TO LAUNCH CRYPTO PERPETUAL FUTURES!
Moscow Exchange will start perpetual futures trading on $BTC $ETH $SOL $XRP and $TRX indices from September 22.
These cash-settled contracts will be available for qualified investors with daily auto-renewal.
post-image
BTC+1.15%
ETH+2.20%
SOL+3.41%
XRP+1.23%
TRX+0.02%
$MU /USDT is about to break range, and most traders are unprepared.

$MU /USDT - SHORT

Trade Plan:
Entry: 937.18 – 939.76
SL: 950.89
TP1: 929.15
TP2: 922.94
TP3: 913.62

Why this setup?
Why now? The 4h setup shows a short bias with confidence at 55.4, and the 1h price is sitting at 938.38 inside the entry zone between 937.18 and 939.76. The 15m RSI at 60.87 signals neutral momentum, while the 1h ATR of 5.176703 quantifies the volatile expansion that makes this trade viable. The invalidation level is 960.69, which acts as the hard line in the sand for the entire setup.

Debate:
Are we test
MU+0.30%
Let me tell you a quick story about the ongoing battle for crypto rules in Washington. 📣 Senator Kirsten Gillibrand just made it clear that she and her fellow Democrats are not giving up on passing the Clarity for Payment Stablecoins Act. She wants the industry to know that this fight is far from over. 💪 However, if we look behind the scenes, crypto analysts are not holding their breath. They believe it is very unlikely that Congress will pass this bill anytime soon, pointing instead to a different direction. 🤔
This matters because stablecoins like $USDC are crucial for daily market activit
post-image
USDC0.00%
#Gate广场中秋团圆局 A meme rally usually starts with a headline. The more interesting part begins after the headline.
Solana’s meme sector is showing renewed activity, but the current numbers suggest this is still a liquidity test rather than a confirmed meme season. Current market data puts the Solana meme category around $3.34 billion, with the category up roughly 5.1% over 24 hours. That is enough to bring traders back into the sector, but not enough by itself to prove that capital has rotated across the entire ecosystem.
What I would watch first is not the biggest green candle. It is the relation
MEME+3.71%
SOL+3.41%
PENGU+7.23%
BONK+6.96%
  • 5
Guys, when the spread widens on a perp project, don’t just say “high volatility”—several times, it was the MM pulling quotes from the top few levels.
After adjusting the project’s inventory cap and cancellation cadence (sanitized), the spread median converged significantly under the same vol. The before-and-after comparison is here.
No matter how loud the paper narrative is, what matters is whether the top few levels can actually execute. (9/17)
#crypto #DeFi #marketmaking
post-image
New Gate ETF listing: $ZEC
🔹 Trading pairs: #ZEC5L / $USDT, #ZEC5S / $USDT
🔹 Trading time: September 17, 2026, 15:00 (UTC+8)
🔹 Supports 5x leveraged long and short positions for more flexible trading
Trade:
https://www.gate.com/trade/ZEC5L_USDT
https://www.gate.com/trade/ZEC5S_USDT
More: https://www.gate.com/announcements/article/101794
GateLaunch
New Gate ETF listing: $ZEC
🔹 Trading pairs: #ZEC5L / $USDT, #ZEC5S / $USDT
🔹 Trading time: September 17, 2026, 15:00 (UTC+8)
🔹 Supports 5x leveraged long and short positions for more flexible trading
Trade:
https://www.gate.com/trade/ZEC5L_USDT
https://www.gate.com/trade/ZEC5S_USDT
More: https://www.gate.com/announcements/article/101794
repost-content-media
ZEC+16.17%
ZEC5L+4.37%
ZEC5S-4.21%
I had already finished complaining to my friends about this week’s market, but now I have to take it all back—awkward.

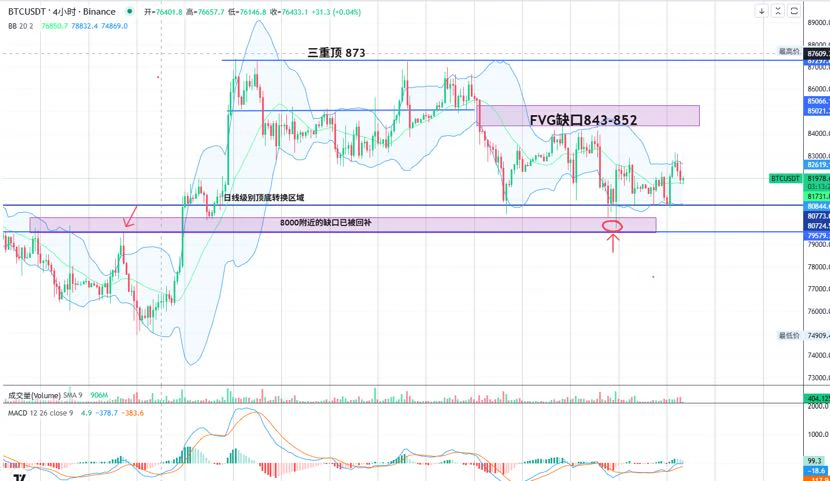
A few afternoons ago, $BTC ’s long position retest held, buying pressure strengthened, and I signaled opening a long position around 63014.1. Now at 76481, with +3715.52% secured—taking off. Those on board should have woken up laughing.

Take profit on 80% first, and protect the remaining 20% at the entry price. Don’t get greedy for the last bite; bank the bulk first.

Panic comes from having no plan, and losses come from overthinking. Don’t lose your patience in the range
post-image
BTC+1.15%
SOL+3.41%
BNB+2.51%
Thursday’s Key Events
🔹TBD | U.S. SEC meeting to discuss 24-hour trading
🔹15:00 | Ministry of Commerce regular press conference
🔹17:00 | Eurozone August CPI inflation final reading
🔹19:00 | Bank of England interest rate decision + meeting minutes
🔹20:30 | U.S. initial jobless claims, housing starts, Philadelphia Fed manufacturing, and other major data releases
🔹22:00 | U.S. pending home sales index
🔹22:30 | EIA natural gas inventories

A slew of data is due tonight, and market volatility is likely to intensify. Watch for short-term impacts from the news. #美联储三年来首次加息25个基点 $BTC
post-image
BTC+1.15%
#BrentCrudeDrops3%
$XTIUSD $XBRUSD #ShareWeekly
#Gate广场中秋团圆局
Why Oil Just Gave Back Days of Gains, and Why That Doesn't Mean the Story Is Over
Brent crude settled at 105.83 dollars per barrel on September 17, down 2.69 percent, while WTI dropped over 3 percent, trading around the 100 to 101 range. After a stretch of sharp gains driven by Middle East supply fears, this pullback is worth understanding properly, because the reasons behind it matter more than the percentage drop itself.
The two things driving this pullback
Saudi Arabia is reportedly offering additional crude cargoes to Asian
XTIUSD-0.27%
XBRUSD-0.54%
  • 2
Load More

Join 40 M users in our growing community

⚡️ Join 40 M users in the crypto craze discussion

💬 Engage with your favorite top creators

👍 See what interests you

Trending Topics

GateTopsStockPerpetualCoverage

35.36k Views1.58k Discussing

According to the latest DefiLlama report, Gate has listed 385 stock-related perpetual contracts, ranking first in coverage; average daily volume is about $1.15B and average open interest about $738M, both ranking third in the industry; liquidity depth for its five highest-volume contracts — SNDK, SKHYNIX, SPCX, SOXL, and MU — ranks first across the board. How do you view Gate leading in both coverage breadth and liquidity depth? [👉 Full Report](ttps://defillama.com/research/spotlight/deep-enough-trade-gate-case-tokens-stocks)

FedHikes25bpsForFirstTimeIn3Years

30.53k Views6.86k Discussing

GateTrenchesExclusive0GasTrading

45.94k Views663 Discussing

View More