Square
Following
Hot
News
Profile
Share your thoughts
placeholder
Article
Bitcoin market caps correlation
live-cover
LIVE18
#KOSPIJumps3.3% #ShareWeekly
KOSPI Rebounds After a 7.6% Crash: Is the Semiconductor Sell-Off Over, or Is More Volatility Ahead?
The Asian stock market experienced a dramatic shift on October 15–16, 2026, as semiconductor stocks came under heavy selling pressure before staging a partial recovery. South Korea’s KOSPI index suffered a sharp 7.6% decline on October 15, dropping to 5,554 points and triggering a circuit breaker. The index touched its lowest level since April, highlighting how quickly market sentiment can change when inflation concerns, interest-rate expectations, and uncertainty s
SK Hynix+0.79%
JPN225+0.00%
NAS100-0.52%
CXMT-0.53%
Trenches
AGT
A
bade
b
AGT
0x5d...e274
Market Cap
$.
Change
.
24h Vol
$.
Holders
.
CNPY
C
bade
b
CNPY
0xc6...ddd2
Market Cap
$.
Change
.
24h Vol
$.
Holders
.
Q
Q
bade
b
Q
0xc0...0589
Market Cap
$.
Change
.
24h Vol
$.
Holders
.
COVENANT
C
bade
b
COVENANT
0xcd...de79
Market Cap
$.
Change
.
24h Vol
$.
Holders
.
Gato
G
bade
b
Gato
55A3...pump
Market Cap
$.
Change
.
24h Vol
$.
Holders
.
EtherFi's borrowing market is the largest app on Optimism, with $300.5M locked, nearly six times Aave V3's $50.35M on the network. Its loans are up 24.81% in the past 30 days to $41.55M.
@ether_fi
OP-6.56%
AAVE-2.40%
BTC falls 0.62% in 24 hours, with $31.89 million in sell volume in the final hour
Gate spot BTC/USDT is currently quoted at 81285.5 USDT, down 0.62% over 24 hours, with a high of 81818.4 and a low of 80817.0. That 0.62% is almost negligible on the daily chart, but the final hourly candle was different: it opened at 81647.1, plunged to a low of 80817.0, and closed at 81124.9, with 31.89 million USDT in hourly trading volume—more than three times the previous hour’s approximately 8.71 million.
What I’m more interested in is whether this drop was accompanied by volume. Looking at the latest 48 ho
BTC-0.47%
  • 1
Set it up this way to automatically clean up 99% of comments.
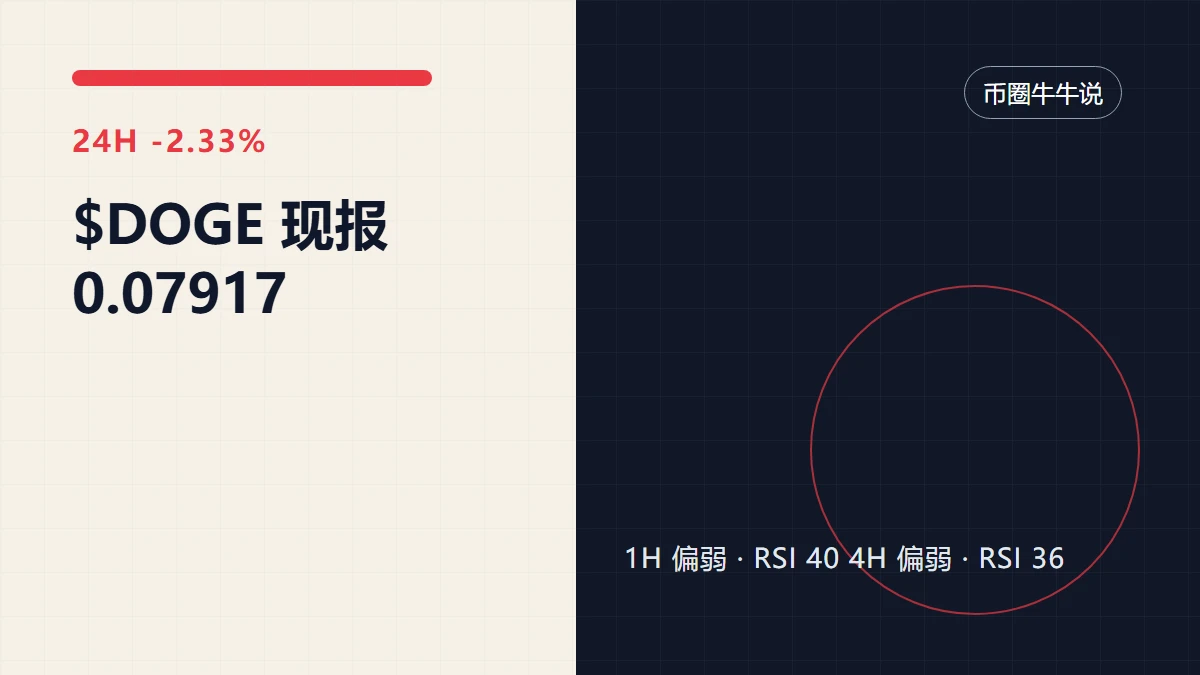
Find opportunities in $DOGE using price-volume confirmation; key levels and exit lines are here
What stands out most in this $DOGE chart is not the 2.33% 24-hour decline itself, but that the 1-hour and 4-hour charts are both weak yet haven’t delivered the same answer.
My view is that direction is taking shape for now, but low participation has reduced the credibility of this move.
$DOGE The current price is 0.07917, with a 24-hour range of 0.07702–0.08107. The 1-hour support is at 0.07702, with resistance at 0.08096; the two more distant 4-hour boundaries are 0.07702 and 0.08566. These numbers
post-image
DOGE-2.32%
$Bull is coming. This move dumped from 0.0653 to 0.0560. I chased the highs last time and took an 18% loss as tuition—I still remember it clearly. It’s now at 0.0570, down 12.29% in 24h, with 12.6M in trading volume. Volume hasn’t collapsed, which means buyers are stepping in. My plan: don’t chase at the current price; wait for a pullback to the 0.0560–0.0565 range and enter in batches, keeping my position to 30%. Set a stop-loss at 0.0540 (below the previous low); if it breaks, I’m out—no hesitation. First take-profit target: 0.0600; second: 0.0630. Sell half when it gets there. This coin is
牛来-9.85%
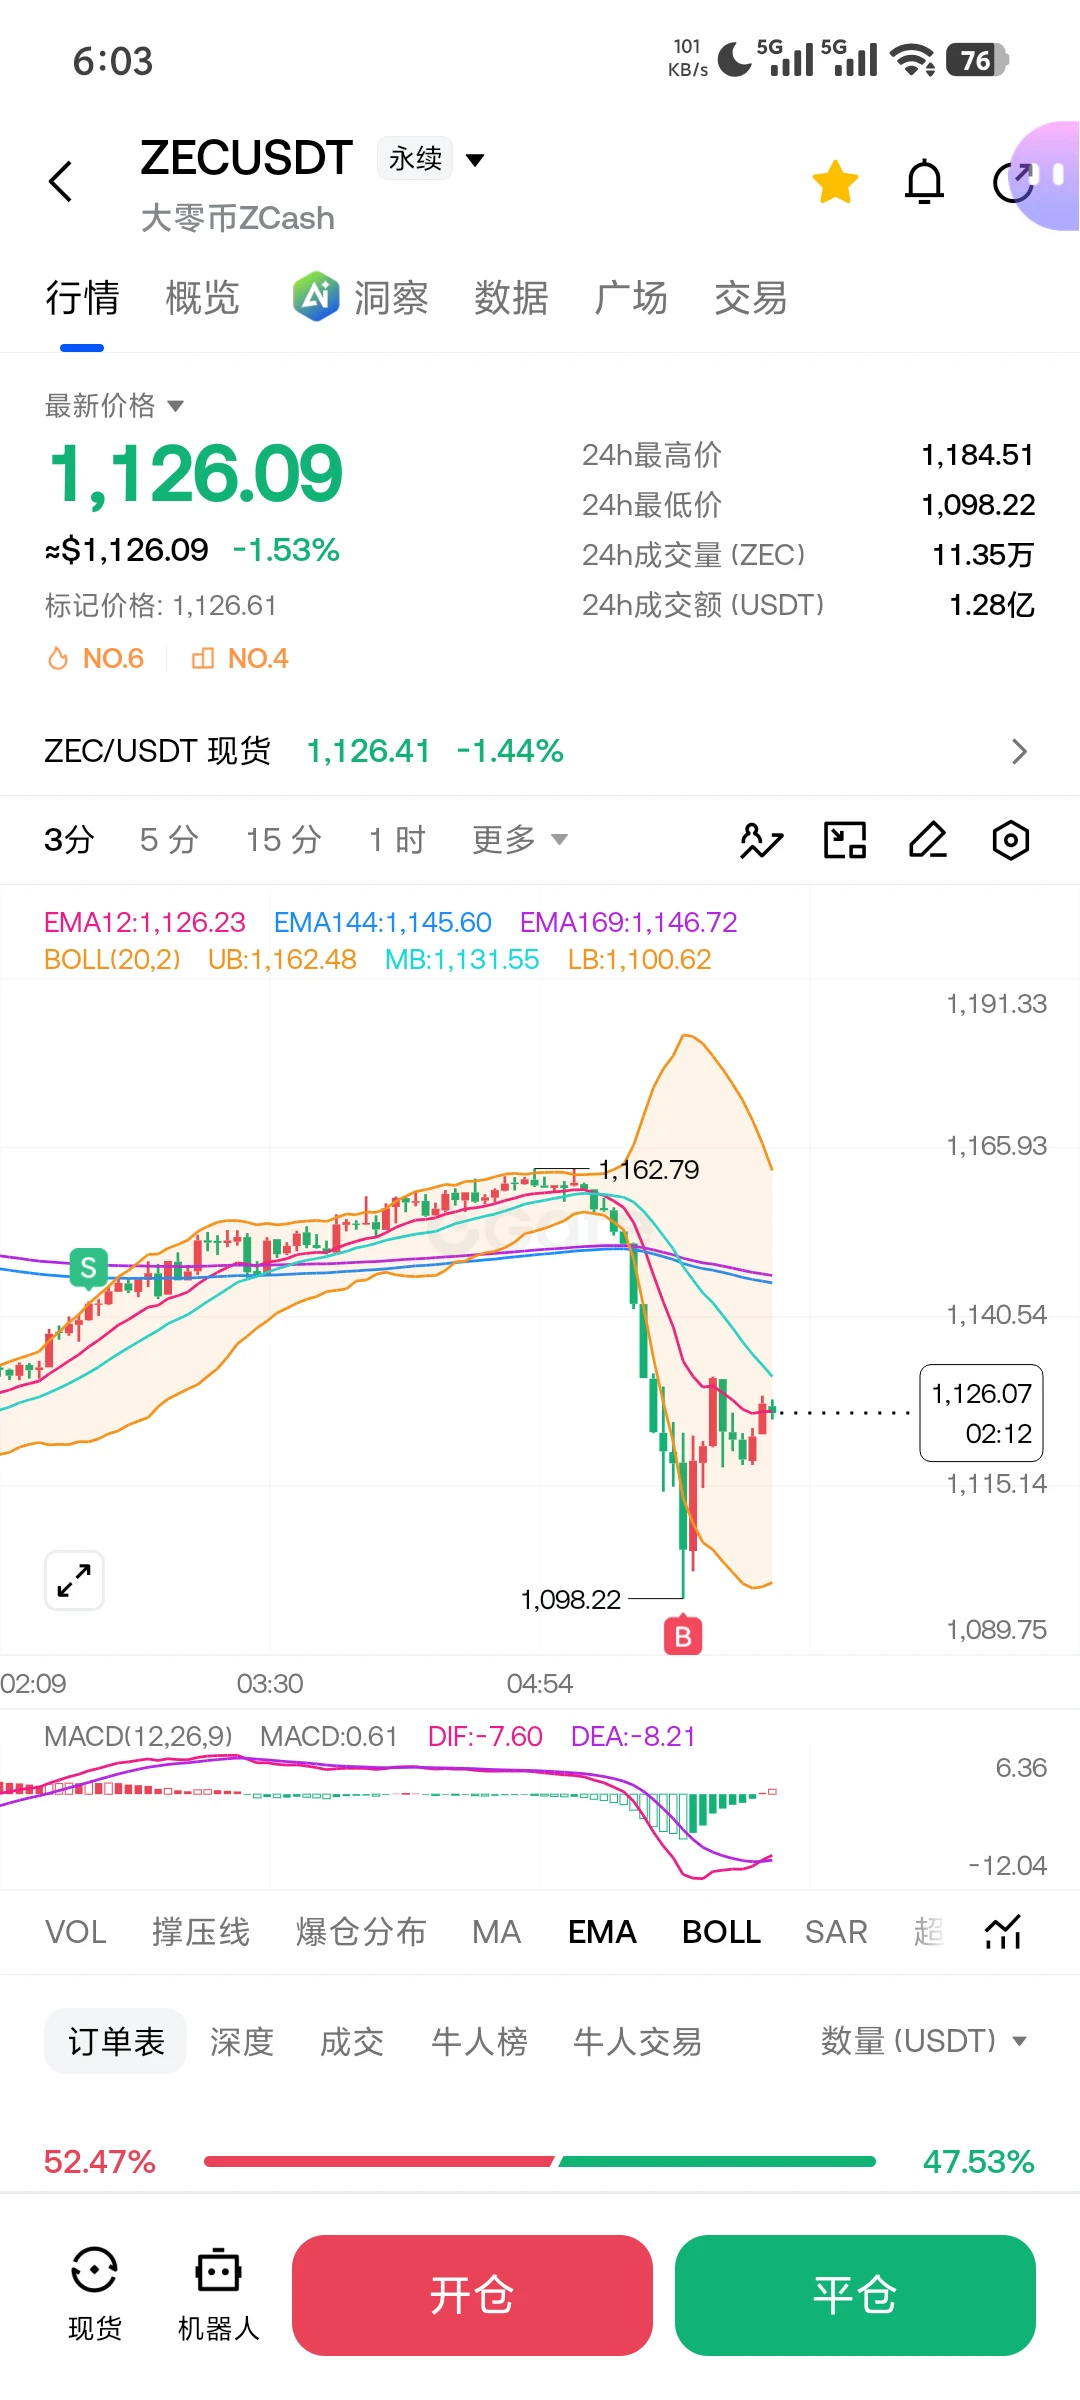
$ZEC I went from an unrealized loss of 2,500U to a profit of 900U and closed at take-profit. The price came within 2U of triggering my stop loss, then fell. Thanks for sparing me
post-image
ZEC-2.36%
$JCT I know exactly how I lost on this trade: I got in at 0.0023 and cut my losses at 0.0019, riding out the full -11.93% drop. I contributed to the panic selling in the 5.4M trading volume. Seeing the price near its 24h low, I thought I’d buy the dip, but ended up buying halfway down. I didn’t admit defeat and exit until it hit 0.0019. During the two days I held the position, my mindset went from “it’ll bounce any minute” to “just don’t let it go to zero.” There’s only one lesson: in a downtrend, it’s better to wait for the falling knife to settle than to try to catch it. 0.0019 is today’s lo
JCT-13.37%
every time $BAT tries to get back up, those moving averages just slap it right back down. brutal.TP: 0.1685SL: 0.19016Hot coins:$ZEC : Current Price 1,123.48 - 24h Change: -1.36%$BTW : Current Price 2.5529 - 24h Change: +32.08%
post-image
BAT-9.52%
ZEC-2.36%
BTW+28.27%
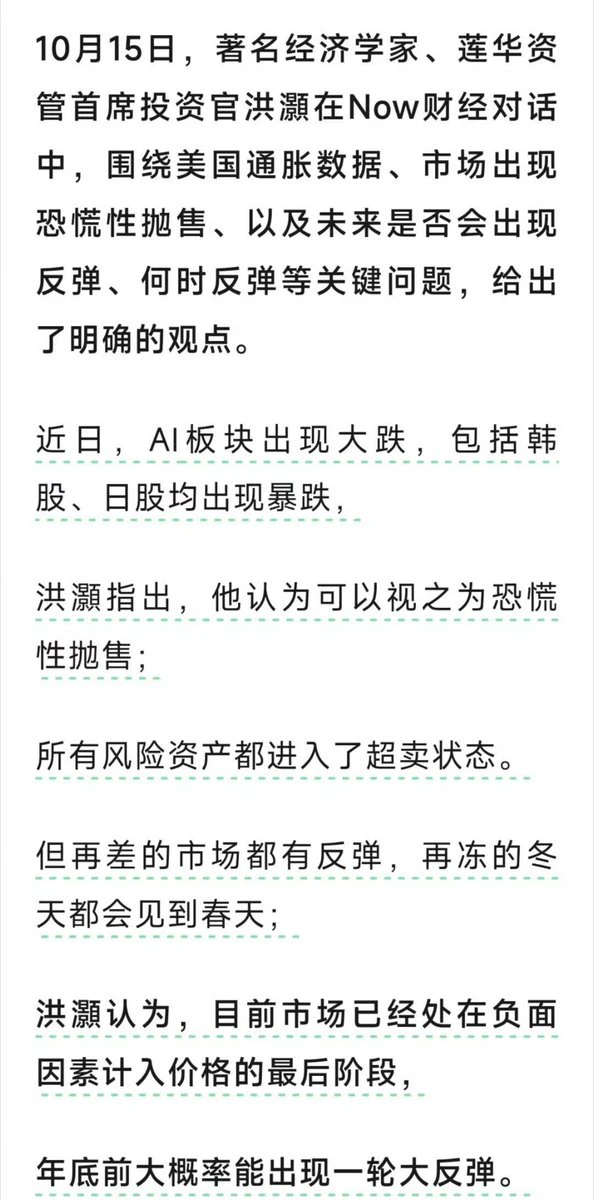
Hong Hao: The current market has entered oversold territory and is in the final stages of the sell-off. All risk assets are oversold, and a rebound is highly likely before the end of the year.
post-image
Same range just chop all around for $ETH .
Deviation? Continuation? Or still chop
ETH-1.25%
Is this rally finally going to hold, or are we watching the same old liquidity trap again? Seeing $EIGEN
try to reclaim these levels today has me a little nervous. Is anyone else waiting to see whether buyers actually step in this time? Take profit: 0.261 Stop loss: 0.241 Other coins: $BTW : Current price 2.5221 - 24-hour change: +32.53%$ZEC : Current price 1,119.5 - 24-hour change: -1.89%
post-image
ZEC-2.36%
The Magnificent Seven are propping up S&P earnings growth. The earnings data is still there, but this level of concentration is a risk in itself. Once the social media buzz cools, the crowded trade can quickly unwind. After doing this for so long, I’ve learned that position sizing is always more important than getting the direction right. What do you think?
post-image
SPX+6.20%
$GTC Strong rebound from the key FVG area on the 1-hour chart; expected to pull back to the major liquidity zone around $0.255 to $0.260.‼️
Long $GTC Entry: 0.235 - Current price Take profit: 0.257 Stop loss: 0.215 Trade here $GTC 👇
post-image
The morning sunlight shines on the flower’s center,
making it especially radiant.
May your mood bloom like a flower
🐷🐷🐷🐷
post-image
📘 The P2P order book isn’t a price list: it’s a snapshot of what people are willing to buy and sell at a given moment. Reading it correctly changes three specific decisions: which bank you use, what amount you request, and what limit you accept. A guide to reading it like a trader.
WHAT IT IS AND HOW IT DIFFERS FROM SPOT
In spot trading, there’s a centralized order book with a single pricing engine. In P2P, each level is an ad from a real person: their bank, limits, reputation, and payment method. That’s why there’s no such thing as “the price of USDT”: there’s a price for your amount, your b
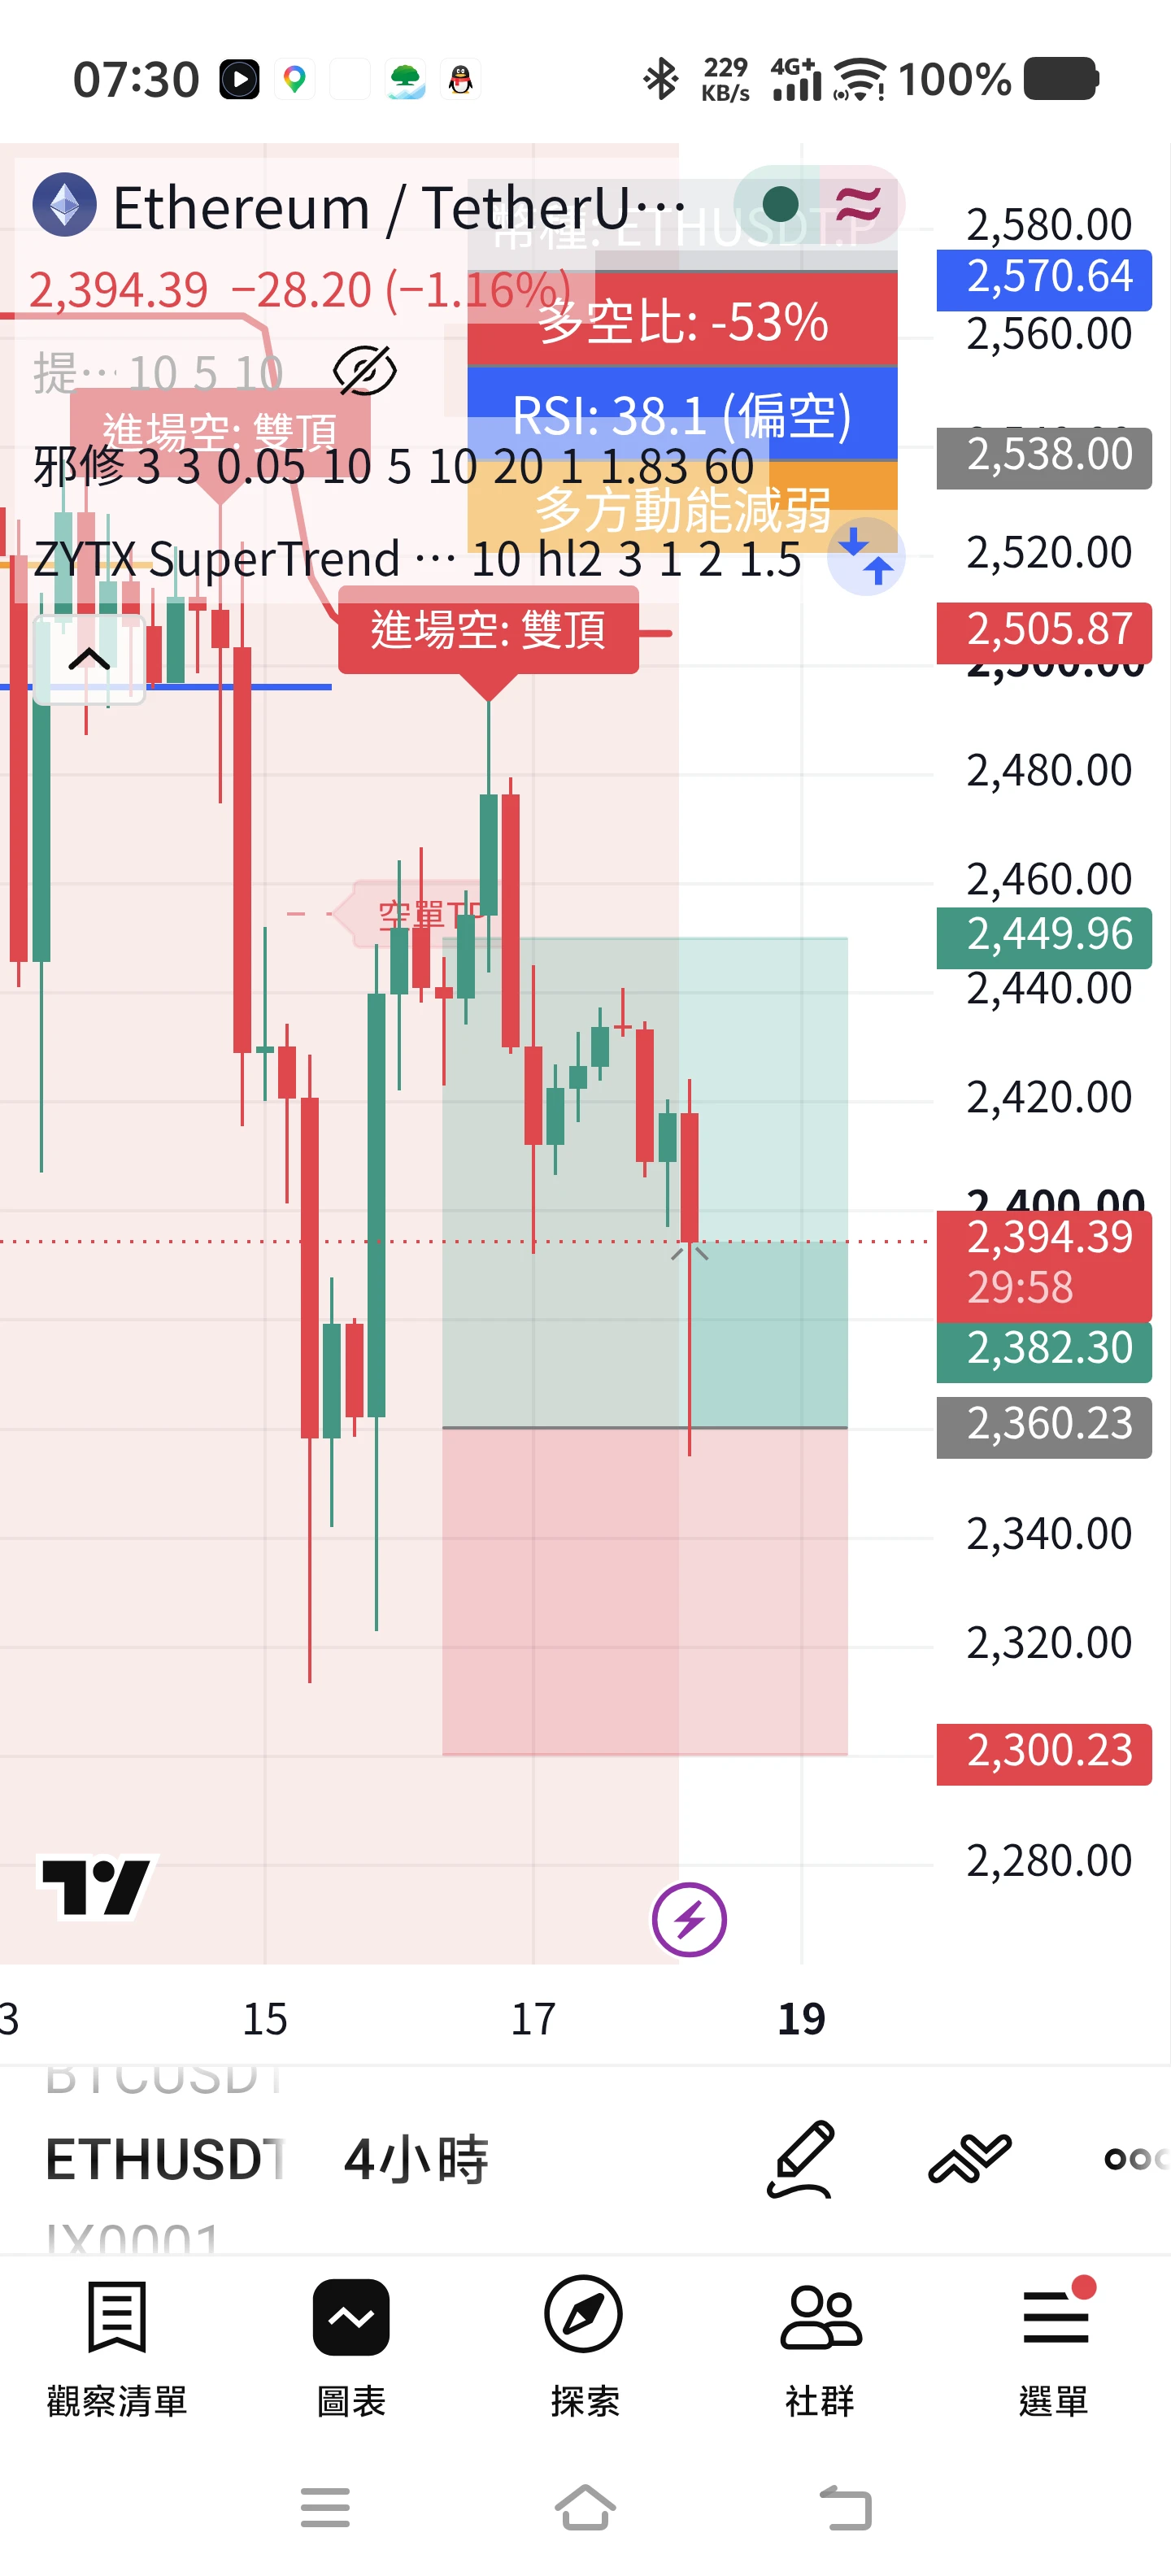
Planning to open the next trade at 2360 with a 1:1.5 risk-reward ratio
post-image
🤖 NEW PREDICTION MARKET: Can Gemini 4 Argon (High) finish first on Oct. 19?
Gemini 4 Argon (High) leads at 93.5% in the Oct. 17 snapshot. Rivals need an eligible Text Arena entry; the noon ET ranking decides the result.
post-image
Load More

Join 40 M users in our growing community

⚡️ Join 40 M users in the crypto craze discussion

💬 Engage with your favorite top creators

👍 See what interests you

Trending Topics

USSeptemberPPIBeatsExpectations

91.35k Views1.93k Discussing

US September PPI came in at 6.3% YoY, well above the 5.3% market expectation, pointing to renewed producer-side inflation pressure. Weekly jobless claims were 199K, broadly in line with forecasts. Could hotter inflation further reduce room for rate cuts, and what does it mean for $BTC, US stocks, and gold?

GateWCTCS9GlobalTradingCompetition

37.87k Views6.68k Discussing

GateBTCAndETHFuturesVolumeRanksTop3

53.8k Views1.81k Discussing

View More