




Share your thoughts
placeholder
Article
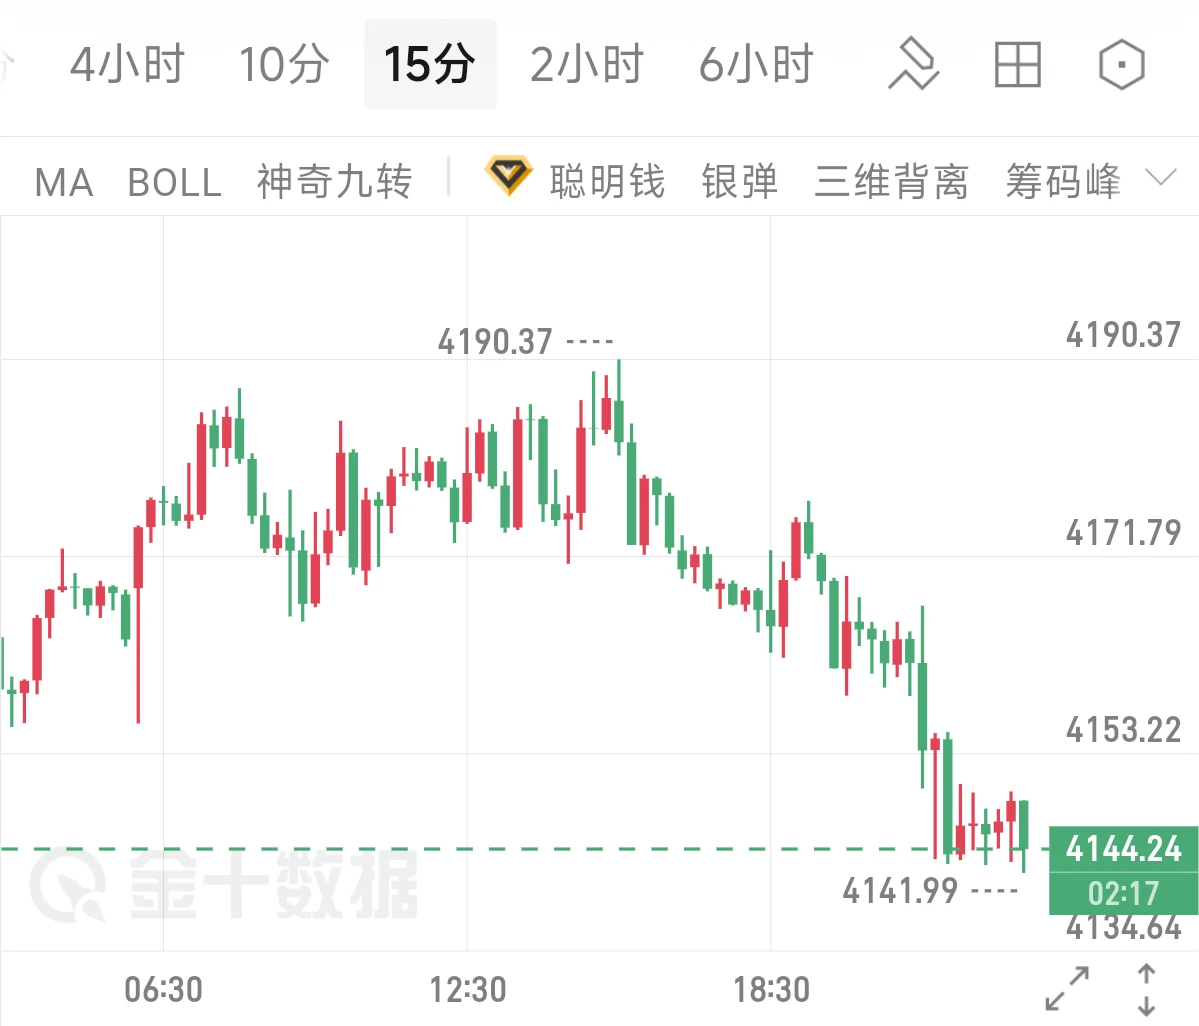
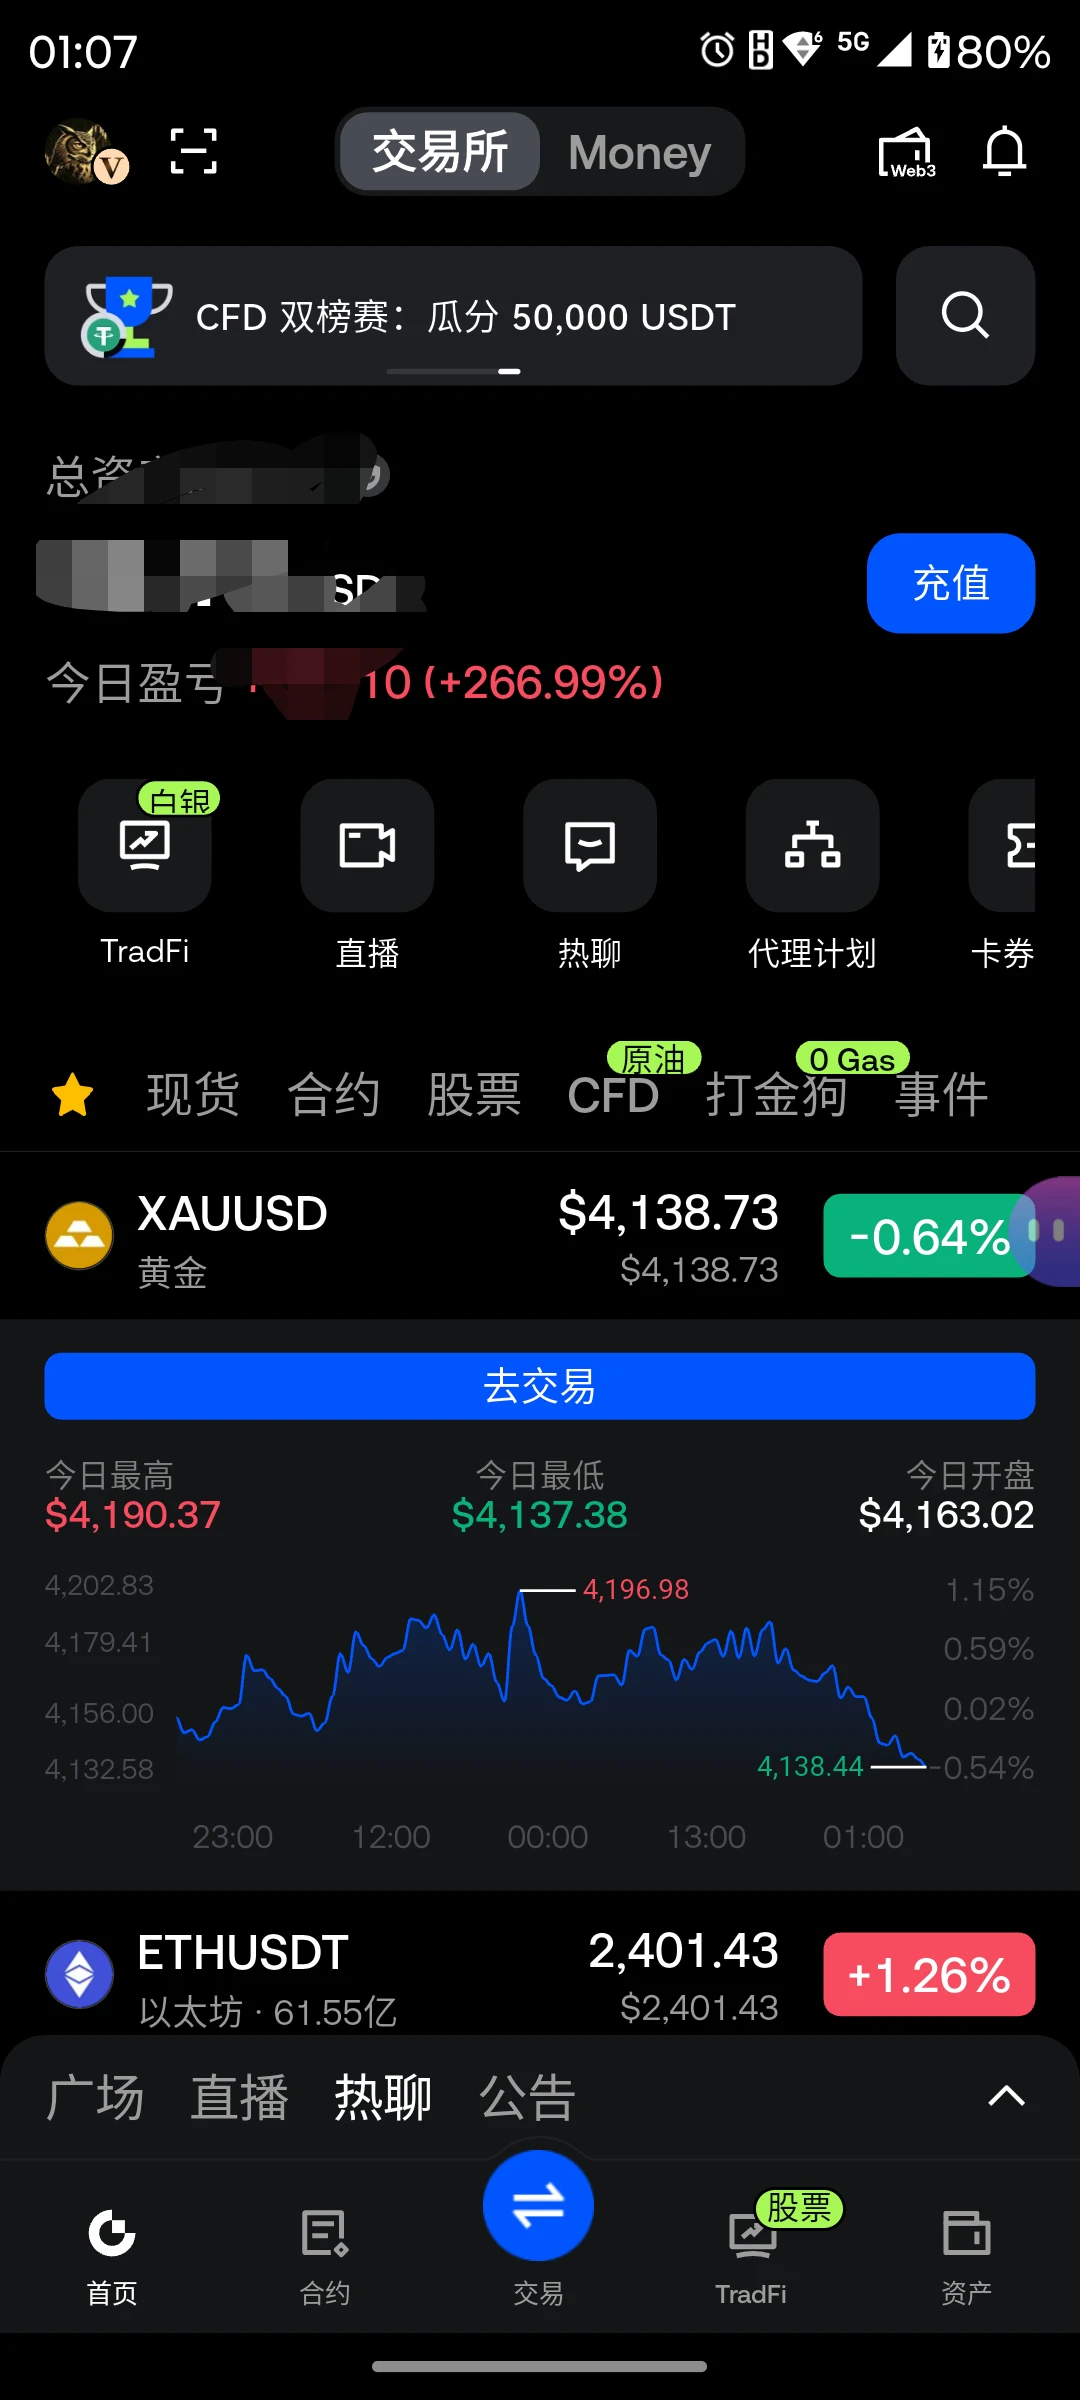
Nobody is talking about this SHORT setup on $XAU /USDT right now.

$XAU /USDT - SHORT

Trade Plan:
Entry: 4413.02 – 4418.08
SL: 4439.86
TP1: 4397.32
TP2: 4385.16
TP3: 4366.93

Why this setup?
Why now? The daily trend is range, which means $XAU /USDT is coiling for a directional move and the 1h ATR of 10.129983 confirms enough volatility to fuel a clean leg down. The 15m RSI sitting at 55.64 shows the short-term momentum has not yet rolled over, so we are waiting for that precise shift to trigger our entry around 4415.55. If price pushes into the 4413.02 to 4418.08 zone, the plan targets TP1
XAU-0.16%
$ROSE ABOUT TO MIMIC $ICP
post-image
ICP+12.56%
We about to put the #VOLT in you 💹👀
RH is not playing ⚡️#pons
post-image
VOLT-21.32%
RH+0.98%
PONS-17.87%
I had just switched the app to the background when it shot right back up—was it playing hide-and-seek with me? When I opened the market chart this morning, $BCH was still grinding along the bottom. Looking at the intraday chart, I thought: with this bottoming sideways action and buyers quietly getting stronger, how does this look like it’s about to crash?

That opening dip was practically handing out an entry, so I went with the flow and opened a long position at 247.31. Honestly, I wasn’t expecting it to take off immediately—I just felt this level was worth a try.

Then I switched back just
post-image
BCH+0.51%
BNB-1.74%
BTC-0.93%
Everyone is sleeping on a massive short setup forming right now.

$SKYAI /USDT - SHORT

Trade Plan:
Entry: 0.0560 – 0.0564
SL: 0.0581
TP1: 0.0547
TP2: 0.0538
TP3: 0.0523

Why this setup?
Why now? The daily trend is bearish, which sets the stage for a continuation move lower. The 1h RSI sits at 42.99, signaling bearish momentum without being oversold yet, so the drop is not exhausted. The 1h ATR of 0.000811 shows volatility is expanding just enough to fuel a decisive leg down. The entry zone of 0.0560 to 0.0564 aligns perfectly with the 1h price, offering a precise trigger. The first target
SKYAI-5.66%
Everyone watching the range is about to get blindsided by a sharp breakdown.

$BTC /USDT - SHORT

Trade Plan:
Entry: 79092.3 – 79237.1
SL: 79860.1
TP1: 78643.2
TP2: 78295.5
TP3: 77773.9

Why this setup?
Why now? The 4h trend is range-bound, but the 1h RSI at 51.06 shows momentum is neutralizing just above the midpoint, while the 1h ATR of 289.75 signals a compressed setup ready to explode. The entry zone between 79092.3 and 79237.1 offers a precise short trigger near the 1h price of 79164.7, with TP1 at 78643.2 and TP2 at 78295.5 defining the first two targets of the expected move. The dail
BTC-0.93%
PROLOGUEThis long position was quite comfortable to hold. I entered because a strong bullish candle appeared on the hourly chart and directly broke through the upper boundary of the previous consolidation range. At the time, I judged that this was not just a simple wick but genuine capital entering the market, so I decisively went long after the pullback confirmation.

After entry, the market did not put me through much grind and basically moved upward along the moving averages. I closed 70% of the position around +205.42%, and set a protective stop for the remainder to continue holding, hopi
post-image
PROLOGUE+28.68%
SOL-1.98%
DOGE-0.38%
$XLM /USDT is range-bound, but the 1h setup hints at a short squeeze nobody is talking about.

$XLM /USDT - SHORT

Trade Plan:
Entry: 0.19221 – 0.19365
SL: 0.19983
TP1: 0.18775
TP2: 0.18430
TP3: 0.17913

Why this setup?
Why now? The daily trend is range, yet the 1h ATR of 0.002876 shows volatility is compressing, which often precedes a directional burst. The 15m RSI at 58.47 is neither overbought nor oversold, meaning the next impulse can run hard without a warning divergence. The entry zone at 0.19293 aligns perfectly with the 1h price, giving a clean trigger for a short bias. TP1 at 0.187
post-image
XLM+3.59%
Is the daily range about to snap and send $ETH /USDT straight down?

$ETH /USDT - SHORT

Trade Plan:
Entry: 2490.03 – 2497.75
SL: 2530.98
TP1: 2466.08
TP2: 2447.53
TP3: 2419.72

Why this setup?


Debate:
Are we hitting 2447.53 or getting trapped at 2477.71?

⚠️ Personal market analysis only. NFA — manage risk and DYOR.
Educational content, not investment advice or a recommendation to buy, sell, deposit, or withdraw any asset. No paid promotion or referral/affiliate links.
ETH-0.66%
This trend is so obvious I don’t even need to think—the account is partying on its own. While the screen was glowing green, $BTC was lying still around 77967.8. Others were cutting losses, but I saw a pullback holding firm, with funds stepping in every time it dipped. That signal is clear enough, right?
As expected, when I checked the charts after lunch, it shot straight up to 79196.9 in a single move. The +274.13% profit was safely tucked into my pocket—smooth and satisfying. This move was purely the market being in a good mood, casually scattering some gold coins that happened to land right
post-image
BTC-0.93%
SNDK+0.25%
LAB-2.33%
BTC, Gold, and Crude Oil Analysis
live-cover
LIVE2,594
I originally planned to cut my losses as a sacrifice to the heavens, but the sacrifice never happened—the meat roasted itself. This short trade really delivered 😂

During the intraday plunge, the entire market was moving lower. $SOXS rebounded several times but kept getting stuck at the same hurdle, with volume weakening each time—a classic case of no buyers on the way up. I went with the trend and opened a short position around 52.38, without expecting it to go very far; I was just looking to catch a pullback after its weak rebound. The price has now fallen to 42.83, with a paper gain of +4
post-image
SOXS-2.51%
SNDK+0.25%
ADA-0.63%
Most traders are about to miss the SYMBOL move that just changed everything.

$UAI /USDT - LONG

Trade Plan:
Entry: 0.68953 – 0.70965
SL: 0.60299
TP1: 0.77204
TP2: 0.82034
TP3: 0.89279

Why this setup?
Why now? The daily trend has turned bullish, the 1h price is holding at 0.69959, and the 15m RSI at 52.02 shows room to run before overbought. The 1h ATR of 0.04025 confirms momentum is expanding, not fading, while the entry zone between 0.68953 and 0.70965 keeps risk tight. Targets are stacked at 0.77204 and 0.82034, but the line in the sand is 0.44759, where the entire setup gets torn apart
UAI+21.08%
This was purely the market being in a good mood—it casually tossed out some gold coins, and one just happened to hit me on the head💰
Seriously, after $SNXX pulled back from 12.700, that candlestick was exceptionally clean. While everyone was still watching from the sidelines, it had already reclaimed the key level. I said it while watching the chart: once it holds, stop questioning the direction.
Later, SNXX slowly ground up to 18.278, securing +865.44%. Friends who caught the rhythm should be treating themselves to a chicken leg right now🍗
Taking profits requires discipline: take profit on
post-image
SNXX+0.48%
SOL-1.98%
BNB-1.74%
$ESPORTS /USDT is about to punish longs, and the setup is undeniable.

$ESPORTS /USDT - SHORT

Trade Plan:
Entry: 0.01442 – 0.01450
SL: 0.01482
TP1: 0.01419
TP2: 0.01401
TP3: 0.01374

Why this setup?
Why now? The daily trend is bearish and the 4h signal is armed at 95% confidence, creating a perfect storm for a short. The 1h price is sitting at 0.01446, which is the exact entry_ref for the trade. The 15m RSI at 41.88 shows the asset is weakening but not yet oversold, meaning the move down has room to run. The 1h ATR of 0.000149 indicates enough volatility to push the price from the entry zo
ESPORTS-1.78%
Everyone is about to find out what happens when SYMBOL breaks 88.061.

$HYPE /USDT - LONG

Trade Plan:
Entry: 85.245 – 85.679
SL: 83.383
TP1: 87.021
TP2: 88.061
TP3: 89.620

Why this setup?
Why now? The daily trend is bullish, setting the stage for continuation higher. The 1h price sitting at 85.462 aligns perfectly with the entry_ref, giving us a precise spot to initiate. The 15m RSI at 48.31 shows room to run without being overbought, while the 1h ATR of 0.866321 confirms enough volatility to reach TP1 at 87.021 and push toward TP2 at 88.061. The invalidation level at 83.595 is the line i
HYPE-2.95%
No big-picture vision—I can’t hold on, and the profit on this move was paper-thin, but I absolutely loved it. $SKHYNIX moved both steadily and aggressively, with the timing nailed perfectly.

When it plunged intraday, everyone around me was panicking. I watched the chart and saw that it could no longer be pushed down. Funds quietly entered, volume gradually recovered, and buyers kept stepping in at the bottom. This wasn’t a coincidence—someone got in early.

So I entered a long directly around 1202.67. Someone told me to play it safe at the time. Safe for what? If you don’t reach out when a
post-image
SKHYNIX+4.16%
LAB-2.33%
SOL-1.98%
I was just about to curse it out, but then I looked at my account and thought, forget it—let it dump however much it wants. I’ll keep my mouth shut.
That pre-dawn rebound a few days ago looked like it was rising on the surface, but in reality, every upward push fell just short of gaining momentum. As the bull-trap signals became increasingly obvious, I went straight in short at 0.02694. The current price has now fallen to 0.00739, bringing the unrealized profit to +1779.51%. This short trade wasn’t luck—it was being in the right position.
What should you do after entering? Close 80% first, hol
post-image
ADA-0.63%
BNB-1.74%
Load More

Join 40 M users in our growing community

⚡️ Join 40 M users in the crypto craze discussion

💬 Engage with your favorite top creators

👍 See what interests you

View More