














#BTC跌破8.2万 Bitcoin at $81,570: Has the CPI Shock Been Priced In, or Is $80,000 the Next Test?
Bitcoin’s move below $82,000 has shifted the market’s focus from the possibility of a $90,000 rally to the strength of the current support structure. Trading near $81,570, BTC is facing a combination of renewed US inflation pressure, changing Federal Reserve expectations, and uncertainty over leveraged positioning. The critical distinction is whether the market has already absorbed the inflation shock or whether another round of selling could follow.
September CPI Changed the Macro Picture
The US Bureau of Labor Statistics reported that headline CPI increased 3.7% year over year in September, accelerating from 3.4% in August. Monthly inflation reached 0.6%, compared with 0.4% previously. Core CPI, excluding food and energy, rose 2.6% annually and 0.3% monthly.
Energy was a major contributor. Gasoline prices climbed 9.1% in September, accounting for more than half of the monthly increase in headline CPI. The energy index advanced 5.2% during the month, while shelter costs increased 0.4%.
These figures complicate the outlook for monetary easing. Persistent inflation can keep interest rates restrictive for longer, potentially supporting the dollar and Treasury yields while reducing investors’ appetite for risk-sensitive assets.
However, the inflation report does not automatically guarantee another rate hike. The Fed must evaluate incoming economic data, employment conditions, and the persistence of price pressures before determining its next move.
Why BTC Fell Below $82,000
Bitcoin’s decline reflects the sensitivity of crypto valuations to macroeconomic expectations. When inflation exceeds forecasts, markets may reassess the timing of rate cuts or the possibility of further tightening. Higher expected borrowing costs can make speculative positions less attractive, particularly when leverage is elevated.
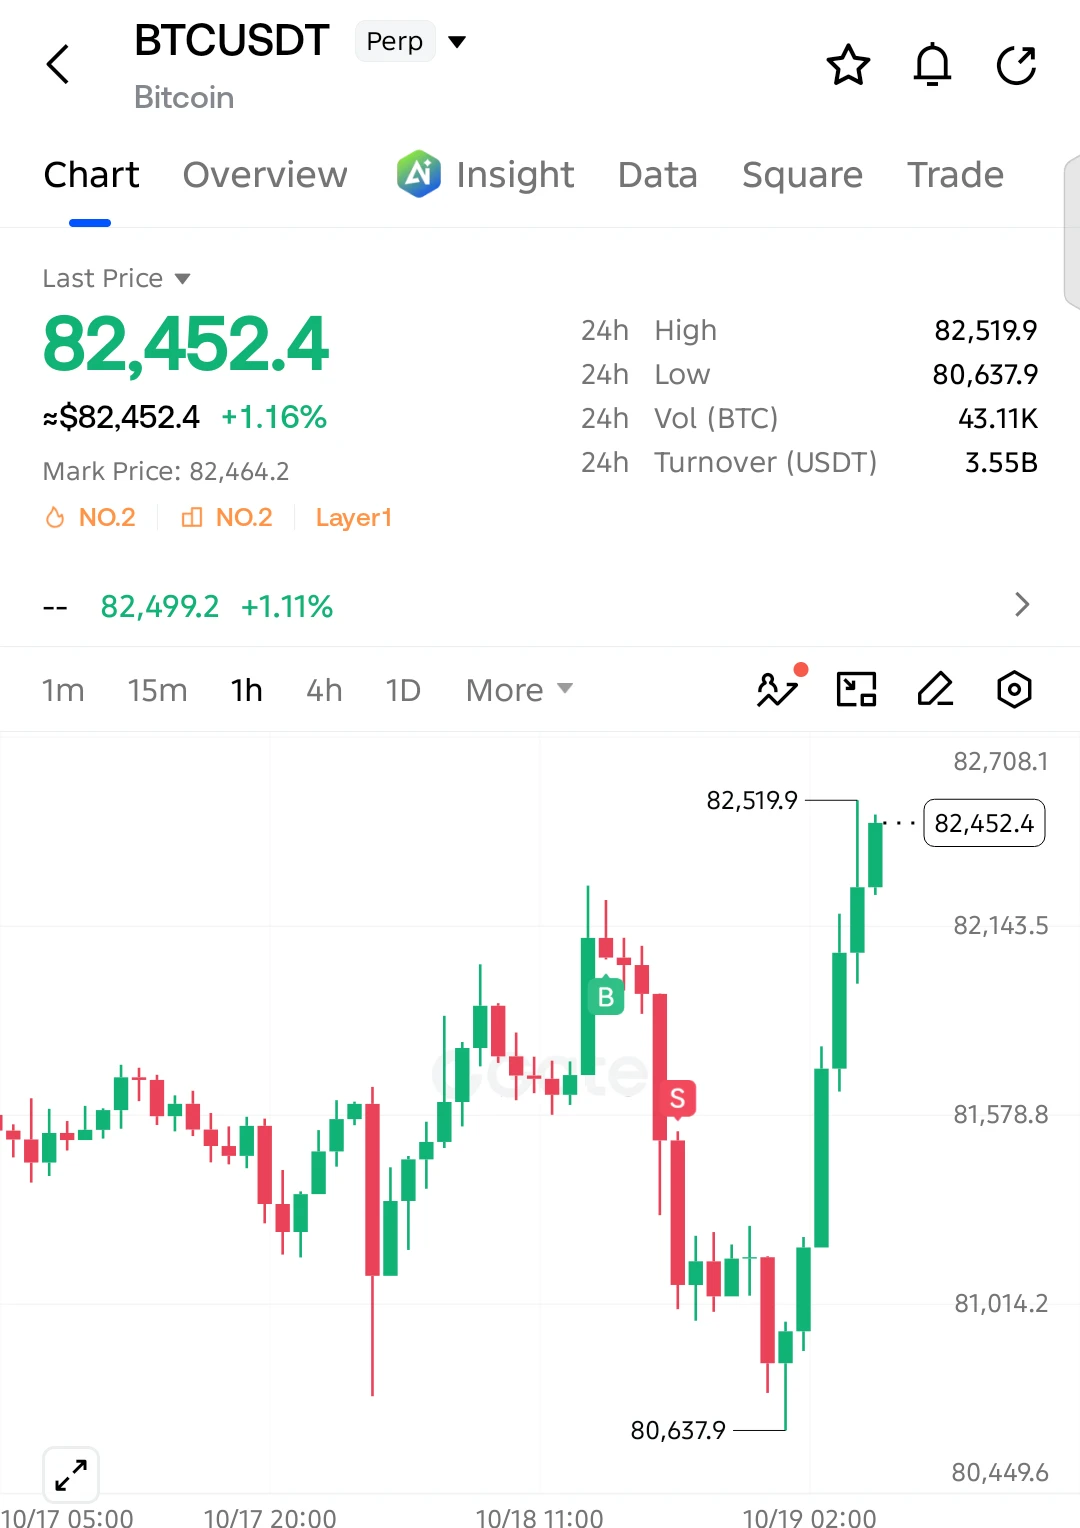
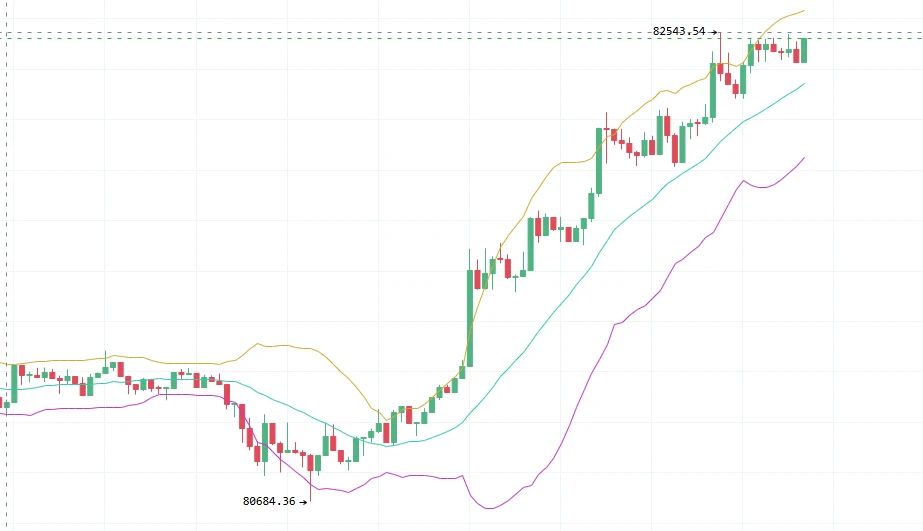
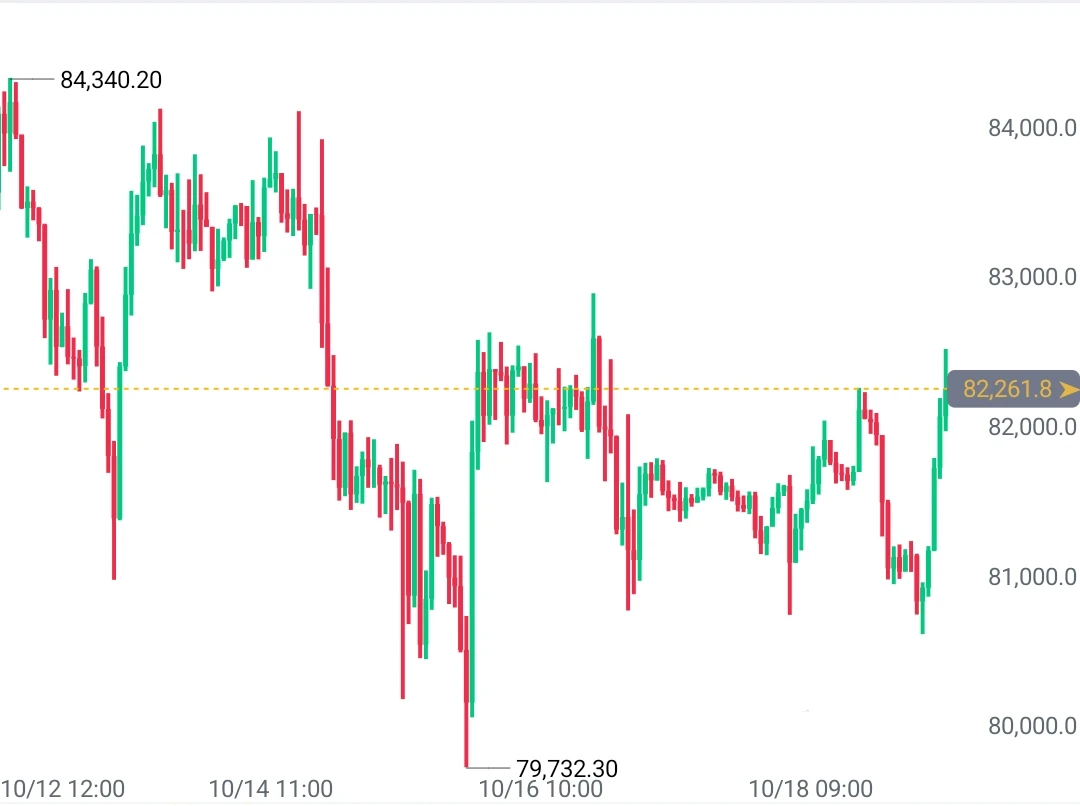
Market reporting following the CPI release showed Bitcoin falling to approximately $80,247 before trading around $80,743 in the subsequent session. BTC has since approached the $81,570 level referenced here, but a recovery from the lows alone does not confirm a trend reversal.
The key question is whether buyers are returning through sustained spot demand or whether the rebound is primarily driven by short covering. These two scenarios can produce similar price action initially but have different implications for durability.
The $81,000–$80,000 Support Test
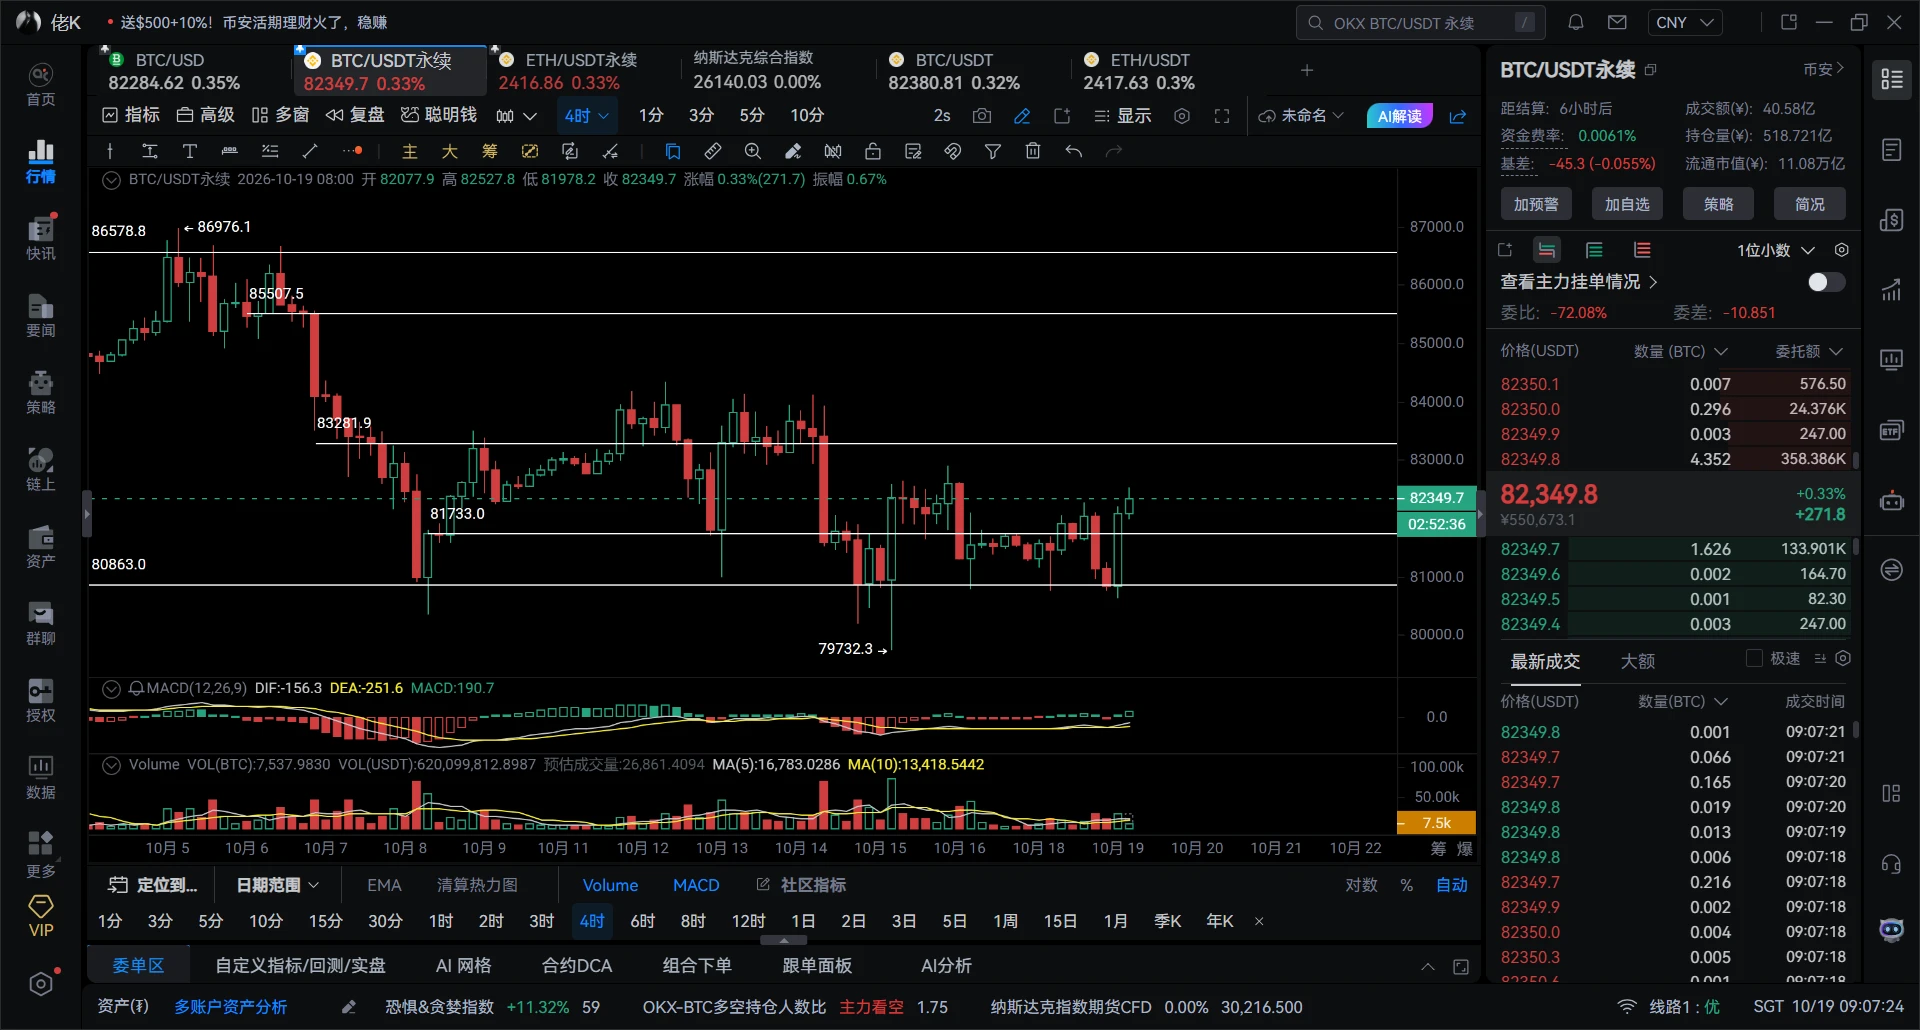
At approximately $81,570, Bitcoin is close to an important psychological area. The $81,000 region deserves attention as a near-term reference, while $80,000 is the next major round-number level traders may monitor if selling pressure resumes.
A sustained recovery above $82,000, supported by stronger spot volume and improving market breadth, would help repair the short-term structure. If BTC repeatedly fails to reclaim that level, sellers may retain control and the market could revisit lower support.
A break below $80,000 would increase downside risk, but it would not automatically establish a prolonged bearish trend. Confirmation would require examining subsequent price acceptance, trading volume, and whether buyers defend the breakdown area.
These levels are technical reference points, not guaranteed turning points.
Liquidations and Leverage: The Hidden Risk
During sharp declines, leveraged long positions can face liquidation as collateral becomes insufficient. Forced selling can amplify downward momentum, creating a feedback loop in which falling prices trigger further position closures.
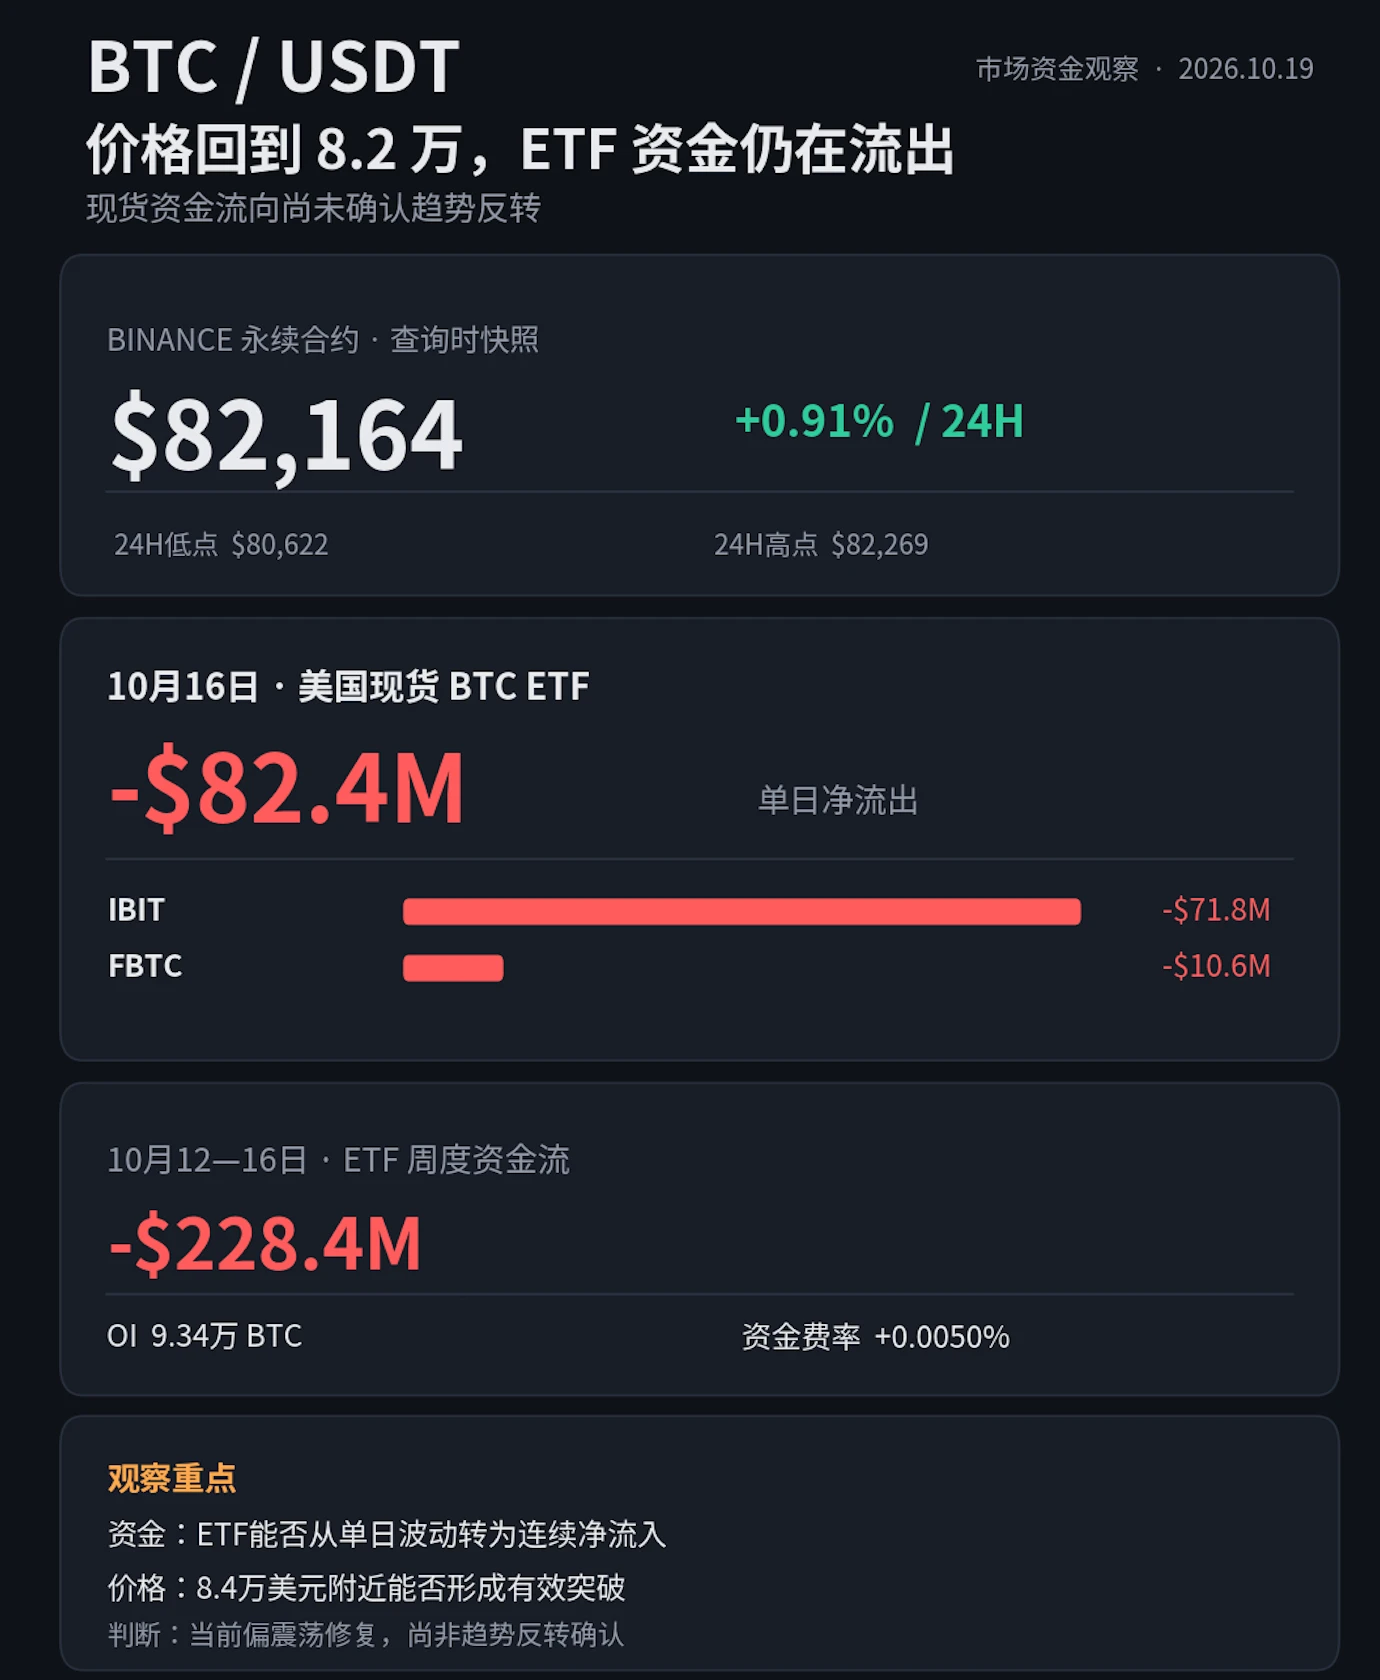
Open interest helps distinguish between different forms of selling pressure. If BTC declines while open interest contracts sharply, traders may be closing positions or being liquidated. If open interest rises during the decline, new positions may be entering the market, although the direction of those positions cannot be established from open interest alone.
Funding rates provide additional context. Persistently positive funding during weakening price action may indicate that long exposure remains crowded. A reduction in funding and leverage could help stabilize market conditions, but it would not independently confirm a bottom.
Is the CPI Shock Already Priced In?
Markets often react to the difference between expectations and actual data, not simply to whether a headline looks positive or negative. Some of the inflation risk may already be reflected in Bitcoin’s decline, but that cannot be established from price alone.
If Treasury yields stabilize, the dollar loses momentum, and BTC reclaims $82,000 with credible spot demand, the market could begin recovering from the initial shock. If inflation concerns intensify and leveraged positions continue unwinding, $80,000 may come into focus instead.
The most important signal is confirmation across macroeconomic conditions, spot activity, and derivatives positioning.
At $81,570, Bitcoin is at a decision point rather than a confirmed bottom. Preserving capital, controlling leverage, and waiting for price confirmation are more defensible approaches than assuming either an immediate rebound or an inevitable breakdown.