Square
Following
Hot
News
Profile
Share your thoughts
placeholder
Article
Live trading - Analysis new crypto coin
live-cover
LIVE2,091
$GT ‌
Gate's derivatives trading data for September highlights the platform's growing momentum in this sector. Monthly derivatives trading volume reached $396.4 billion—a 38.2% increase from the previous month—marking the fastest growth rate among major exchanges.
This surge in volume has also translated into an expanded market share for Gate. The platform’s share of the derivatives market rose by 1.64 percentage points to reach 10.1%, securing it the third position in global rankings. This climb in the rankings reflects not only an increase in volume but also a highly competitive market posi
GT-0.38%
  • 2
  • 1
they're longing Celestia?
post-image
TIA+7.00%
🚨 This could be bad news for $BTC
! I believe Warsh's push to scale back forward guidance and the dot plot could create a new source of pressure for the cryptocurrency market. Without clear signals from the Federal Reserve, it will be harder for investors to predict future interest rates, making riskier assets less attractive during uncertain periods. WarshPushesToScaleBackForwardGuidanceAndDotPlotMy biggest concern is that interest rates could remain elevated for longer than the market expects. This would constrain liquidity and make it harder for Bitcoin, especially altcoins, to sustain a s
post-image
BTC+0.56%
Trade live on $POL
.Entry Price: 0.09446 - 0.09493Take Profit 1: 0.09928Take Profit 2: 0.10295Stop Loss: 0.09163POL bouncing off local MA support—ready to retest that 0.097 high!Support the idea here.Watching both $SIREN and $BTC this session.
post-image
BTC+0.56%
Market update
live-cover
LIVE298
first day calling on @Pumpfun
bullish tek!
post-image
Does a bullish moving-average alignment always mean you should chase long positions?
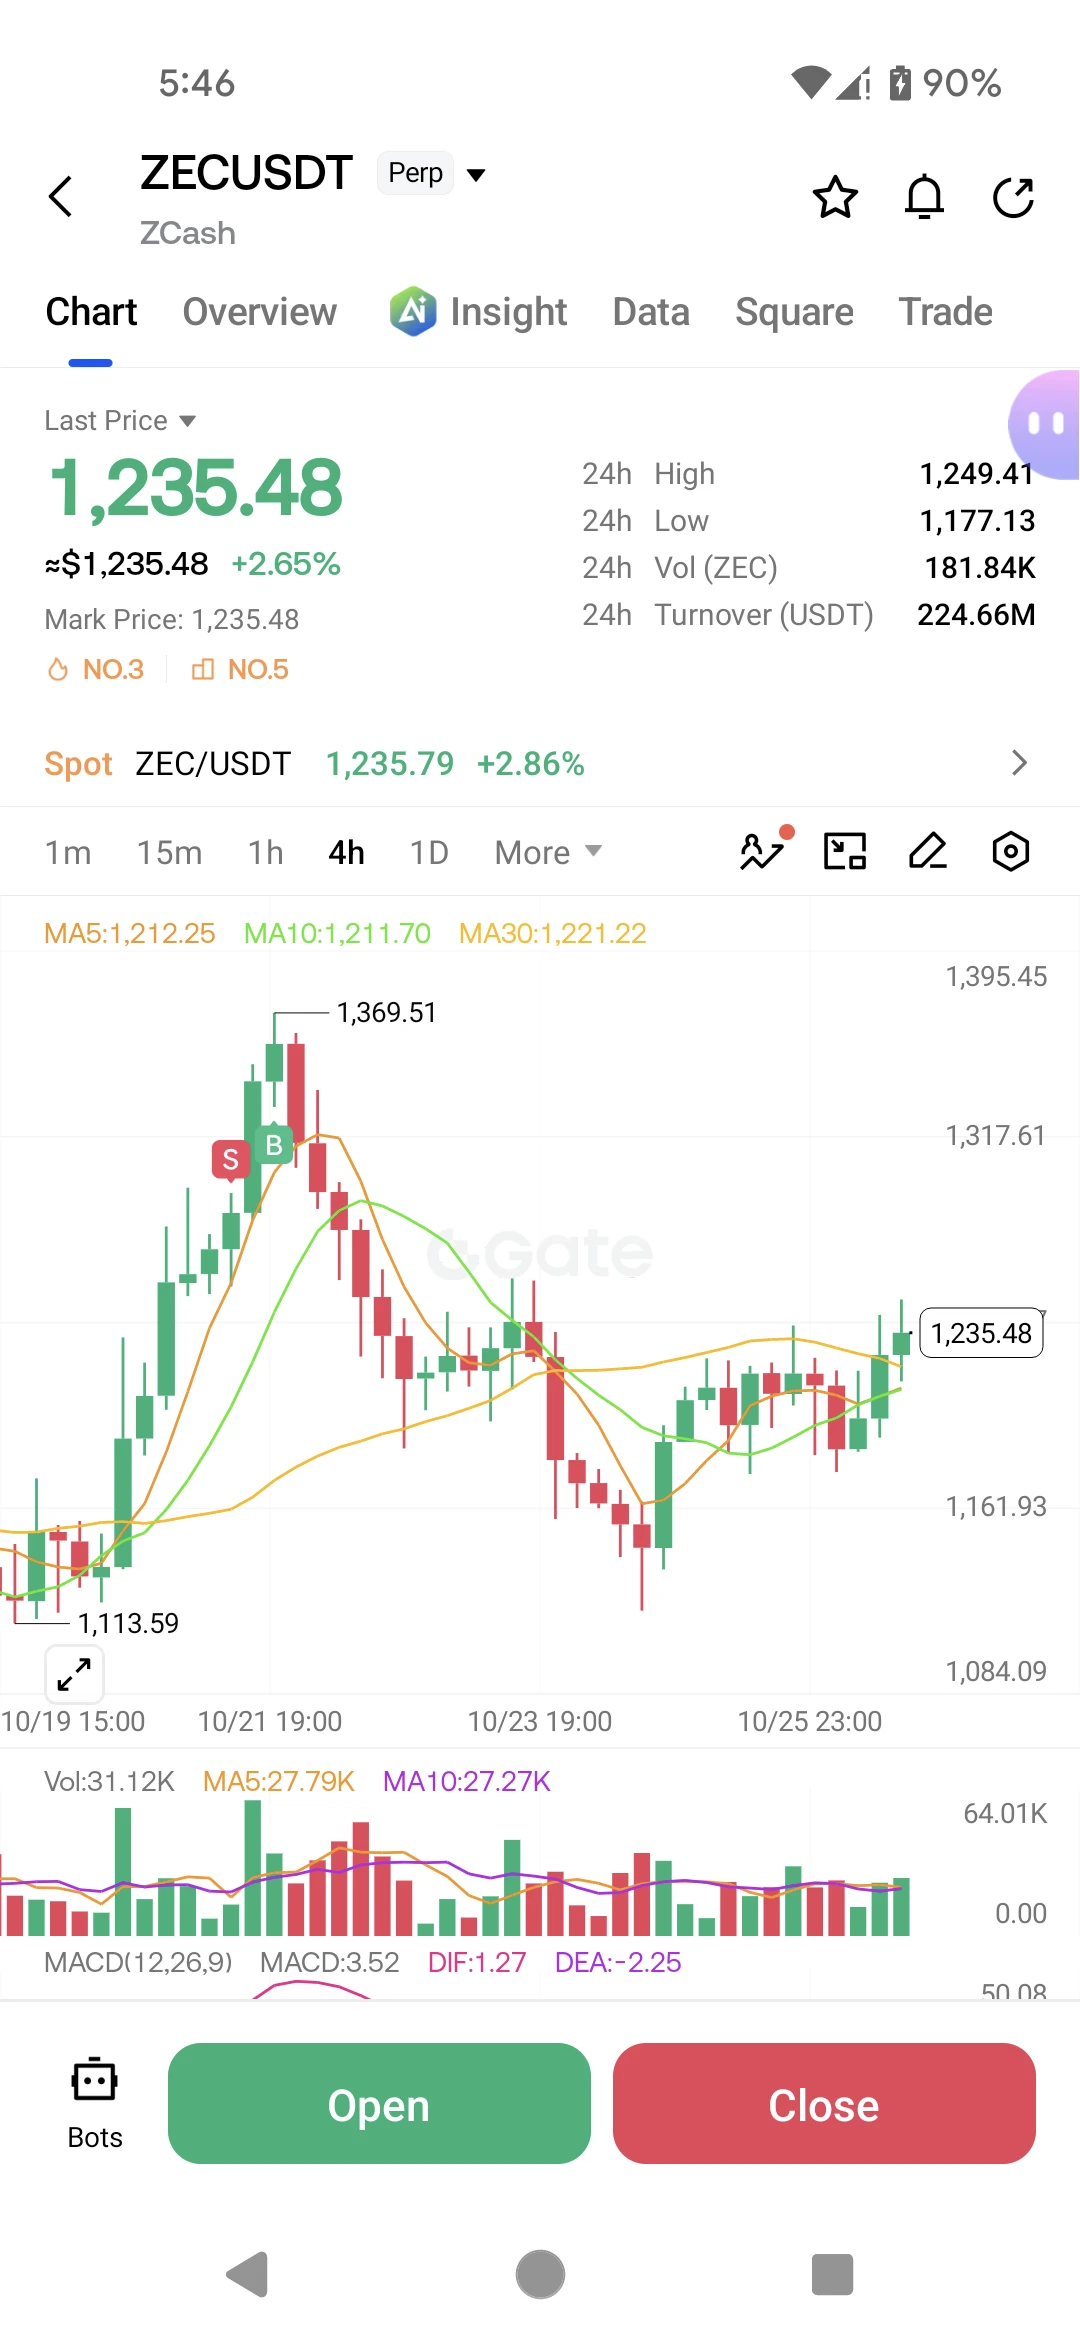
Not necessarily. The key is whether the price’s position relative to the moving averages is synchronized with momentum. Take $ZEC as an example: the current price is 1235.97, with MA5=1225.24 above MA20=1138.62, forming a standard bullish alignment and indicating a healthy trend direction; however, RSI has reached 70.2, nearing overbought territory, while the price is hugging the Bollinger upper band at 1248.36, making the risk-reward of chasing short-term highs unattractive. A reusable approach is: use movin
post-image
ZEC+7.64%
XPL+9.13%
INJ+11.20%
Which step is $CRCLB’s latest rally most likely to fool you on?
$CRCLB There is a very typical debate right now: one side uses +8.96% over 24 hours to prove the direction, while the other counters with key levels. I’m not taking sides based on the rise or fall for now, because $CRCLB remains strong, while the crowded positioning is already out in the open and has yet to provide a complete answer. I acknowledge that the trend is strong, but what matters next is not how much higher it can surge, but whether anyone steps in during the first pullback.
Laying out the chart, the current price is 86.
post-image
$NEAR PROTOCOL (NEAR) REJECTING MOVING AVERAGE RESISTANCE ARE BEARS TARGETING $4.5221 NEXT?
Pair: $NEAR /USDT
Direction: SHORT
Entry Price: 5.3804
Target Levels (Take Profit)
TP 1: 5.0585 5.98%
TP 2: 4.844 9.97%
TP 3: 4.5221 15.95%
Stop Loss
🛑 SL: 5.8095
Technical Breakdown
NEAR ($5.3802) faced strong rejection following an aggressive parabolic spike, printing a topping wick that stalled out right at structural resistance. This price action confirms persistent seller defense and sets up a clean continuation toward lower targets.
Price action tested areas above short-term moving ave
NEAR+11.86%
The Gulf countries are facing the worst of their times, it seems!
Qatar's revenue falls 42%, the worst in decades!
According to emir Sheikh Tamim bin Hamad Al Thani, the country's revenues fell 42% in the first half of 2026.
One of the factors, as per QatarEnergy's chief, is the damage to LNG facilities that resulted in a loss of 17% of Qatar's export capacity.
Do you think they will be able to recover from it?!
#copied
post-image
HYPERLIQUID $HYPE REJECTING MOVING AVERAGE RESISTANCE ARE BEARS TARGETING $78.06 NEXT?
Pair: $HYPE /USDT
Direction: SHORT
Entry Price: 81.62
Target Levels (Take Profit)
TP 1: 79.48 2.62%
TP 2: 78.06 4.36%
Stop Loss
SL: 84.47
Technical Breakdown
HYPE ($81.565) faced strong sell-side rejection following an impulsive upward push, printing a topping wick right at overhead structural resistance. This price action confirms persistent seller defense and sets up a clean continuation toward lower targets.
Price action tested areas above short-term moving averages before meeting heavy distribution
HYPE+0.79%
US economic data delivered a clear message: inflation is running hotter than expected, yet consumer demand and parts of the manufacturing sector remain surprisingly resilient.
🔹 This combination creates a difficult position for the Federal Reserve. After Wednesday's above-forecast CPI, today's producer-level data reinforced the case for rates staying higher for longer.
📊 The data on the table:
🔹 Core PPI: +0.7% MoM (forecast: +0.3%). The largest monthly increase since March 2022.
▪️ Headline PPI: +1.3% MoM (forecast: +0.6%), +6.3% YoY (forecast: +5.3%). The highest annual reading since Dece
post-image
User_any
✨ US equity futures traded mixed on October 15 as technology and AI-related stocks faced renewed pressure.
🔹 Futures tied to the tech-heavy Nasdaq 100 fell about 1.2%, while S&P 500 futures slipped 0.3%. Dow Jones Industrial Average futures held relatively firm, trading slightly positive. The divergence reflects a selective risk rotation rather than a uniform selloff.
📊 The data behind the market's sharp reaction:
🔹 Inflation pressures are broadening
▪️ US September PPI rose 1.3% month-over-month and 6.3% year-over-year, far exceeding the 5.3% forecast and marking the largest annual increase since December 2022.
▪️ Core PPI, excluding food and energy, rose 0.7% MoM and 5.0% YoY, also above expectations.
▪️ The September CPI report released a day earlier showed headline inflation accelerating to 3.7% YoY, with core CPI at 2.6%.
▪️ Energy prices surged 10.8%, accounting for over 80% of the goods price increase, with gasoline jumping 20.3%.
🔹 AI and semiconductor stocks face a reality check
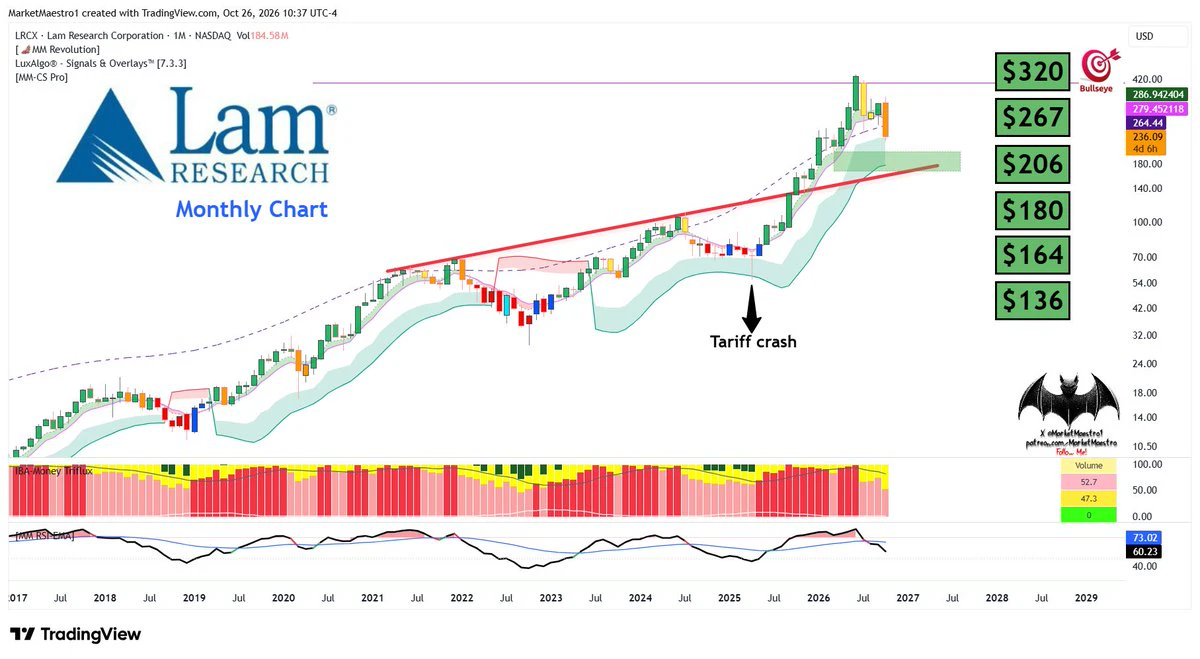
▪️ Memory chip names continued to slide, with Micron down about 4% and AMD falling roughly 3.5% premarket. CoreWeave dropped another 5% after plunging 15% on Wednesday.
▪️ Investor concerns focus on whether the massive capital expenditures required for AI data centers will generate sufficient returns, particularly as debt-financed expansion raises sustainability questions.
▪️ Reports of progress by China's CXMT on next-generation DRAM technology have also pressured memory stocks by raising competitive concerns.
🔹 TSMC's cautious 2027 guidance amplifies uncertainty
▪️ TSMC reported its sixth consecutive quarter of record profit, with net income up 69% YoY to NT$763.1 billion. It raised its 2026 revenue growth forecast to approximately 44%.
▪️ However, CEO C.C. Wei struck a cautious tone on 2027, citing macroeconomic uncertainties and rising component costs affecting price-sensitive end markets.
▪️ The cautious outlook, despite strong AI demand, reinforced concerns about future growth visibility across the semiconductor supply chain.
⚖️ Structural perspective:
🔹 From a long-term structural perspective, the current market dynamic reflects a recalibration of valuations rather than a deterioration in underlying industrial demand. TSMC's cautious 2027 planning is best understood as prudent expectation management amid macro uncertainty, not a signal of weakening AI fundamentals.
▪️ The transmission chain from energy costs to broader pricing is becoming clearer: crude oil → gasoline → transportation and warehousing services → wholesale and retail margins. This broadening inflation narrative keeps the Fed's restrictive policy path in focus, pressuring high-duration growth assets.
▪️ Meanwhile, capital is rotating defensively — into Treasuries and dividend-paying instruments — rather than exiting risk entirely. The 10-year Treasury yield dropped sharply to around 5.05%, a three-week low, reflecting strong safe-haven demand.
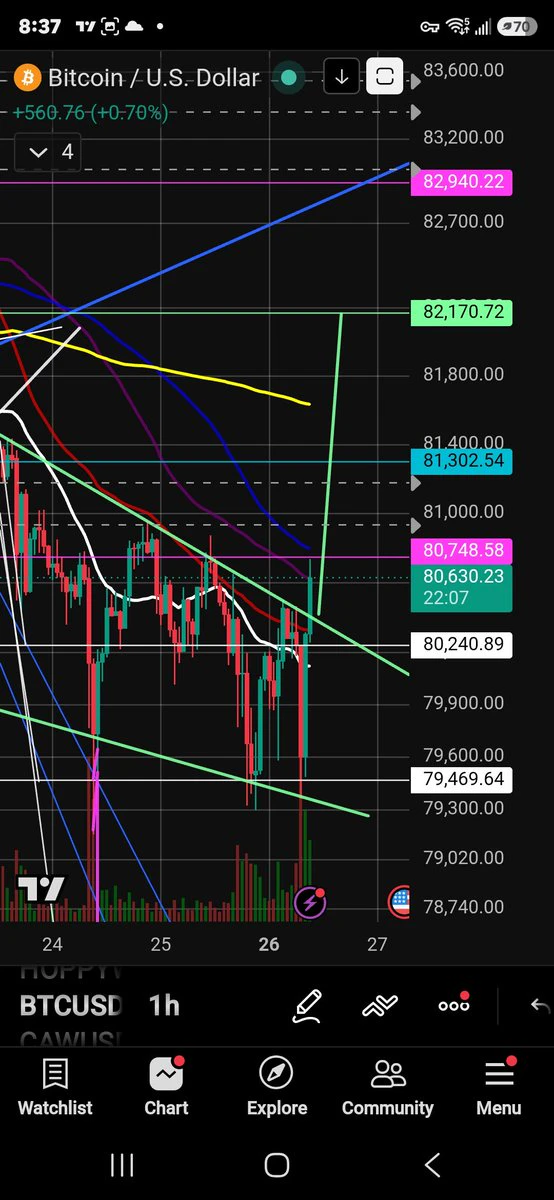
▪️ Bitcoin fell to near $80,500, down about 3.6% over 24 hours, with market-wide liquidations approaching $977 million, predominantly from long positions. The $80,000 level remains a critical support zone to watch.
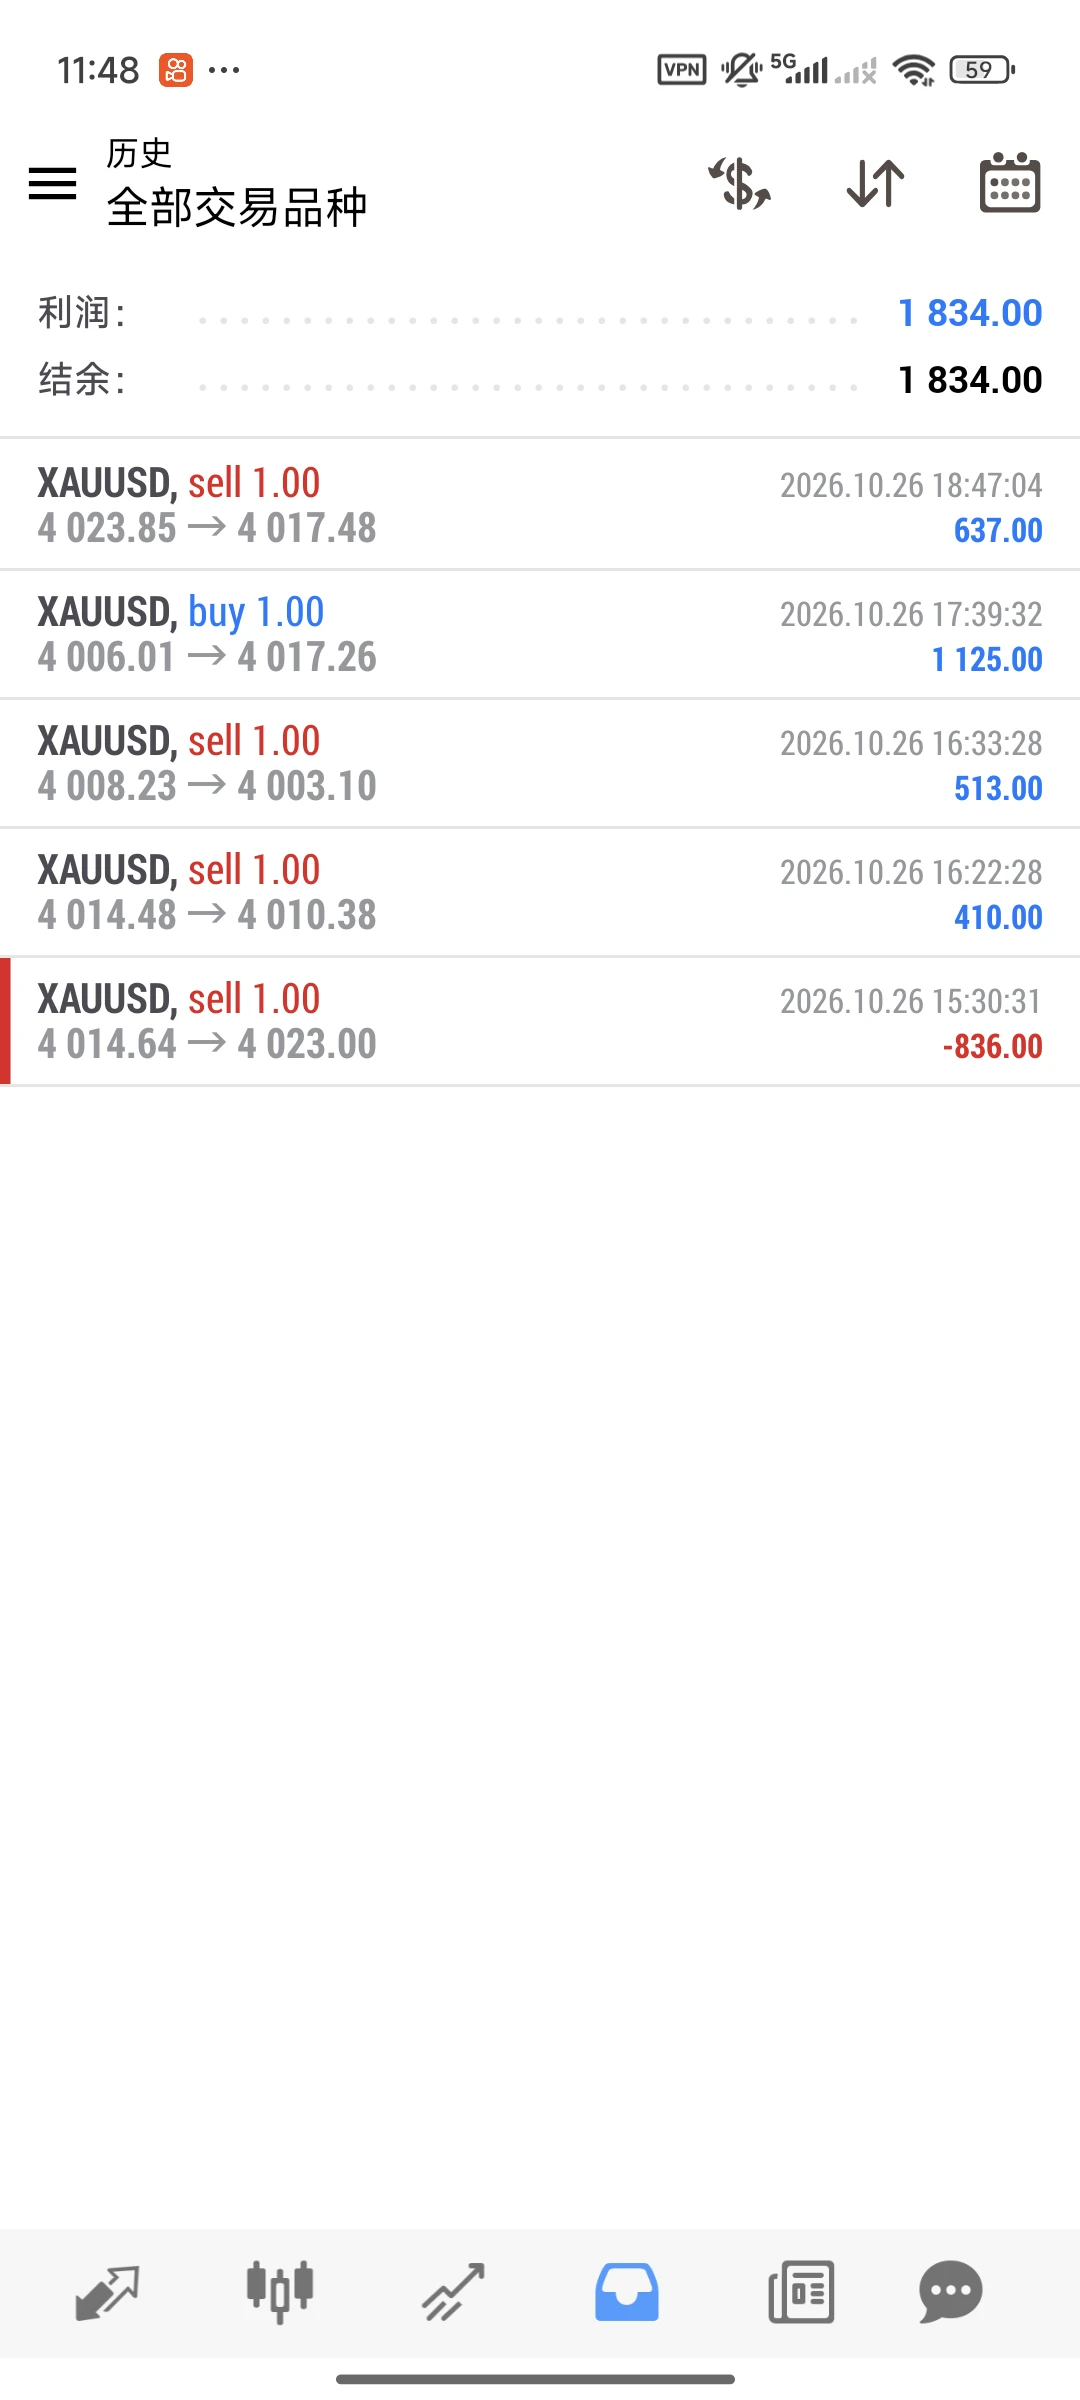
▪️ Gold recovered above $4,150, up over 1.3%, as falling yields and a softer dollar supported precious metals despite the hot inflation print.
▪️ The dollar index retreated from its 18-month high toward 102.0, giving back most of its post-CPI gains as rate-hike expectations eased slightly.
🔹 The key variable ahead is whether the Fed signals patience at its October 27-28 meeting or adopts a firmer tone. Markets currently price roughly a 49% probability of an October hike, up sharply from about 22% before the CPI data. Until that guidance arrives, markets are likely to remain in a selective recalibration phase.
💬 When inflation pressures broaden beyond energy and AI valuations face scrutiny, do you prioritize defensive positioning or long-term structural exposure? 👇
#USStocks #Inflation #USSeptemberPPIBeatsExpectations
#美国9月PPI大超预期 #USSeptemberCPITopsEstimates
Not financial advice.
repost-content-media
BTC+0.56%
ETH+1.35%
XAU+1.63%
XAG+3.23%
XRP+1.26%
  • 1
  • 2
🚀 GT/USDT Technical Insights: Is GateToken Preparing for a Bullish Reversal at $10.00 Support?
Pair: GT/USDT (Spot)
Current Price: ~$10.42
24h Range: $10.00 – $10.45
24h Volume: ~67.70K GT (~$691.81K turnover)
📊 1. Key Technical Breakdown Across Timeframes
1-Hour Chart (Short-Term Recovery):
GT tested strong psychological support around $10.00 before staging a clean V-shaped rebound back above $10.40.
Short-term EMAs (EMA5 at 10.38 and EMA10 at 10.33) are sloping upward, crossing above the short-term Moving Averages, signaling early bullish momentum in micro-timeframes.
MACD has fli
GT-0.38%
  • 2
$ZEC Preparing to short, stop-loss at 1280-1300
post-image
ZEC+8.12%
  • 4
ETH is showing a weak recovery after being oversold. After dipping to an overnight low of 2402, it began a technical rebound, reaching around 2463 intraday before encountering resistance and retreating. It is currently trading at 2449. Compared with BTC’s large-cap market-weighting characteristics, ETH is more sensitive to overall risk appetite in the crypto market. Continued capital outflows from the altcoin sector, coupled with declining on-chain activity, have left its rebound momentum clearly insufficient, and the bear-dominated structure has not materially changed.

On the daily timefram
post-image
ETH+1.36%
BTC+0.56%
I make about $29k a month with options.
NO Day trading
NO Swing trading
NO Covered calls
NO Cash secured puts
NO BS
INSTEAD, I DO THIS:
Build base portfolio
Sell portfolio secured puts (not cash secured)
Buy LEAPS with the premium from sold puts
BUY shares with the premium from sold puts
Keep ratios in check
I can explain it to a 13 year old & I will likely outperform 95% of people that read this.
Simple wins.
post-image
Retail investor: Oil’s back over $100 & they’re hitting tankers in Hormuz again. I’m thinking about going to cash till it calms down
Me: When does it calm down?
Retail investor: idk... when the war’s over?
Me: Brent oil hit around $118 back in March when the strait shut down. Everybody was saying exactly what you’re saying...
Retail investor: & what happened?
Me: Nasdaq made a new all time high a few weeks later and now up over 30% from that point.
Retail investor: with all this still going on??
Me: Yep. The market doesn’t wait for the all clear. It moves as soon as it figures out earnings are
post-image
BZ-0.25%
NDAQ+1.57%
$ICNT
UPDATE
#ICNT is getting a good volume here. In this move we can see 80%+ gain here ✍🏻
#ICNTUSDT #ICNTBTC #BTC #Bitcoin #NFTs
post-image
ICNT+20.93%
BTC+0.56%
Why is big money watching the PPI rather than the CPI?
CPI is a statement of fact (what people have already overpaid for in stores). PPI is a look into the future (what costs businesses are bearing now). If raw materials and production become more expensive, producers will inevitably pass these costs on to end consumers within 1–2 months.
Conclusion: High PPI today guarantees high CPI tomorrow. Major players reduce risks based specifically on PPI, without waiting for consumer reports.
#USCPISoon #ShareWeekly
Load More

Join 40 M users in our growing community

⚡️ Join 40 M users in the crypto craze discussion

💬 Engage with your favorite top creators

👍 See what interests you

Trending Topics

USSeptemberPPIBeatsExpectations

91.35k Views1.87k Discussing

US September PPI came in at 6.3% YoY, well above the 5.3% market expectation, pointing to renewed producer-side inflation pressure. Weekly jobless claims were 199K, broadly in line with forecasts. Could hotter inflation further reduce room for rate cuts, and what does it mean for $BTC, US stocks, and gold?

DrLinHanSpeaksAtOxfordUnion

135.63k Views1.86k Discussing

JapanAndKoreaStocksPlunge

47.27k Views1.76k Discussing

View More