Square
Following
Hot
News
Notifications
Profile
Share your thoughts
placeholder
Article
💰 Your stock insights deserve rewards—and to be seen
What signals do you look for when you’re bullish on a company? What concerns make you decide to keep waiting?

Join Gate Square’s stock discussion season to share your views and the reasoning behind them.
🌟 Each day, 3 quality creators will be selected to receive 5 USDT each, plus official featured placement to help more people see their valuable content.

Selection isn’t based on correctly predicting price movements or the number of posts. Well-supported opinions, valuable observations, and thoughtful reviews all have a chance to be selec
post-image
  • 5
  • 2
People with no artistic bone in their body won’t see this video in their feed.
Trenches
ZIG
Z
bade
b
ZIG
0x8c...1145
Market Cap
$.
Change
.
24h Vol
$.
Holders
.
BTC
B
bade
b
BTC
C5xp...pump
Market Cap
$.
Change
.
24h Vol
$.
Holders
.
STONK
S
bade
b
STONK
6GmA...UNgx
Market Cap
$.
Change
.
24h Vol
$.
Holders
.
DESSA
D
bade
b
DESSA
npz2...pump
Market Cap
$.
Change
.
24h Vol
$.
Holders
Diamond
D
bade
b
Diamond
5VCE...pump
Market Cap
$.
Change
.
24h Vol
$.
Holders
.
$PI Xiaopaipai took 2 Viagra pills and was relatively erect and firm.
post-image
PI-0.60%
$AIN At this point, the people I’ve let down the most are my family
AIN+3.85%
  • 4
$DKNG Down 21.59% in one day, from 23.71 straight to 17.2. This isn’t a pullback; someone’s throwing tokens out the window. Trading volume was only 5.6M, and liquidity was as thin as the broth at a convenience-store oden counter. It didn’t take much effort for sellers to push the price down.
Think of it this way: it’s like the bubble tea shop at the entrance to your neighborhood, which normally sells 200 cups a day. Today, someone suddenly says the owner has run off, and by midday they’ve sold only 30 cups, so prices are slashed by 30%. But the shop is still there, and the tapioca pearls are s
DKNG+1.74%
  • 10
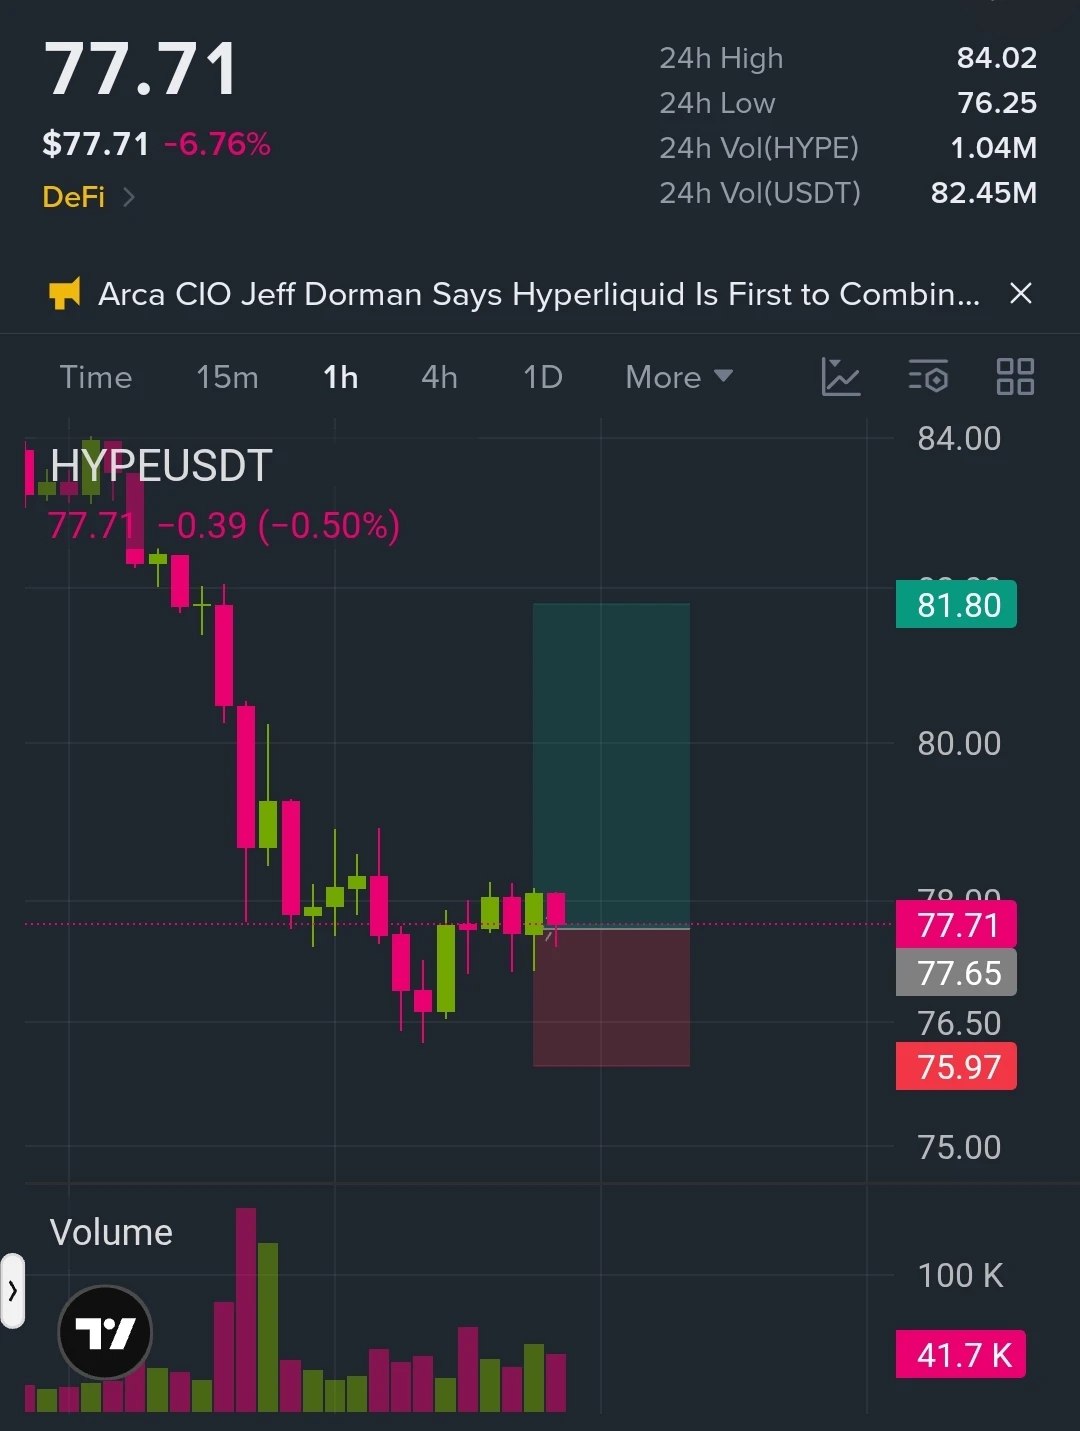
I'm watching a potential BIG LONG on $HYPE ‌
TP: $79.00 / $80.00 / $81.80

SL: $75.97

You know what caught my attention?

After a sharp decline from $84, HYPE found buyers around $76.50 and started stabilizing. Sellers pushed price lower, but the recent candles are showing signs of consolidation rather than uninterrupted selling $HYPE

The market may be building a short-term base. If buyers reclaim $78.50–$79.00, trapped short positions could provide additional fuel for a recovery toward $80 and $81.80.

The important level is $76.50.

If buyers defend this support, the next liquidity targe
post-image
HYPE+0.24%
$RAM 's -23.87% move slapped me in the face. The day before yesterday, I watched it surge to 6.68 and got carried away, chasing it at 6.2, thinking “I’ll add more if it breaks above the previous high.” Instead, it tanked right after I bought, dropping as low as 4.51. For those two hours, my heart was racing harder than the candlesticks.
The lesson is simple: with a market doing only 11.5M in trading volume, pumps and dumps happen in an instant. Applying large-cap “breakout logic” to a small-cap coin was just asking to get rekt. At the current price of 5.04, my plan is not to average down. I’ll
RAM+0.63%
  • 3
[New Streamer] Market Prediction
live-cover
LIVE1,679
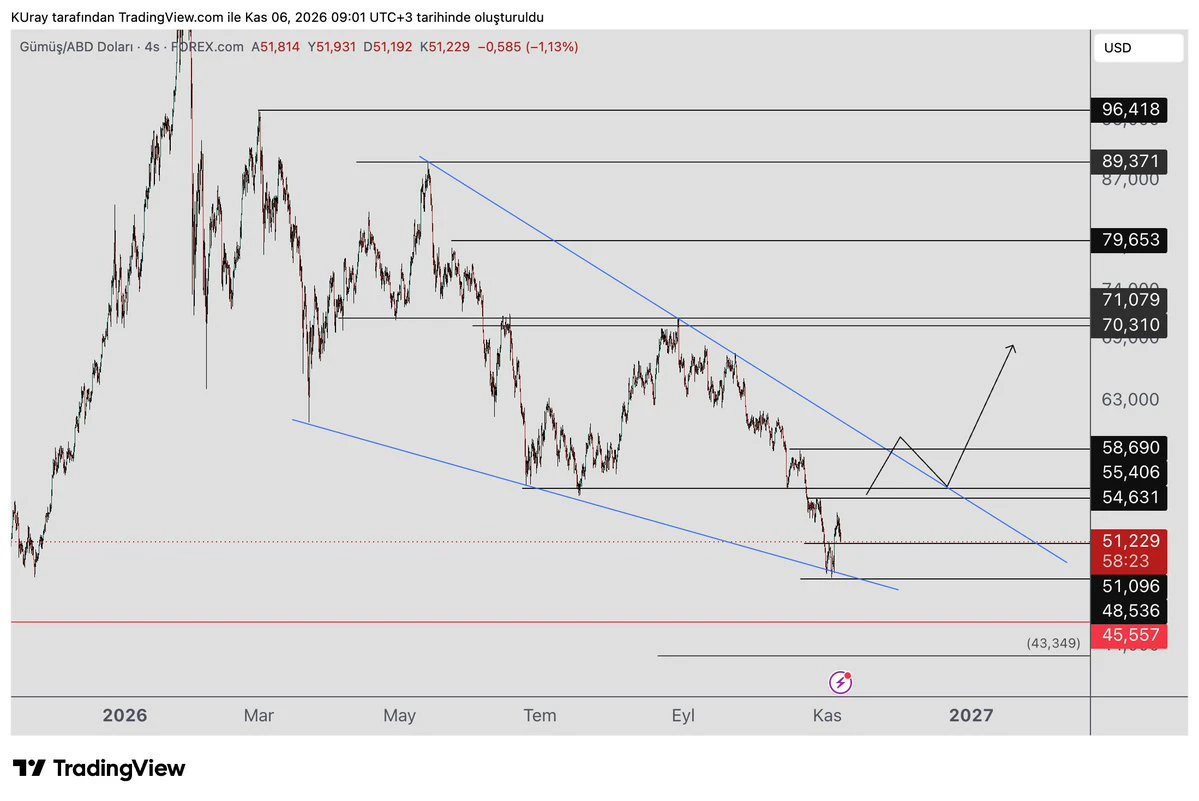
We are tracking the falling wedge forming in #xag #Gümüş . As long as it holds the 48.5 low, the wedge may still play out.
It broke through 51 resistance with volume and is now coming back to test the resistance it broke. The broken resistance may act as support. After the retest, it could rise toward 54-55 resistance.
If there is no close above the 54-55 zone, the decline could resume, indicating that the rise was a reaction to the downtrend.
If it closes above the 54-55 zone, the rise is expected to continue further.
After that, we will watch the 59 level. If it closes above, the upper edge
post-image
XAG+0.47%
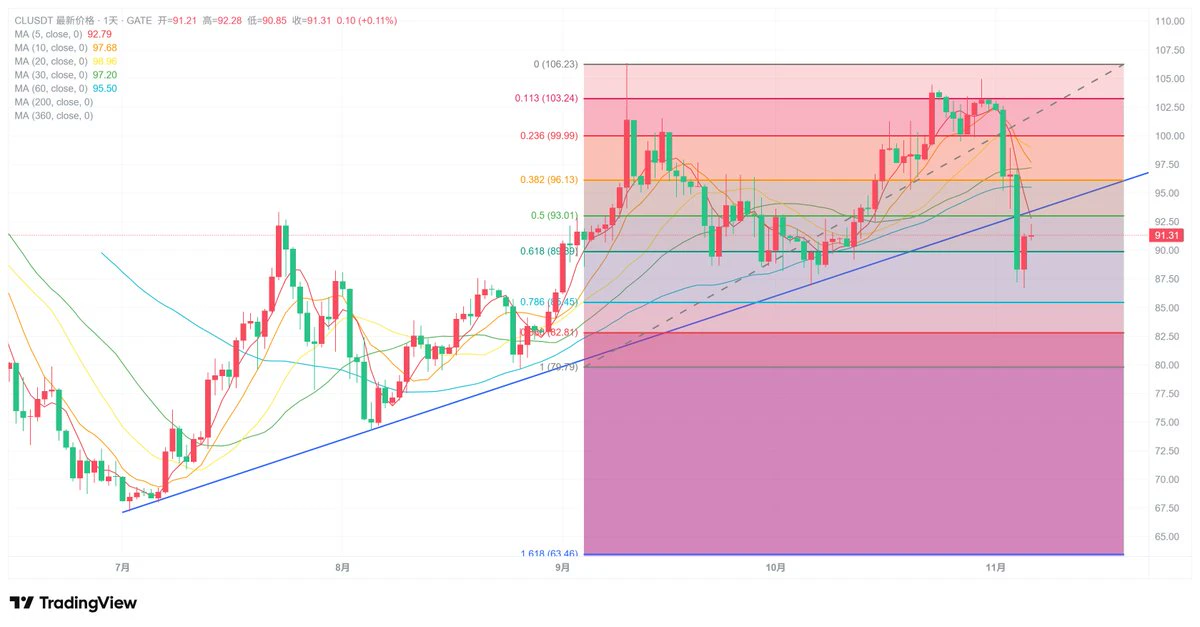
Scumbag Watch: CL, Update 11.6
U.S. stocks plunged yesterday, but the scumbag’s CL long position turned out to be a safe haven.
Of course, the scumbag still plans to close out around 94.
post-image
CL-1.83%
BTC Market Cycle Analysis: How to Identify the Different Stages of Bull and Bear Markets?

In the BTC market, many investors are accustomed to judging market conditions based on short-term price movements, while overlooking a more important question: Which stage of the market cycle are we currently in? Understanding market cycles can help traders develop better strategies instead of using the same trading approach at every stage.

First, the accumulation phase. After a downturn, prices gradually stabilize, market interest is low, and trading volume may be relatively subdued. This phase is usua
post-image
BTC-0.67%
Bitcoin crashed—$ZEC but ZEC didn’t! On a night of macro carnage, who’s secretly shutting off the shorts’ escape route?

A market crash is a true test: weak hands fall with the market, while the major players hold firm.

My take: Macro factors are indeed driving the sell-off. BTC plunged to $75k overnight, wiping out $1.2 billion in long positions as risk appetite shrank across the board. But ZEC held firm today. The reason isn’t in the charts, but on the supply side: the NU7 upgrade just activated, cutting the block subsidy to one-third. 12k ZEC in the Sprout pool were locked up outright, fu
ZEC+1.29%
  • 4
📡 Signal card | BTCSOS just captured
Speaking of which, I only reposted 舒琴实盘’s $BTC order earlier today, and here comes another one 😂
Channel: 舒琴实盘Direction: $BTC Short entry: 83900Target: 82900 / 81900 / 80800Stop loss: 85000
I’m only reposting this; whether to follow and how much to invest is up to you, babes. You’re responsible for your own risk.
Personal record shared for reference only; this is not investment advice. #pepe
BTC-0.65%
PEPE+0.97%
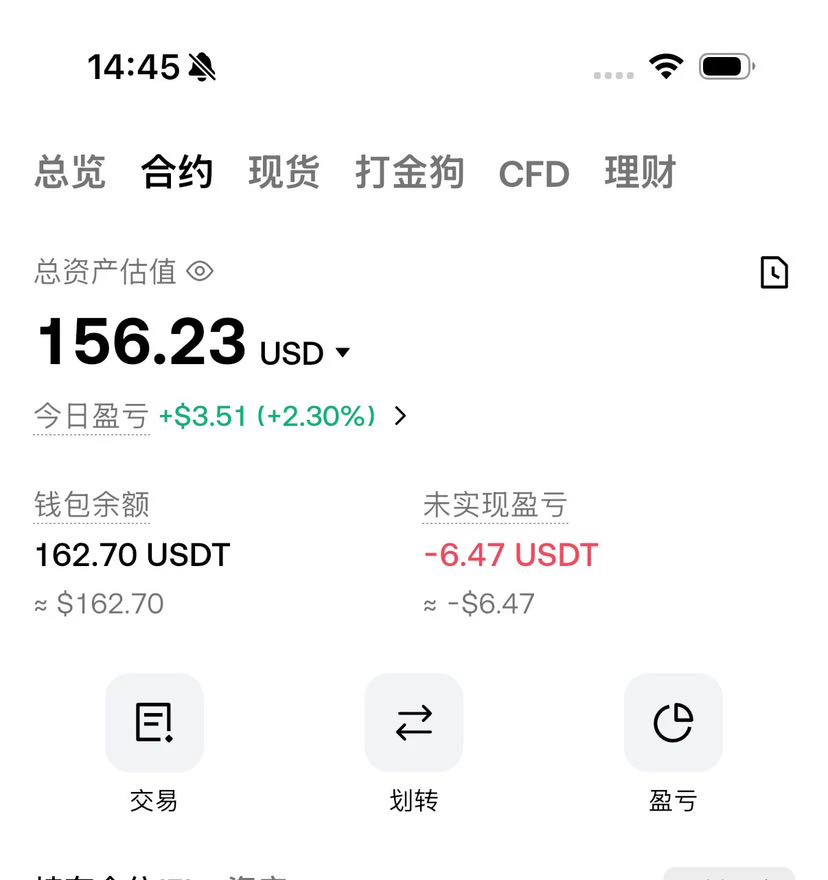
Guys, today is day 85 of making a living through trading, and my futures account currently has 156.2U
What I need to do now
is quietly watch the market do its thing
post-image
MARKET UPDATE
live-cover
LIVE1,784
#USStocksFaceHistoricSelloff
Hunting for a Reversal in the SOXL Crash .
$SOXL ‌

The chart tells a dramatic story. SOXL, a 3x leveraged semiconductor ETF, has experienced a catastrophic drop, plummeting -38.19% to trade at $40.93. The price has sliced through the Bollinger Bands and moving averages like a hot knife through butter, driven by headline fears (as noted: "AI buildout fears hit chip stocks").

When an asset falls this violently, panic selling is common. However, for the technical trader, a massive sell-off often sets the stage for a sharp, equally violent bounce. The Gartley Patt
SOXL-38.25%
  • 16
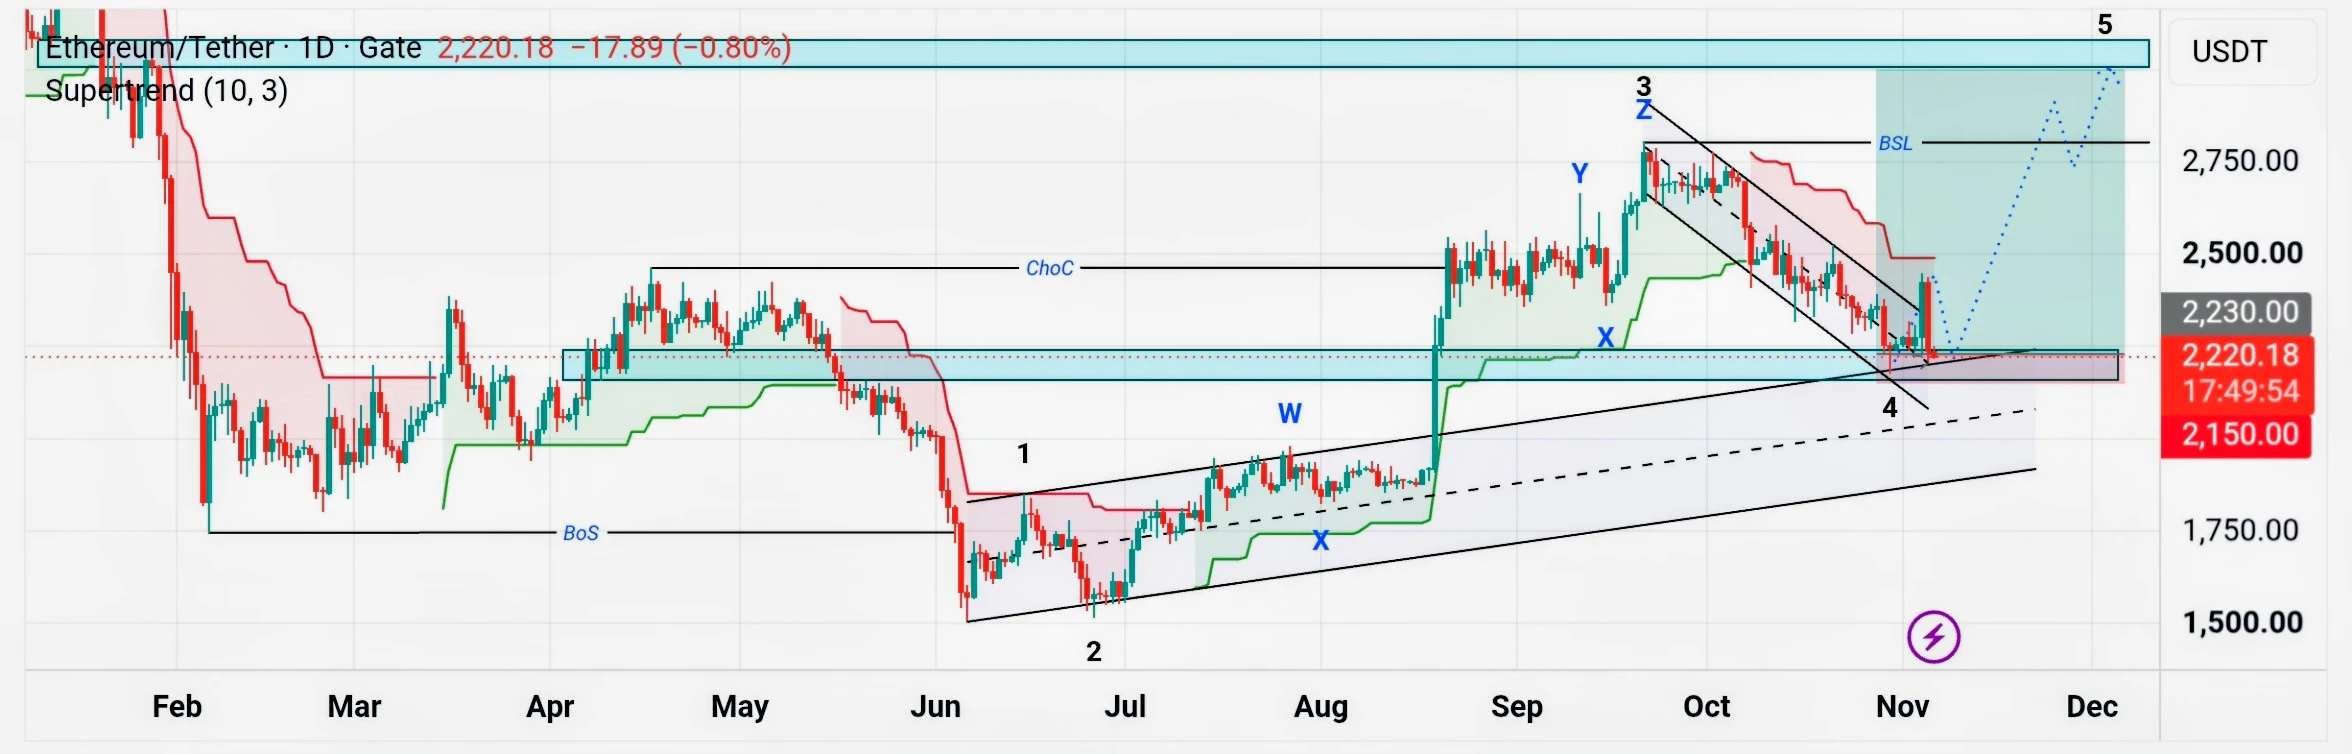
$ETH ‌-After the price broke out of the wave 4 channel shown in the chart, it immediately reversed back inside. Interpreting the price action this way, it could potentially be the formation of a micro wave 2, setting up for a bullish wave 5.
-Those with a bearish outlook might view this as a "false break."
-Therefore, using the most recent low (wave 4) as an invalidation level is a prudent risk management step for any long positions.
post-image
ETH-1.26%
Retail traders watch indicators, major players watch sentiment, and top traders watch market structure. Many people laugh at “naked charts” for being too simple, but they don’t realize that behind the simplest Pinbar pattern lies the critical weakness in the shift between bulls and bears. Combined with the CMAD indicator confluence I use,
every precise entry is a pinpoint strike at market sentiment.
I don’t need to draw hundreds of lines to prove myself. True expertise is often simple yet deadly.

Let’s see how this real live trade achieved 100x
#美股史诗级抛售 #Gate首创资金安全证明 #btc
post-image
BTC-0.65%
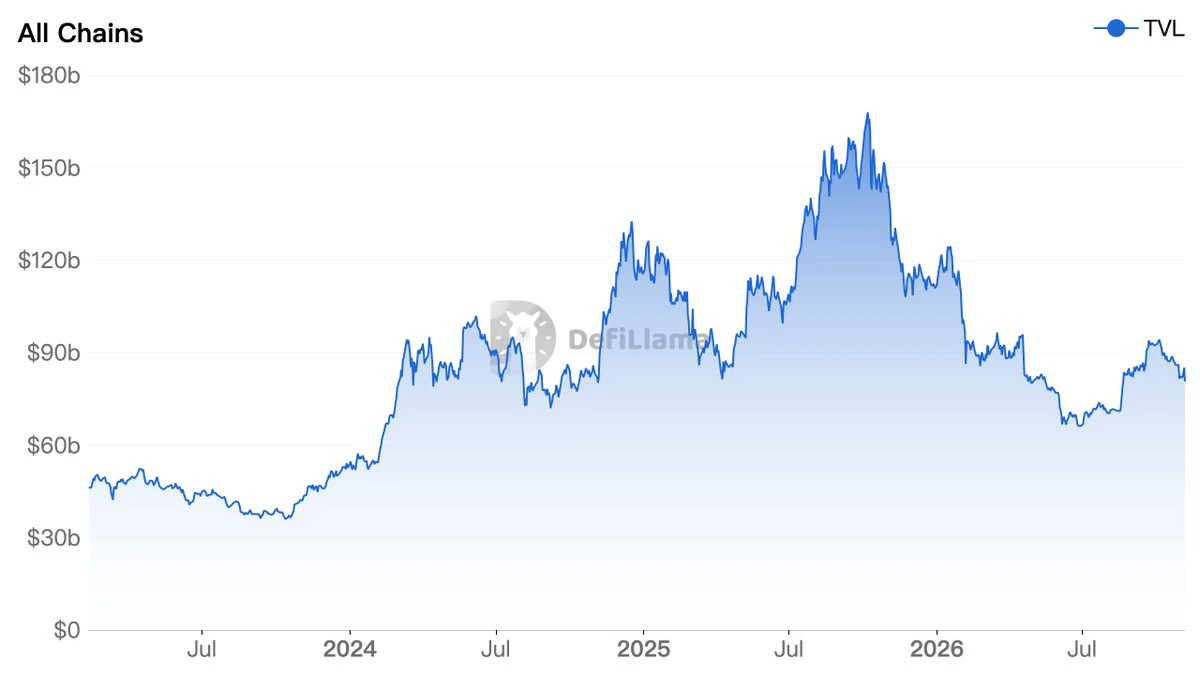
Honestly, I wasn't this pessimistic when ETH was at $1,500. Now total DeFi TVL has already halved from its 2025 peak of $160 billion to $80 billion. I can only draw one conclusion: altcoins are dead
post-image
ETH-1.26%
Load More

Join 40 M users in our growing community

⚡️ Join 40 M users in the crypto craze discussion

💬 Engage with your favorite top creators

👍 See what interests you

Trending Topics

USStocksFaceHistoricSelloff

3.32k Views3.6k Discussing

U.S. stocks suffered a sharp selloff on Thursday, with the Nasdaq closing down more than 5% and the Philadelphia Semiconductor Index falling over 12%. AI and chip stocks including $NVDA and $AMD were hit especially hard. Markets are reassessing AI valuations, data-center spending and future returns. Is this just short-term deleveraging, or the start of a deeper correction in the AI trade? Which sectors are you watching next?

GateLaunchesPoSECProofOfSecurity

13.75k Views580 Discussing

USNonfarmPayrolls

11.98k Views4.03k Discussing

View More