Share your thoughts
placeholder
Article
This long trade was actually rather uncomfortable. Right after entering, I got hit by a false-breakout wick, which nearly swept my stop-loss at a key level. I didn’t cut the position at that level because volume hadn’t expanded; instead, it looked more like a shakeout. The chart then saw a series of consecutive small bullish candles, and the battle between bulls and bears quickly shifted in favor of the bulls. When the price reached around 1282.02, I took profit on 70% of the position and moved the stop-loss on the remaining position above breakeven. The profit is currently at +710.41%, and th
post-image
BTC+0.27%
BNB-2.59%
$NAORIS Signal】Long + End of High-Level Consolidation
$NAORIS 4H is pushing upward along the upper Bollinger Band at 0.0397, while RSI is flattening at a high level of 84.8. 1H MACD momentum is contracting, and the price has not broken down. Order book depth imbalance is -7.04%, with sell-side orders slightly thicker. The funding rate is 0.0323%, long/short positioning interest is stable, and OI is steady. There is a short stop-loss zone near 0.0405 above; a breakout could easily trigger cascading buy orders. The current price is at the end of a 15-minute consolidation.
🎯Direction: Long
⚡Ent
post-image
NAORIS+29.56%
BTC+0.29%
ETH+1.09%
SOL+2.41%
I originally wanted to cut my losses as a sacrifice to the heavens, but the sacrifice never happened—the meat cooked itself. A few afternoons ago, I was still watching $BNB bottom out. Buying pressure was clearly strengthening, and the bottom structure was becoming increasingly solid. I said at the time that this was a position worth taking a chance on, so I opened a long. Entry price: 641.25; current price: 751.35. I’ve taken 80% off the table, leaving the rest to run. All that waiting wasn’t for nothing, folks—those who bought the dip this time should be waking up smiling. In terms of execu
post-image
BNB-2.59%
SNDK+1.12%
SOL+2.40%
Beginner Trader - Real Account Live
live-cover
LIVE47
$ARB Signal】1H pullback to EMA20 + 4H bullish continuation
$ARB 1H pullback to EMA20, current price 0.18475; the 4H MACD histogram at 0.0032 is narrowing. Order book imbalance is -4.41%, 1H RSI 55.35 is neutral, funding rate is 0.0065%, OI is stable, and short-term leverage is not crowded. The 1H MACD negative histogram is contracting, with price consolidating between 0.1805-0.1850.
🎯Direction: Long
⚡Entry/Limit Order: 0.1841957 - 0.1847500
🛑Stop Loss: 0.1755125
🚀Target 1: 0.1986063
🚀Target 2: 0.2055344
🛡️Trade Management:
- Execution Strategy: After reaching Target 1, reduce the positio
ARB+4.20%
This $PONS long position has been quite a grind. There was one downward spike in the middle that swept out quite a few short chasers, coming just a few points away from my protective level. I did not manually cut the position at the time because the four-hour structure had not broken down.
I entered based on a double bottom on the hourly chart. After the right-side breakout, the price pulled back to the prior high neckline and stabilized. Once confirmed, I went long with the trend. The entry was not particularly cheap, but the stop-loss was very close, making it a case of using limited risk to
post-image
PONS-11.63%
BTC+0.27%
SOL+2.40%
This return has me feeling nervous, worried the market might come to its senses tomorrow and blacklist me.
With the screen glowing green, $SNXX consolidated around 13.489. No matter how I looked at it, it seemed ready to break down. But I noticed that every dip was met with buyers, while volume was quietly cooperating; it was moving sideways at the bottom without breaking down—this structure wasn’t bearish, so I should be watching for longs instead. Once the market stabilized a little, I opened a long.
I didn’t expect it to surge straight to the current 18.223, with unrealized gains of +1693.
post-image
SNXX+2.53%
ETH+1.06%
LAB-3.96%
My hand trembled when I set the stop-loss a few days ago, only to realize this morning that the filial piety was unnecessary. 😌

As the market repeatedly swung intraday, the price kept grinding around 91.82, with the volume shrinking more and more noticeably. Someone stepped in to buy every dip. I watched it for half a day; this kind of level is more of an opportunity than a panic signal, so I cautiously took a shot.

The price has now climbed to 104.92, giving a floating profit of +687.56%. We caught the rhythm of this move perfectly, and everyone is feeling great.

Don't lose your patien
post-image
ADA+0.77%
ZEC+19.99%
$PEPE Getting Ready To Send It! 🚀
Just dropped $2,783 in on a long position.
$PEPE Near To Mid-Term Targets 🎯
1) $0.000004011
2) $0.000006226
Lets go make some money! 💰
NFA, DYOR ⚠️
#Crypto #Trading #PEPE
post-image
PEPE-0.11%
This kind of return makes me nervous, fearing the market will come to its senses tomorrow and blacklist me lol 🔥 This move was purely the market doing well on its own. A few days ago, I was still reviewing the market before bed, $SOL and the rebound that afternoon a few days ago really had something to it: every time the price surged, someone was there to buy, and the trading volume was also more genuine than before. Anyway, I gave all the warnings I needed to give and simply held the 84.84 level without moving.
When I woke up and checked my phone, wow—105.91 had practically delivered the or
post-image
SOL+2.40%
BTC+0.27%
LAB-3.96%
Keep holding, and be a bit more determined. By the way, if you’ve already reduced your position, hitting the stop-loss still means a profit.
I was just about to go to the forum and rant, but then I saw my balance and thought, forget it—the market is always right. 😂
A few days ago, it was still barely holding on before bed. Every rebound seemed to lack that final push, while volume quietly shrank. At a level like this, not opening a short position would have been hard to justify. Entry reference: 0.17647. When I opened the chart this morning, the price had plunged straight to 0.04593, and the short position was already showing +1457.07% unrealized profit. This profit feels great. 🔥
Take profits steadily; don't get greedy for the l
post-image
SOL+2.40%
LAB-3.96%
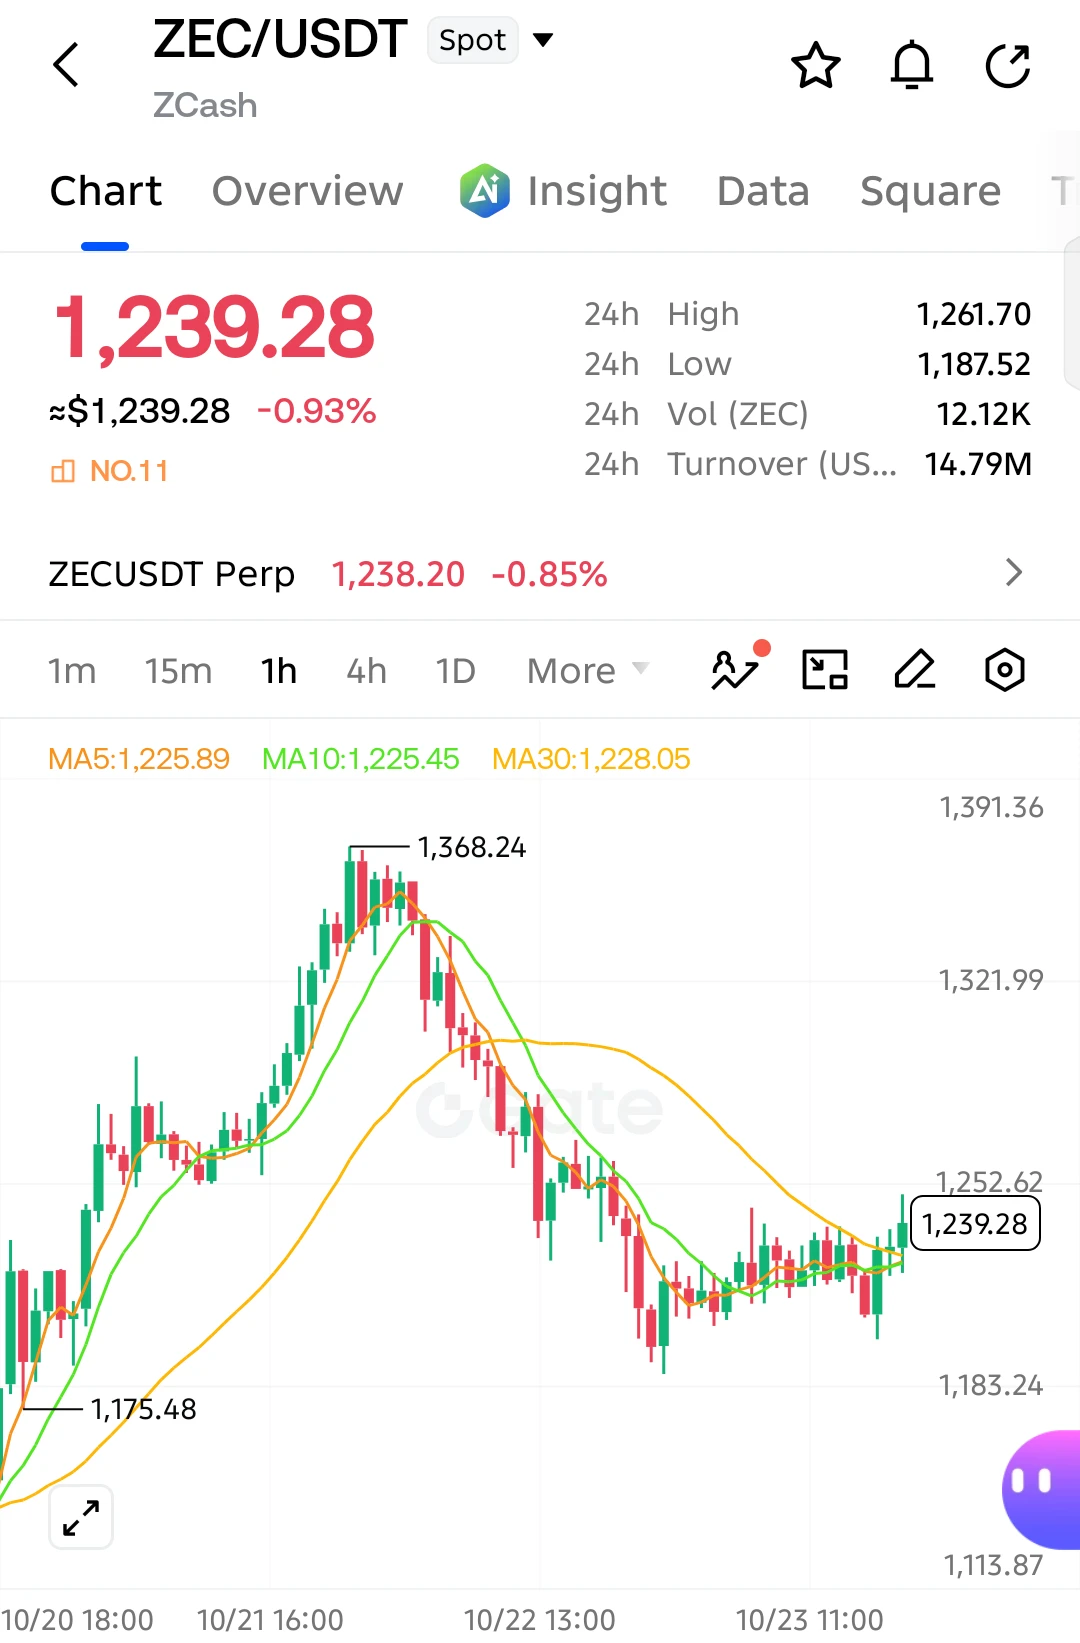
I originally wanted to cut my losses and sacrifice the flesh to heaven, but heaven never got its offering—the meat roasted itself. A few days ago, I was still staring at the chart before bed, worried and thinking this move was completely over, but in the middle of the night $ZEC gave the answer directly.
During the bottoming phase, I said that once the pullback held, buying pressure was quietly strengthening, so don’t let intraday decoys trick you into selling. Those who got in around 610.37 are now looking at a price of 1219.29, up +7085.23%—that’s a satisfying piece of meat, right? The key
post-image
ZEC+19.99%
XRP+0.32%
BTC+0.27%
Gold Pulls Back to Build Momentum, Awaiting a Breakout Amid Rate-Hike Expectations
The four-hour chart shows that gold prices pulled back after touching a high of $4,696 and are currently trading near the middle Bollinger Band. The RSI is in neutral territory, indicating that buying and selling forces are temporarily balanced, with the short-term direction awaiting breakout confirmation.
At the news level, the market is closely focused on the Federal Reserve’s September interest-rate decision, with expectations of whether to raise rates repeatedly shifting. Various U.S. economic data continue
post-image
XAU-0.10%
Everyone’s watching $SPCX /USDT pump—but the 4h chart just whispered a secret that most retail will ignore.

$SPCX /USDT - SHORT

Trade Plan:
Entry: 151.06 – 151.26
SL: 152.44
TP1: 150.20
TP2: 149.56
TP3: 148.60

Why this setup?
- Price is pinned at 151.16 with a **SHORT bias (77% confidence)** while the daily trend says “range”—that’s a compression zone.
- RSI on 15m is only 57.97—not overheated, not cold. It’s a **lull before a snap**, not a breakout signal.
- ATR on 1h (0.41) is tight—meaning the next 4h candle could stretch 3x that move.
- The “Waiting” status + invalidation at 14
SPCX+0.93%
$DOOD Signal】Bullish breakout + overbought continuation
$DOOD RSI 14 surged to 91.21, while 1H/4H MACD showed dual bullish expansion, and the price advanced along the upper Bollinger Band. Depth imbalance stood at 16.31%, with clear bid support. 1H surged from 0.001673 to 0.001951 at a steep slope, while 4H volume increased simultaneously. The funding rate of 0.0351% remains moderate, and OI is stable. The price continues to be aggressively pushed higher in the overbought zone, with a risk-reward ratio of 1.5; strict stop-loss placement is required.
🎯Direction: Long
⚡Entry/limit order: 0.001
post-image
DOOD+29.01%
BTC+0.29%
ETH+1.09%
SOL+2.41%
Everyone’s long BULLA—but the 4h tape is quietly screaming for a 25% flush.

$BULLA /USDT - SHORT

Trade Plan:
Entry: 0.074149 – 0.077421
SL: 0.091493
TP1: 0.064004
TP2: 0.056150
TP3: 0.044369

Why this setup?
- 1D trend is **range**, not uptrend—so longs are fighting gravity.
- SHORT bias at 55% while RSI (15m) sits at 51.96—no oversold bounce fuel left.
- Entry ref 0.075785 with TP1 at 0.064 (-15%) and TP2 at 0.056 (-26%).
- ATR (1h) is tight (0.0065)—breakout below 0.074149 could trigger a fast cascade.
- Why now? Price is stalling inside a weak range with shorts stacked above—wa
BULLA-8.54%
Everyone’s chasing $MU /USDT longs while the 4h quietly flips—are you early or early exit?

$MU /USDT - SHORT

Trade Plan:
Entry: 1019.67 – 1021.43
SL: 1029.04
TP1: 1014.18
TP2: 1009.93
TP3: 1003.57

Why this setup?
- 1D is *range*, not breakout—so the 1020.55 reference is a midpoint trap, not a launchpad.
- RSI 15m at 55.1 shows weak bounce fuel; momentum stalls right under the entry zone.
- ATR 1h (3.54) is tight—when it expands, it’s usually down from here.
- Why now? Price is sitting at the exact SHORT trigger with SL at 1029.04, giving a 2.3R to TP2 at 1009.93 before the daily ra
MU+0.50%
$MARA
It gave me the impression that it may be forming an inverse H+S in this area
post-image
MARA-2.41%
Load More

Join 40 M users in our growing community

⚡️ Join 40 M users in the crypto craze discussion

💬 Engage with your favorite top creators

👍 See what interests you

View More