Square
Following
Hot
News
Notifications
Profile
Share your thoughts
placeholder
Article
STRC AND TMUS DIVIDEND SETTLEMENT: TWO STOCK PERPETUAL FUTURES CONTRACTS RECEIVE UPDATED ARRANGEMENTS

Gate has published dividend settlement arrangements for STRC and TMUS perpetual futures contracts, bringing two additional stock-linked contracts into focus for traders who follow dividend-related adjustments in the digital asset market. The announcement highlights an important part of stock perpetual futures trading: understanding how dividend events are handled when the underlying exposure is connected to traditional stocks.

But what does this announcement actually mean? Why do dividends m
post-image
At 10:42, $NVDL plunged from 14 to 10.09, down more than 23%.
First, the consensus: most people read this kind of drop as a sign the trend has turned bad—a high-volume selloff from the highs, down more than 20% intraday, with a trading value of 19.2M. It looks like holders are dumping as tokens change hands. That reading isn't wrong; a few years ago, I thought the same way.
But this time, the structure is a little different. Today's low was 10.09, and the current price is 10.70. The drop was brutal, but it hasn't completely given way. The lower wick isn't just a pin; it's more like demolition
  • 2
  • 1
Trenches
FIONA
F
bade
b
FIONA
B34n...pump
Market Cap
$.
Change
.
24h Vol
$.
Holders
.
PIEVERSE
P
bade
b
PIEVERSE
0x0e...25a9
Market Cap
$.
Change
.
24h Vol
$.
Holders
.
mihao
m
bade
b
mihao
4Cxj...pump
Market Cap
$.
Change
.
24h Vol
$.
Holders
.
CLAUDIA
C
bade
b
CLAUDIA
2j5S...W2ZM
Market Cap
$.
Change
.
24h Vol
$.
Holders
.
IDOL
I
bade
b
IDOL
0x3b...ab07
Market Cap
$.
Change
.
24h Vol
$.
Holders
.
People who make money online generally tend to strain their eyes
A simple little tip can protect your eyes better than eye drops
It’s the well-known 【20-20-20 rule】:
20 minutes, 20 feet (about 6 meters), 20 seconds
① Every 20 minutes of screen time
② Look up at something at least 6 meters away
③ Keep looking for 20 seconds, then get back to work
Remember to blink more often, and you can also add some humidity to air-conditioned rooms!
post-image
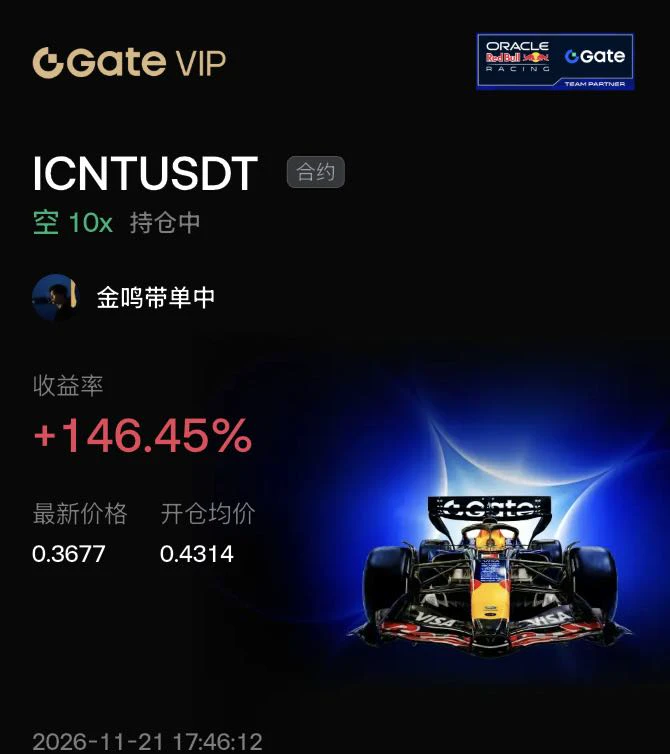
A detail: 60% of accounts are short, so this $ICNT trade was actually on the majority’s side.

Data from the 20th: 39% of accounts were long and 61% were short. The funding rate was positive, at an annualized 7.6%, so shorts were collecting payments. Of the 870,000 in liquidations, 40% were long positions.

As the price rose, more people kept shorting it. That’s countertrend shorting, usually not a good sign. But once it couldn’t climb any further, those short positions became a hand pressing it down.

Entered at 0.4314, closed at 0.3677. A small part of the 146% return came from collecting f
post-image
ICNT-10.47%
ETH-1.23%
AKE+6.39%
  • 1
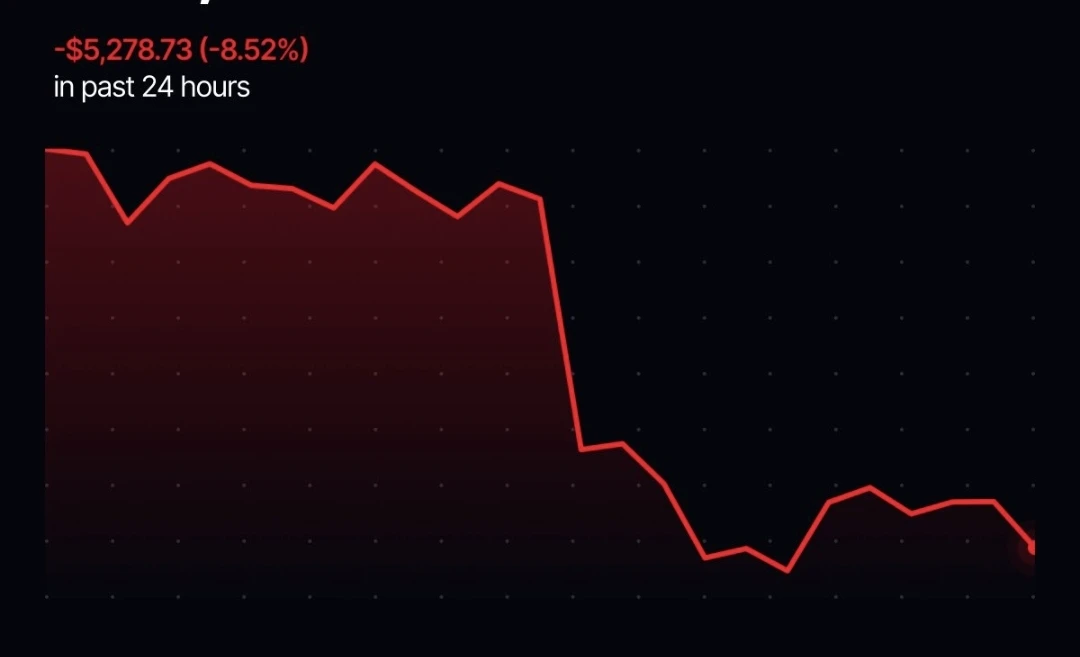
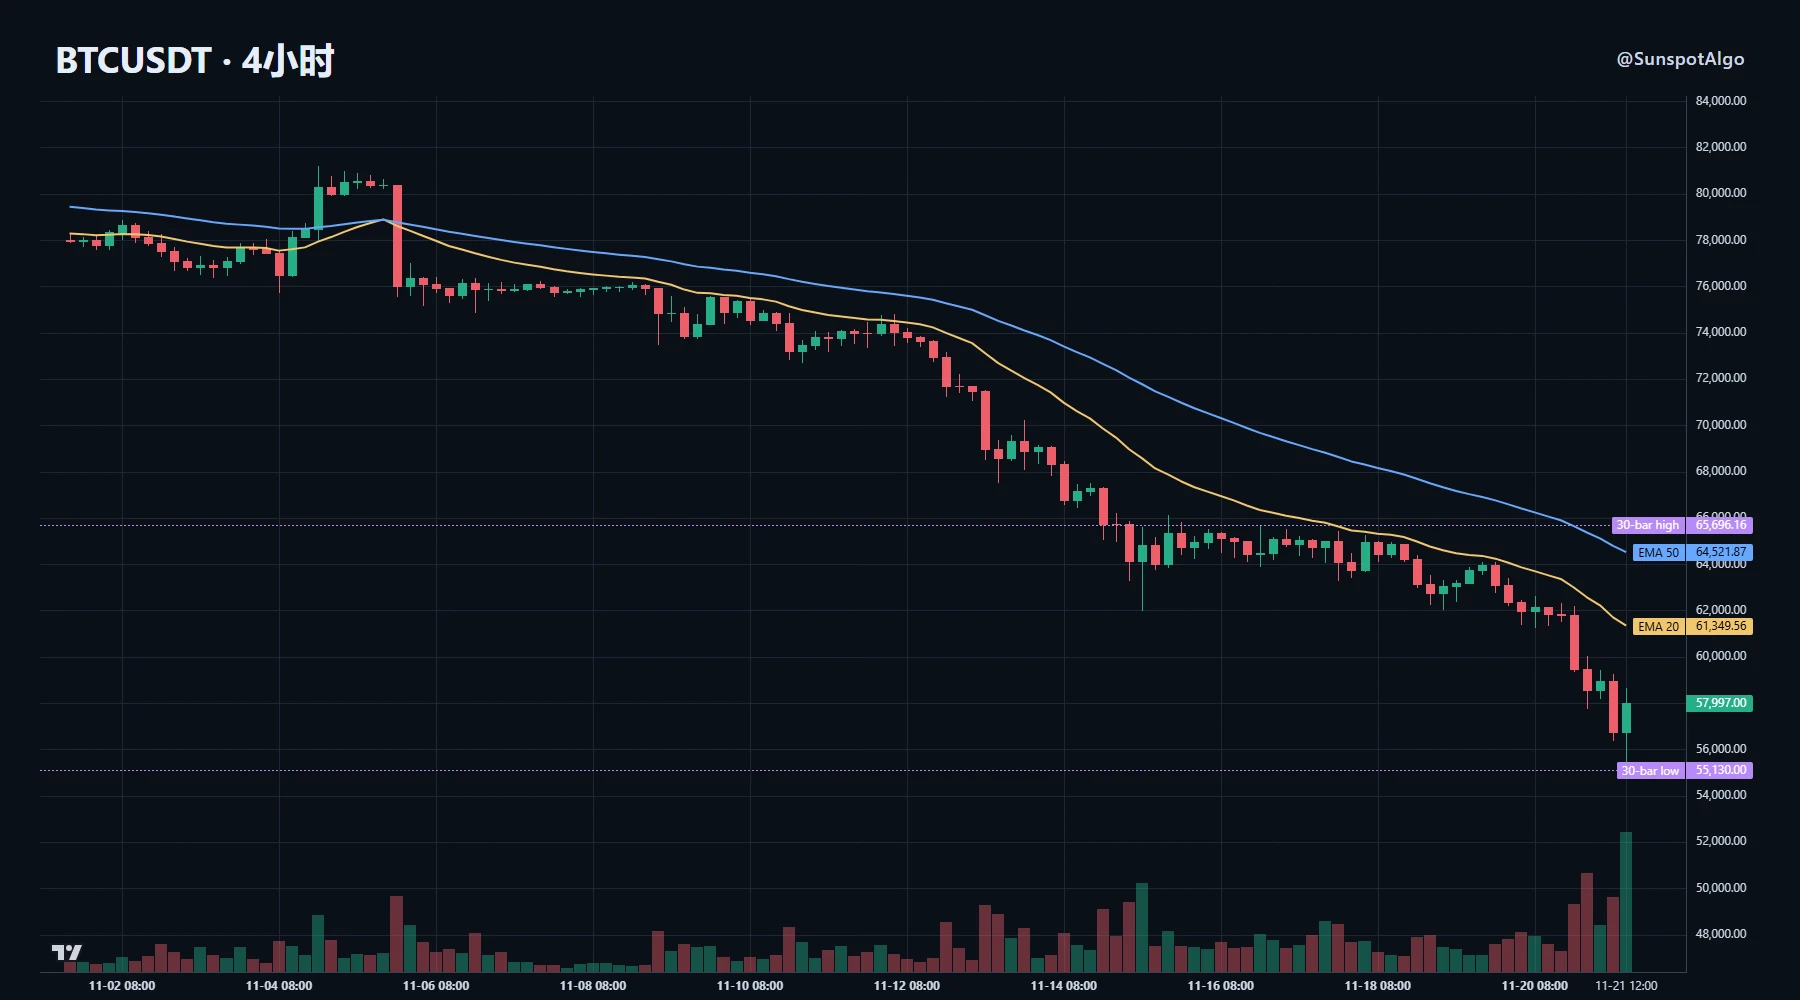
🚨 BREAKING: Bitcoin falls to its lowest level in over two years.

$BTC is down 8.52% over the last 24 hours as selling pressure intensifies across crypto.

Tech-stock losses, ETF outflows and leveraged liquidations continue to weigh on the market.

#ShareWeekly
#BTCBreaksBelow60K

$BTC ‌
post-image
BTC-0.67%
  • 1
#NvidiaDropsNearly14Percent
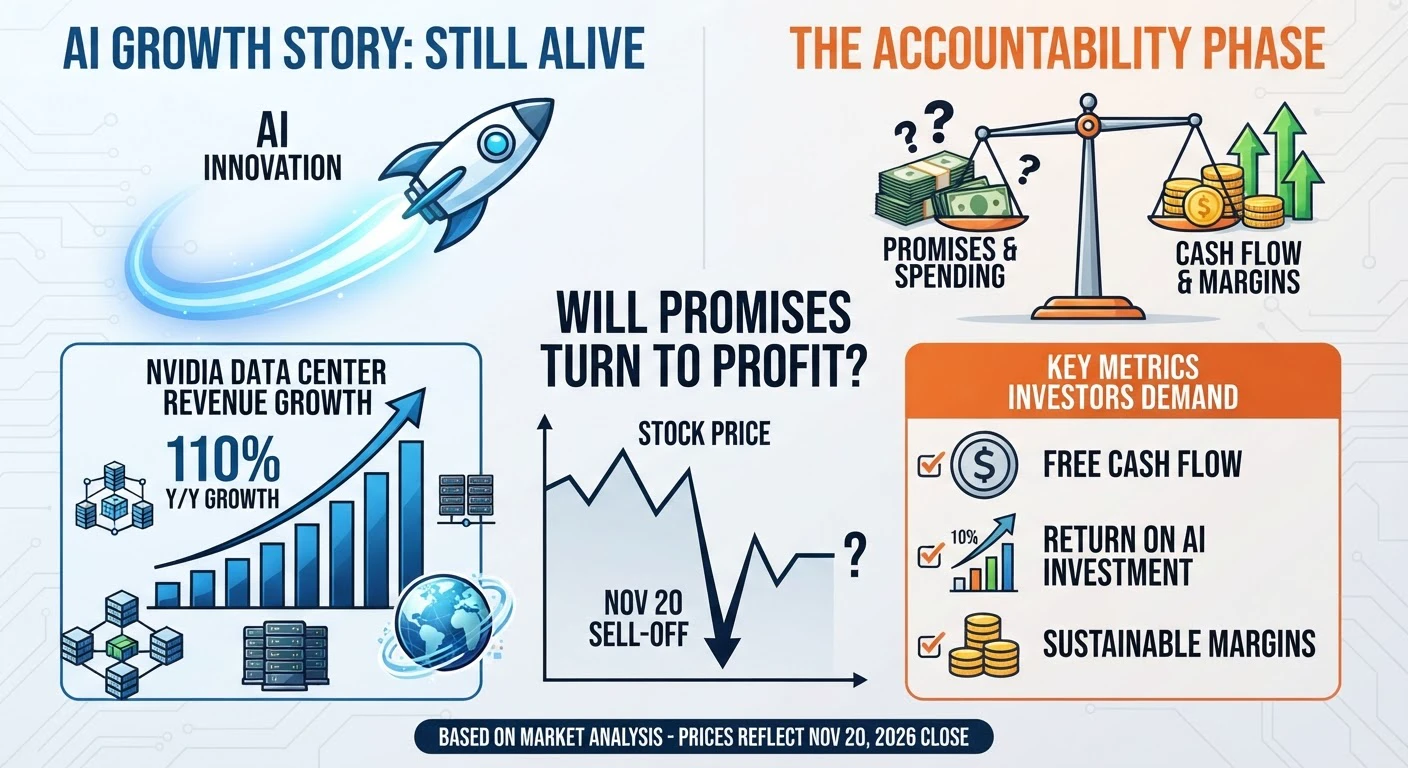
The November 20 sell-off was broader than NVIDIA: NVDA fell 14.01% to $125.53, AMD dropped approximately 13.26%, Broadcom lost 12.12%, Micron fell 13.89%, and the Nasdaq declined 5.28%. NVIDIA also lost approximately 23% over the week.

AI STOCKS UNDER PRESSURE: NVIDIA FALLS 14% — IS THE AI BOOM OVER, OR IS THE MARKET REPRICING THE FUTURE?

The November 20 sell-off delivered a serious warning to the entire technology sector. NVIDIA closed at $125.53, down $20.45 or 14.01% in one session. Its previous close was $145.98, while the session range stretched from $124.5
post-image
WLD market predictions
live-cover
LIVE2,084
WLD-5.61%
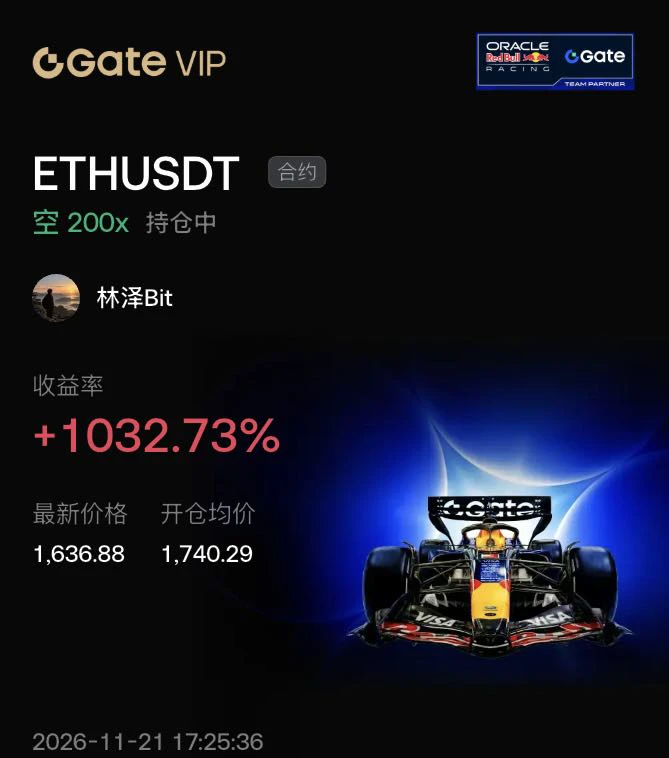
$ETH This downturn isn’t caused by a problem within crypto; macro conditions are crushing valuations. The Nasdaq plunged, Nvidia fell more than 14%, AI and chip stocks sold off across the board, and even gold dropped more than 2%—this isn’t a flight to safety, it’s a scramble for cash.

U.S. spot Bitcoin ETFs saw net outflows on 12 of the first 14 trading days, totaling about $3.47 billion and wiping out all year-to-date inflows; order book depth has fallen nearly 38% from its previous peak, so a single large order can push prices even lower.

So shorting ETH at 1,740 isn’t a bet against Ether
post-image
ETH-1.23%
BTC-0.65%
SNDK-0.18%
  • 1
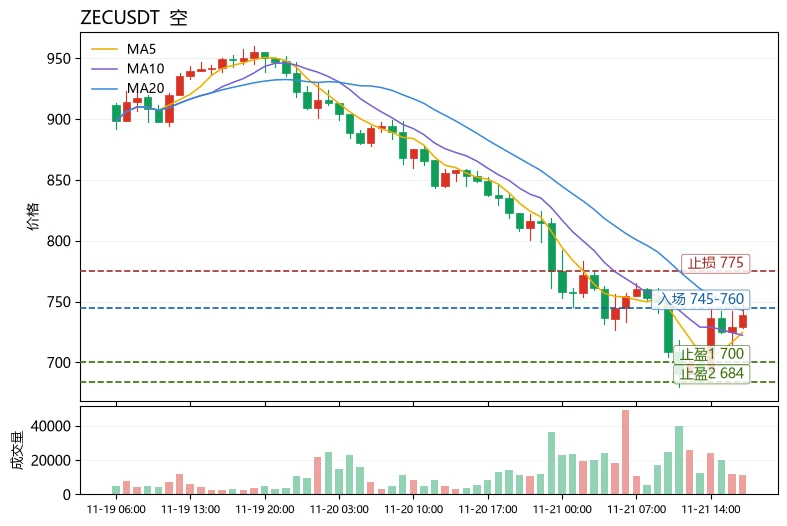
$ZEC Current price: 739.83, down 12.86% over 24h, with a 25.26% price range. Volatility is high, so the priority now is not to guess the direction but to control position size. Conclusion: short-term bias is bearish. If a rebound into the 745–760 range meets resistance, consider a small short position, capped at 5% of total capital, with leverage no greater than 3x.
Rationale: MA5=724.57 is below MA20=742.80, and medium-term moving average resistance remains intact; RSI=42.2 is neutral to weak, with limited rebound momentum; the MACD histogram at +4.999 is bullish but diverges from price, mak
post-image
ZEC+1.16%
PUMP-1.06%
HMSTR-1.98%
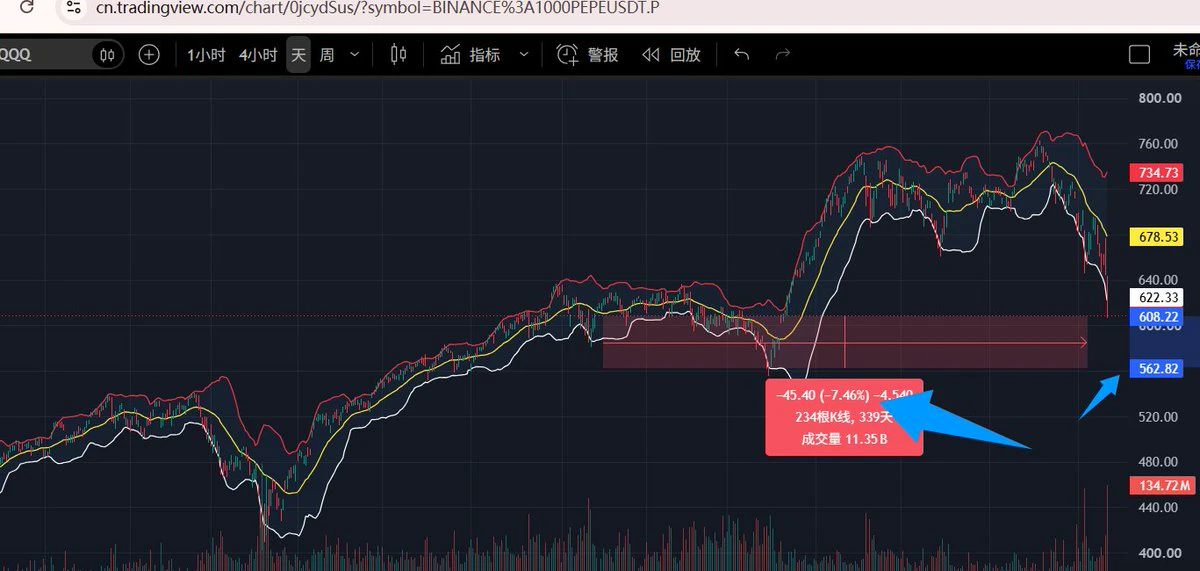
I even suspect we may not get a bounce until around 50000-51000😂
Because it looks like q could still drop another 7% or so before bouncing
If q drops another 7% or so, BTC could drop around 10%
I’ve decided to take a gamble here, win or lose [after the bet, I’m taking a break]
post-image
BTC-0.67%
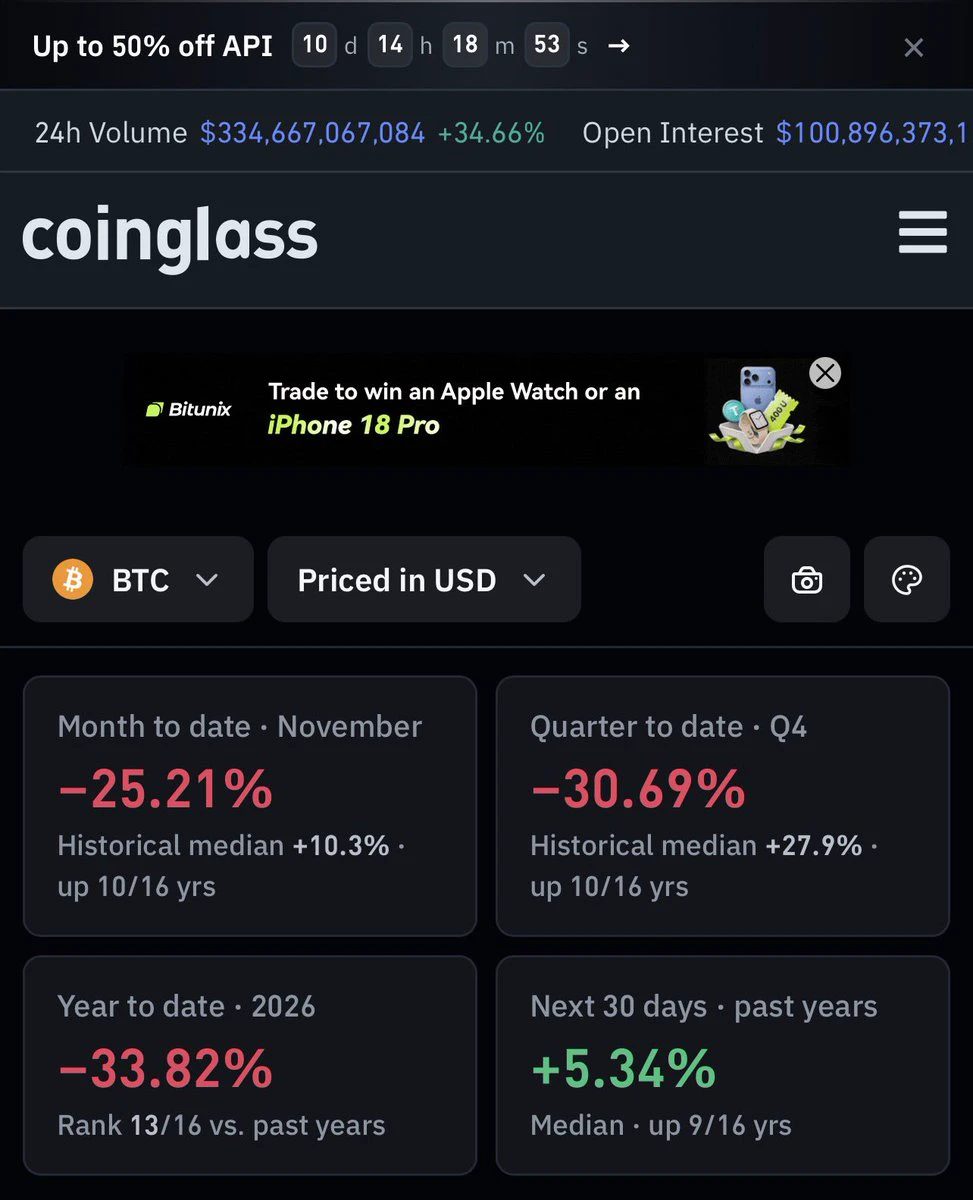
According to Coinglass data,
Bitcoin’s November 2026 return currently stands at -25.22%,
provisionally marking the second-lowest November return on record.
Across Bitcoin’s 16 November performances since 2010,
10 ended higher and 6 ended lower.
The largest gain occurred in November 2013,
when the monthly return reached 453.6%.
The largest decline occurred in November 2018,
when the monthly return fell 36.41%.
Since 2010, Bitcoin’s average November return
has been 34.95%,
with a median return of 10.26%.

Ethereum’s November 2026 return currently stands at -27.35%,
also provisionally marking the
post-image
BTC-0.67%
ETH-1.26%
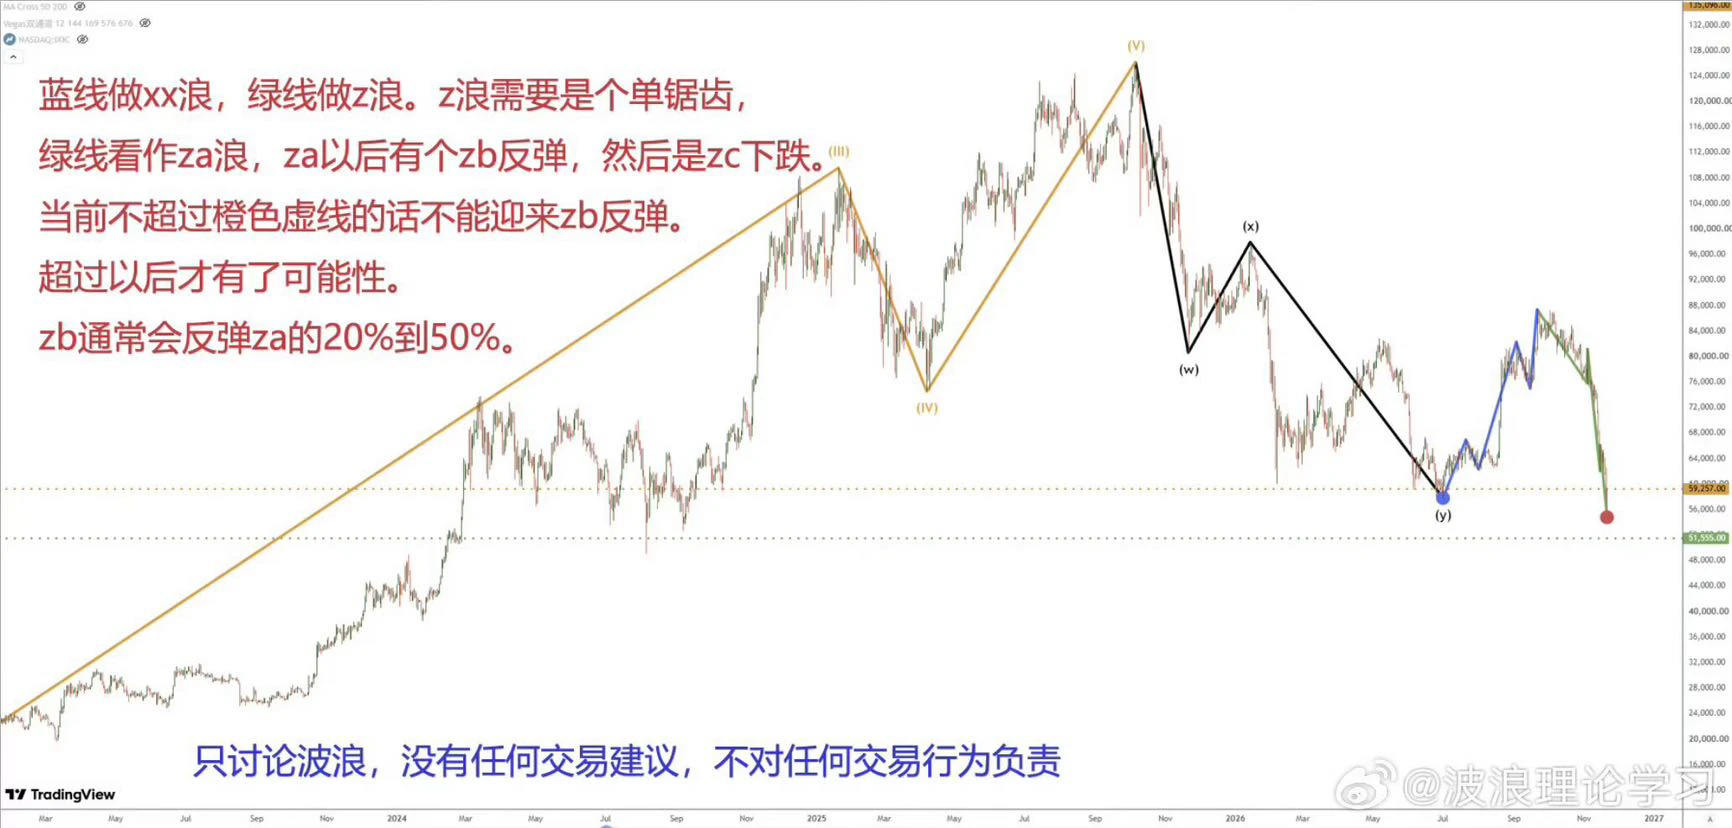
Bitcoin analysis$BTC ‌
post-image
BTC-0.65%
Black Friday! The entire AI industry chain is caught in a sell-off, with the Nasdaq plunging 5.28% in a single day
#比特币跌破6万美元,短期能否企稳反弹?
🔥🔥U.S. stocks saw a sharp sell-off, with all three major indexes tumbling: the S&P 500 fell 3.70%, closing lower for seven consecutive sessions; the Nasdaq dropped 5.28%, wiping out all of its gains for the year; and the Dow fell 1.93%, with two indexes officially entering correction territory. The Philadelphia Semiconductor Index plunged 10.73% in a single day and fell 17.13% for the week, its worst weekly performance since 2001.

🤔🤔🤔Strong earnings fai
post-image
ENSO-2.90%
MU-13.88%
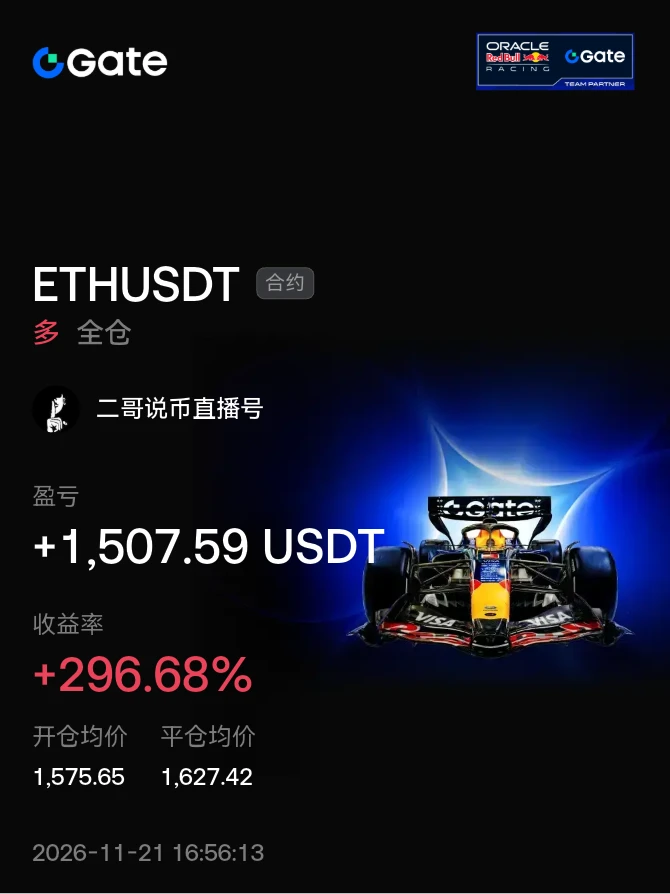
#晒出我的合约收益 Going live to help everyone make back some losses. Have a great weekend. See you Sunday night.
post-image
  • 2
$RUNE Short idea: Trying to go short around 0.4762–0.4786. Anyone else on the same side?

This area lines up with resistance, and the key question is whether sellers can hold their ground. Several technical signals are bearish—the price is around 0.477 on the 4-hour chart, below the EMA50 (0.526), with the short-term structure dominated by bears; on the daily chart, it is also below the EMA200 (0.531), making the broader trend more favorable to downside.
For risk management, the stop-loss is about 2.9% away, while TP3 offers around 4.7% upside. If the move goes as planned, the risk/reward rati
post-image
RUNE-0.14%
$BLESS Now aggressively going long, buying later at $0.052323. Entry price: $0.020642. Long $BLESS 👇
post-image
BLESS-2.00%
  • 1
Looking at BTC’s price action, the sharp drop can make it seem as though bears are firmly in control, but changes in open interest point to a more measured conclusion.

Over the past 24 hours, the price fell about 6%, while open interest contracted by nearly 3%. This combination of falling prices and lower open interest suggests the selling pressure mainly came from longs closing out, with insufficient evidence of new short positions being opened. In terms of market rhythm, this looks more like a concentrated wave of deleveraging than the start of a new downtrend, and the two scenarios have ve
post-image
BTC-0.65%
$EVAA $EVAA was a FOMO coin last year$LAB Do you think EVAA will take River’s liquidity and easily break $20
post-image
EVAA-0.49%
LAB-4.47%
🔹 Arbitrum One’s stablecoin market cap grew by $327.4 million over the past 7 days
live-cover
LIVE2,276
BTC-0.67%
ETH-1.26%
ZEC+1.16%
SOL-0.77%
USDC+0.01%
Load More

Join 40 M users in our growing community

⚡️ Join 40 M users in the crypto craze discussion

💬 Engage with your favorite top creators

👍 See what interests you

Trending Topics

BTCBreaksBelow60K

2.1M Views29.4K Discussing

BTC fell below $60,000 on November 20 for the first time since July, alongside a tech stock selloff and broader pressure on risk assets. Will $60K become resistance, or can BTC quickly reclaim it? What price or volume signals would convince you that selling pressure is easing?

GateDirectIPOPhase3ANTAllocates92100Shares

750.8K Views4.8K Discussing

NvidiaDropsNearly14Percent

315.2K Views7.5K Discussing

View More