Square
Following
Hot
News
Notifications
Profile
Share your thoughts
placeholder
Article
$BTC Perpetuals are bearish. Today’s drop has been fast and smooth, with the bears giving the bulls no chance to catch their breath.
From yesterday’s high of 73708, it has fallen more than 5,400 points in less than a day, down 6.8% in 24 hours. Perpetuals trading volume is about $9.5 billion, the highest in the market. It’s now at 68550. The 13:00 hourly candle just hit a new low of 68243, and the 11:00 candle alone plunged nearly 1,800 points. Every hourly candle is making a lower high and a lower low.
After the round-number level of 70000 broke this morning, the rebound only reached 70286 a
BTC-0.65%
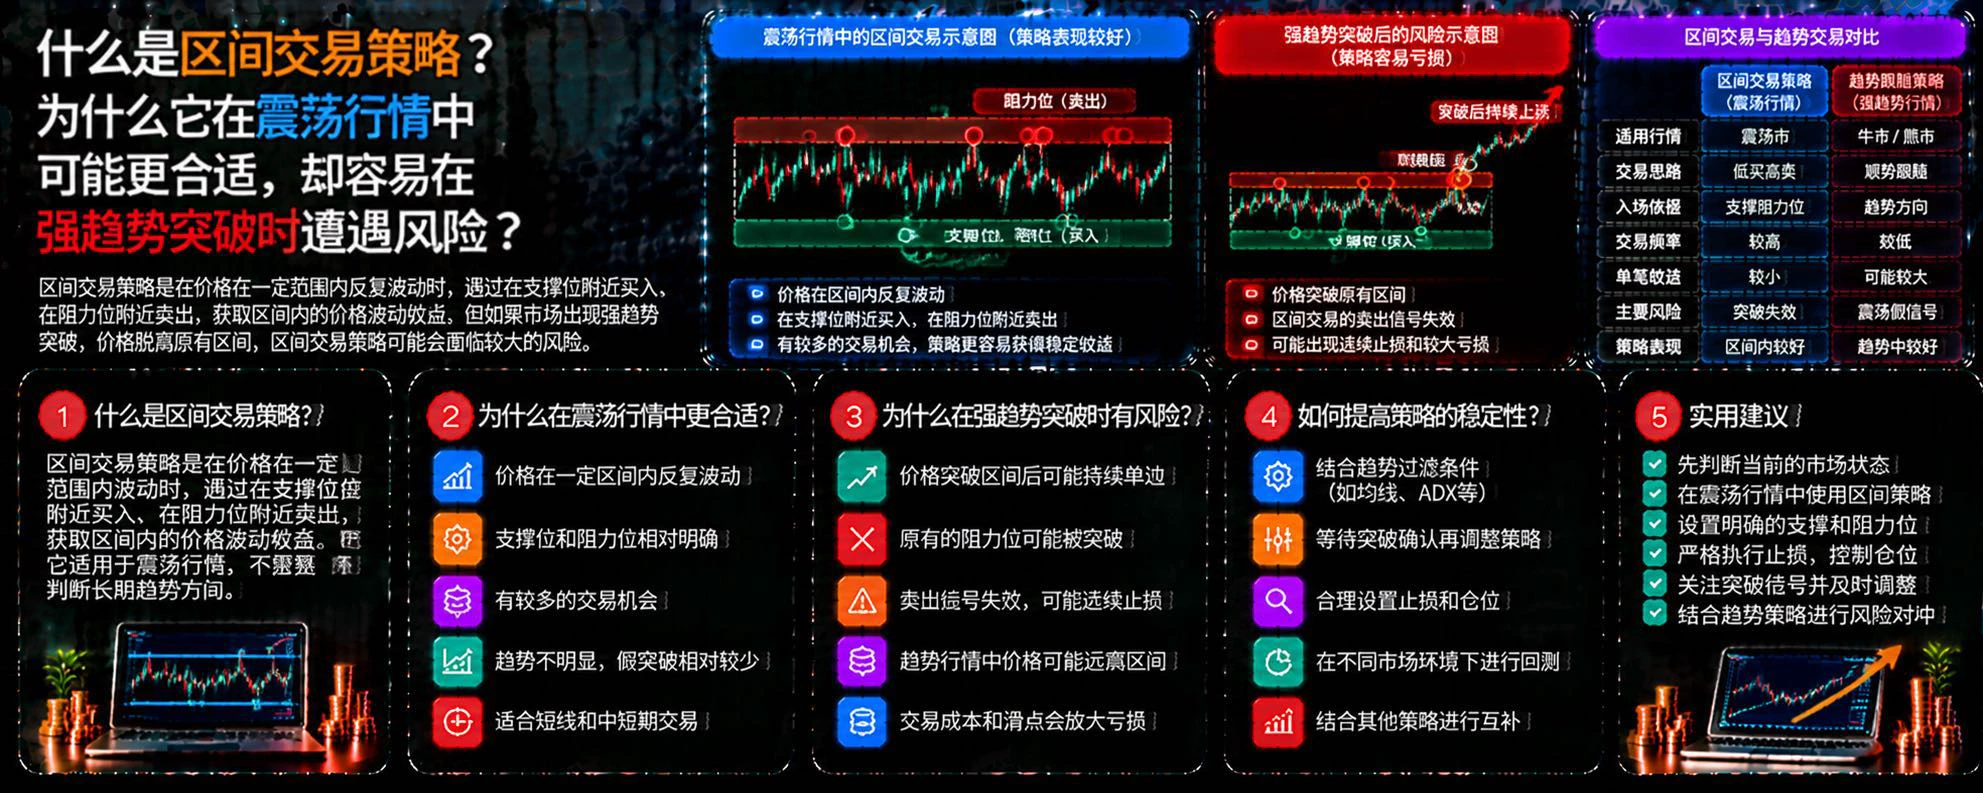
What Is a Range Trading Strategy? Why Might It Be More Suitable in a Sideways Market, Yet Risky During a Strong Trend Breakout?

In crypto trading, prices do not always move continuously up or down. When the market lacks a clear direction and prices repeatedly fluctuate within a certain range, a range trading strategy may be useful. But once the price truly breaks out of the range, the original trading logic can quickly become invalid.

First, what is a range trading strategy?

Range trading involves identifying support and resistance areas where prices repeatedly fluctuate, looking for buying
post-image
Trenches
mihao
m
bade
b
mihao
4Cxj...pump
Market Cap
$.
Change
.
24h Vol
$.
Holders
.
AGT
A
bade
b
AGT
0x5d...e274
Market Cap
$.
Change
.
24h Vol
$.
Holders
.
FOOD
F
bade
b
FOOD
FTu5...pump
Market Cap
$.
Change
.
24h Vol
$.
Holders
.
IDOL
I
bade
b
IDOL
0x3b...ab07
Market Cap
$.
Change
.
24h Vol
$.
Holders
.
AI
A
bade
b
AI
2T56...pump
Market Cap
$.
Change
.
24h Vol
$.
Holders
.
Does a sudden surge in trading volume signal a strengthening trend or a market reversal?

In crypto markets, a sudden increase in trading volume often catches traders’ attention. Some see it as a sign that capital is flowing in, while others worry that major players are exiting.

With the same surge in volume, why does the price sometimes keep rising, while at other times it suddenly reverses?

The key is that trading volume reflects changes in market activity, but on its own, it cannot show that buyers or sellers necessarily have the upper hand.

First, observe how the price behaves when volu
post-image
Someone please tell me this is all going to be over
I hate it when I’m wrong !
post-image
$ETH
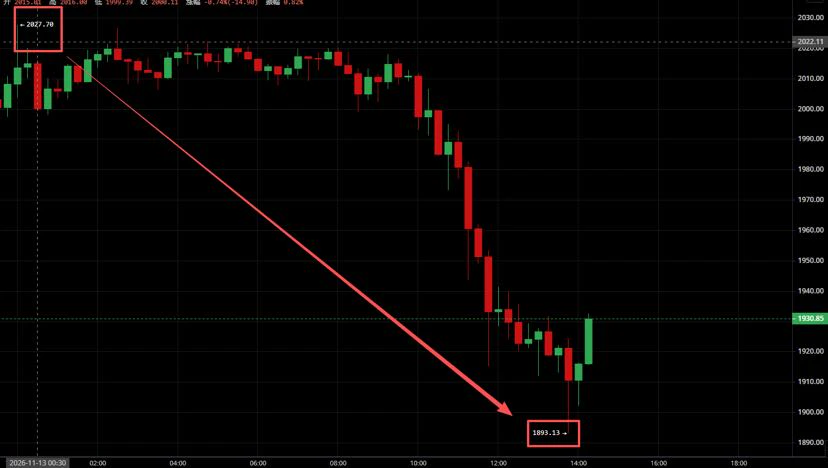
Intraday one-way plunge of over 134 points; bearish trend remains intact
Came under pressure and fell from 2027.70 in the morning, breaking through several key support levels, including 2000 and 1950, and hitting a low of 1893.13 as bearish momentum was unleashed
Currently in an oversold, weak-recovery phase, with insufficient volume support and no trend-reversal signal; there is still room to fall after the rebound meets resistance

Resistance: 1940-1950, 1980
Support: 1890-1900
Strategy: Focus on selling rallies; don’t blindly try to catch or call the bottom#BTC跌4%
post-image
ETH-1.26%
  • 1
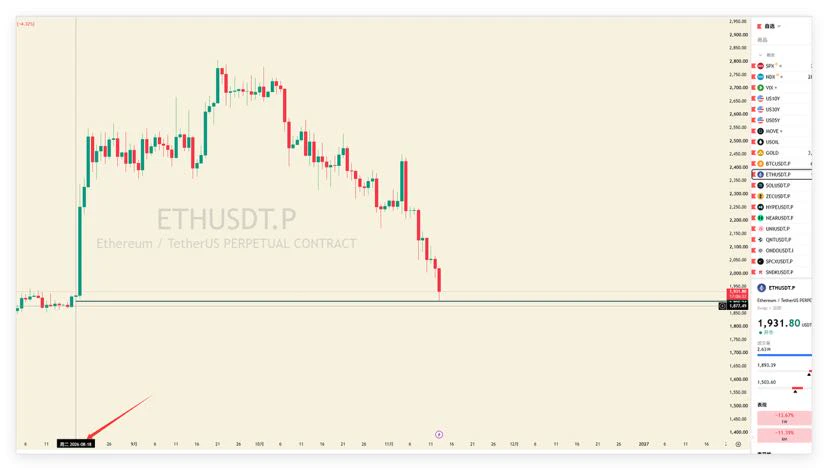
$ETH ETH has reached the starting point of its rise on 2026/8/18. Did you buy the dip, guys!👀#BTC跌4%
post-image
ETH-1.26%
Why does a larger account loss require a higher return to break even?

There is a mathematical principle in trading that is easy to overlook: the percentage loss and the return needed to break even are not symmetrical. The deeper the account’s losses, the harder it is to restore its original balance.

First, losses and recovery are not symmetrical. Suppose an account has 100k USDT. After a 30% loss, only 70k USDT remains. To get back to 100k, it needs to rise by about 42.9%, not just gain 30%.

Second, the deeper the loss, the greater the pressure to recover. After a 50% loss, only half the fu
post-image
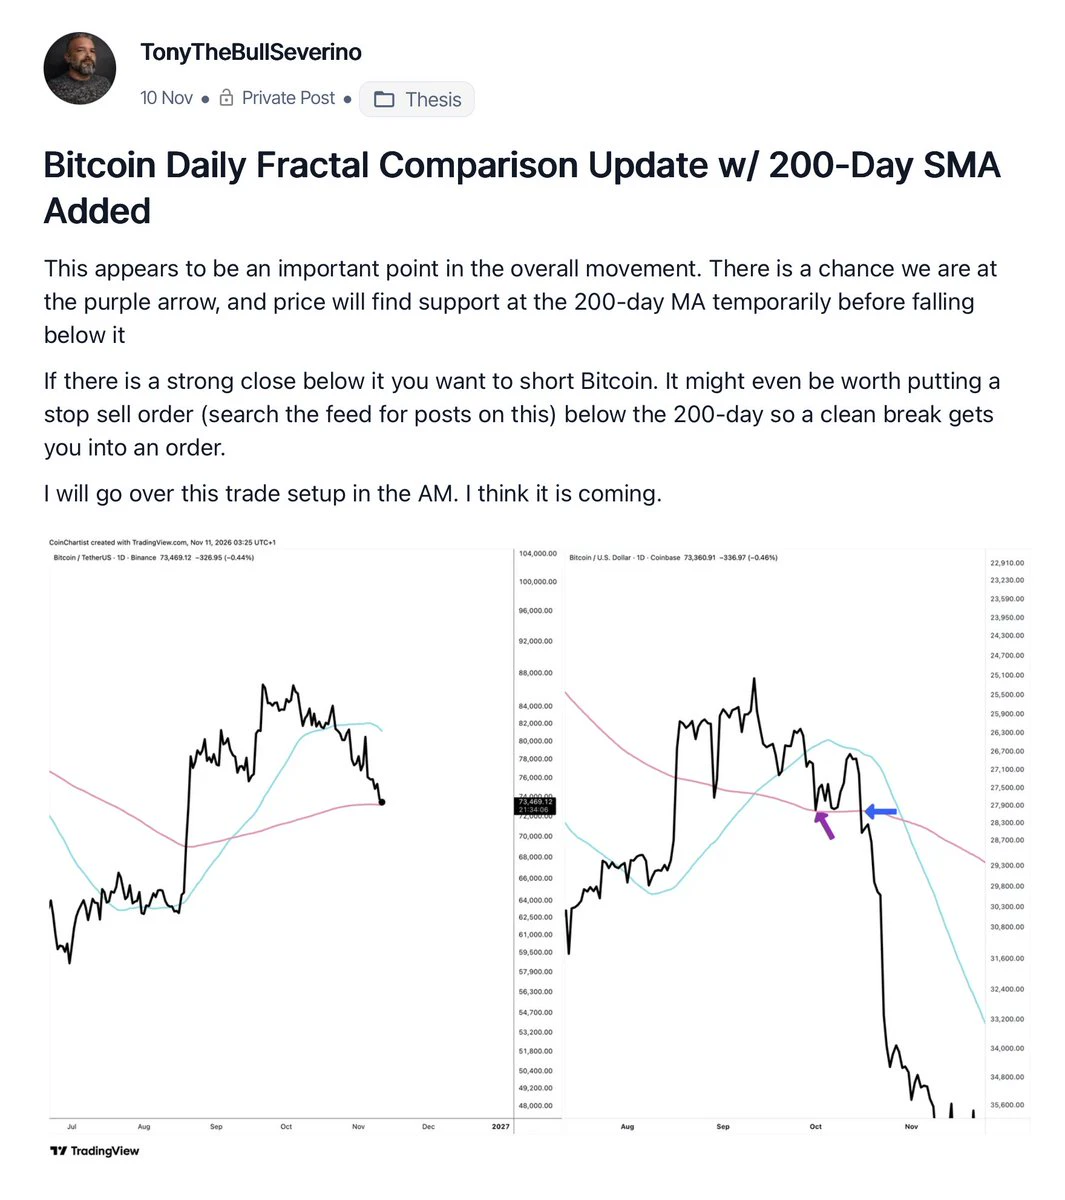
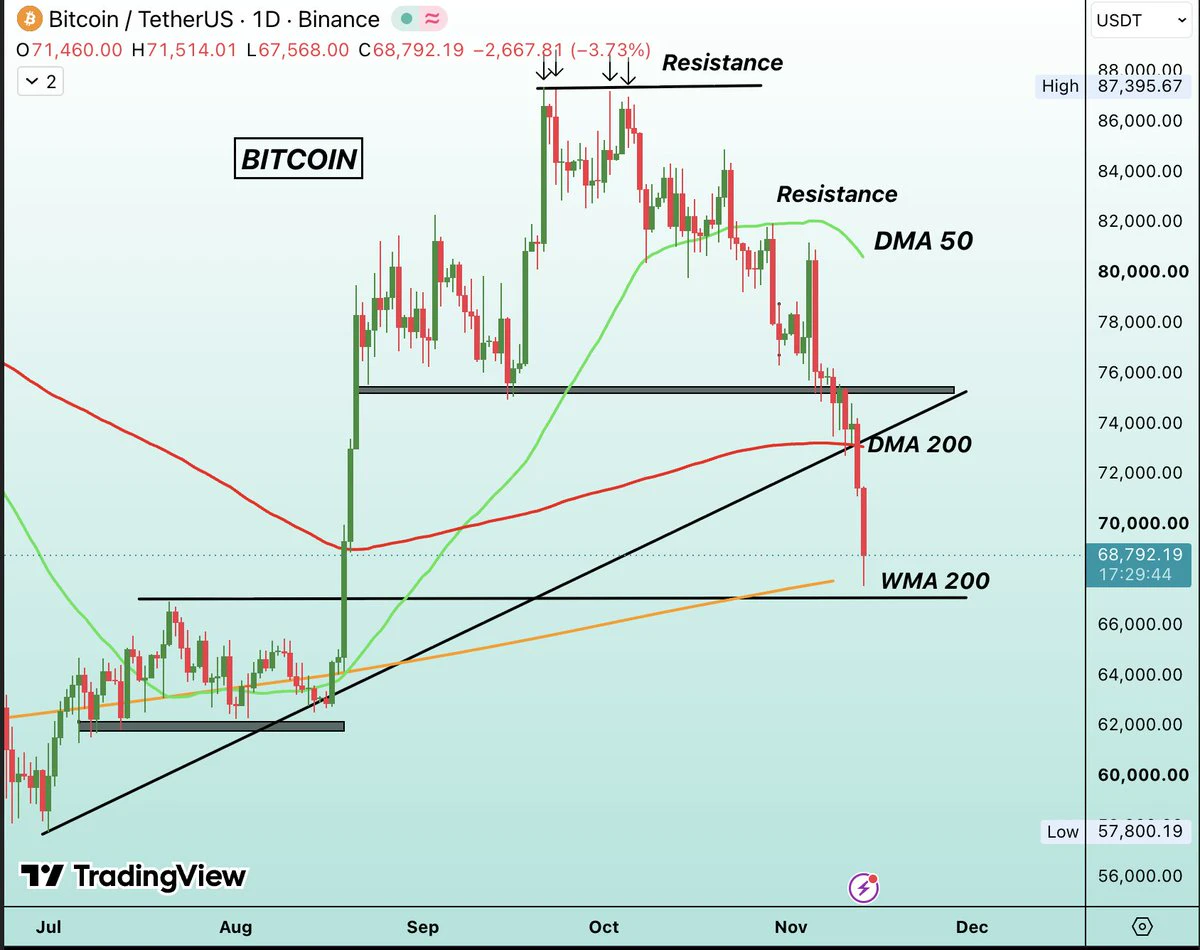
Bitcoin just retest WMA 200 at $68,000 after 85 days.
post-image
BTC-0.67%
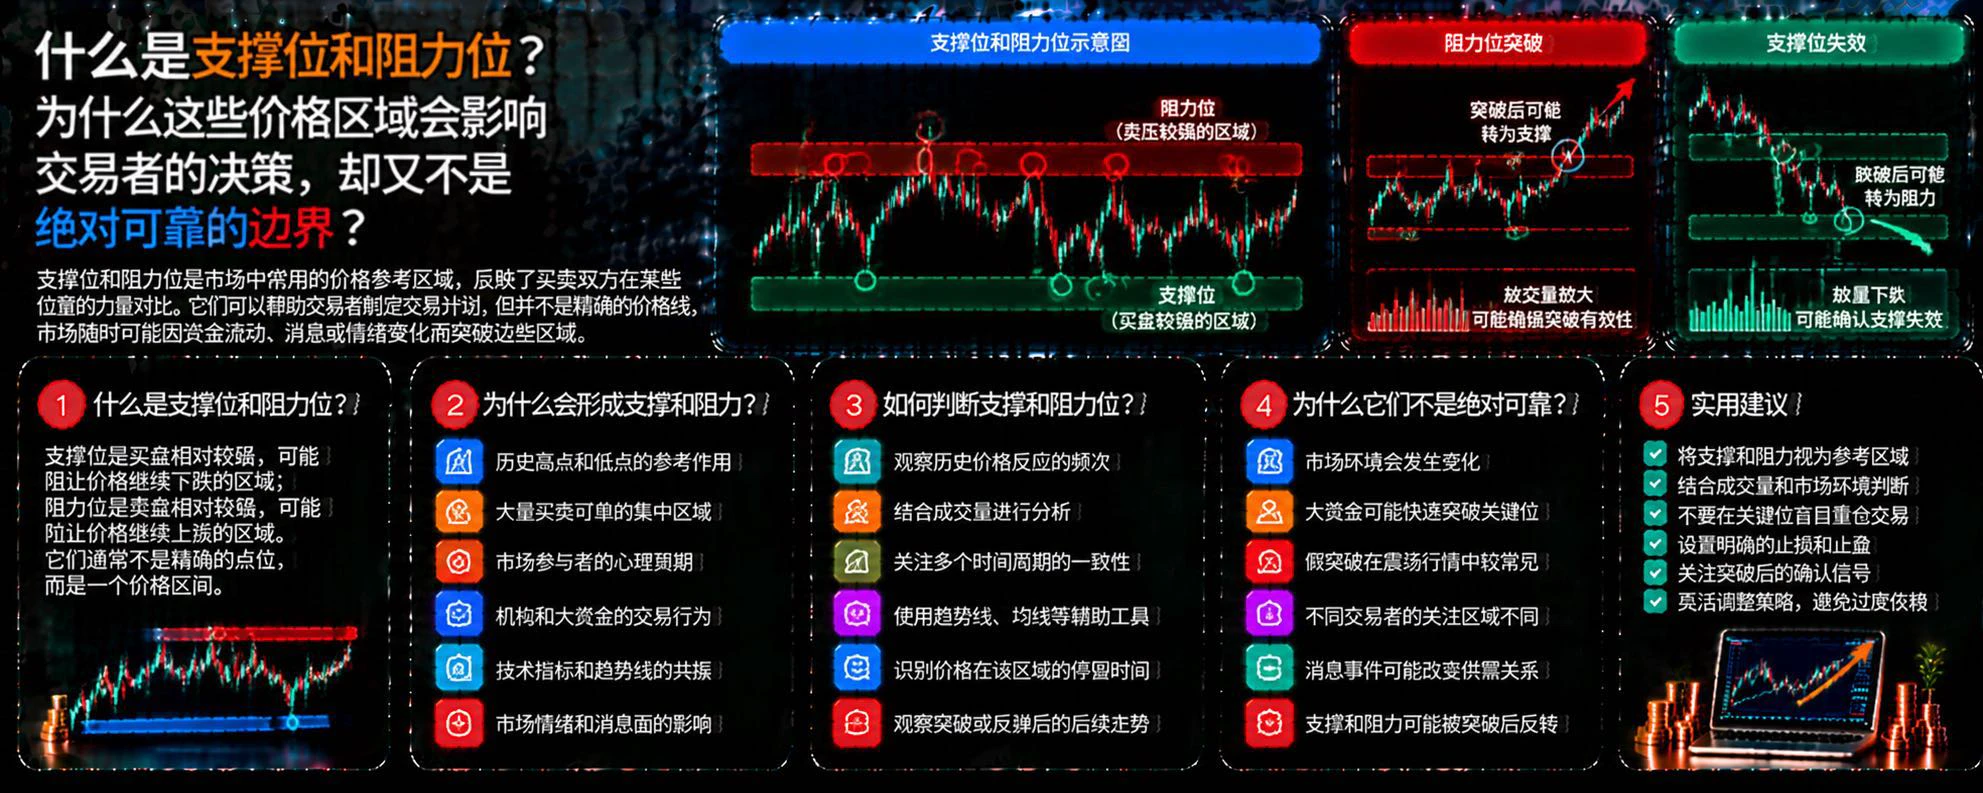
What are support and resistance levels? Why do these price zones influence traders’ decisions, yet are not absolutely reliable boundaries?

In cryptocurrency trading, prices often rebound or retreat repeatedly in certain zones. Traders usually call these zones support and resistance levels. They can help analyze market structure, but they do not guarantee that prices will rebound or reverse.

First, what are support and resistance levels?

A support level is a zone where buying may strengthen and a price decline may temporarily slow; a resistance level is a zone where selling may increase and
post-image
USOctoberCPIBeatsExpectations Inflation is heating up again. Could the Fed turn more hawkish, and wh
live-cover
LIVE2,327
🔹South Korean Chip Stocks Rebound Against the Trend! KOSPI Gains Over 2, While SK Hynix and Samsung
live-cover
LIVE4,398
I made this so easy for my subs
bio in Iink
post-image
Why can a breakout fail even when the technical setup is clearly in place?

The price breaks through resistance, volume rises at the same time, and it even climbs again after a retest—on the chart, every condition seems to be met. But before long, the price suddenly reverses and falls back into its previous range.

Why can a technical setup that looks perfect still fail?

Because technical analysis provides probability-based assessments, not guarantees about the future.

First, key levels do not mean the market will necessarily react as expected.

Resistance and support are reference zones for
post-image
What Is the Market Pricing When the Spot-Futures Basis Widens?

In the crypto market, besides price, trading volume, and funding rates, there is another metric worth watching: the basis.

Sometimes, Bitcoin's spot price changes little, while its futures price is significantly higher than spot; at other times, the futures price is lower than spot. This difference is more than just a numerical change—it may also reflect differing expectations about future prices, funding costs, and demand for positions.

First, understand what the basis is.

The basis usually refers to the difference between the
post-image
BTC-0.67%
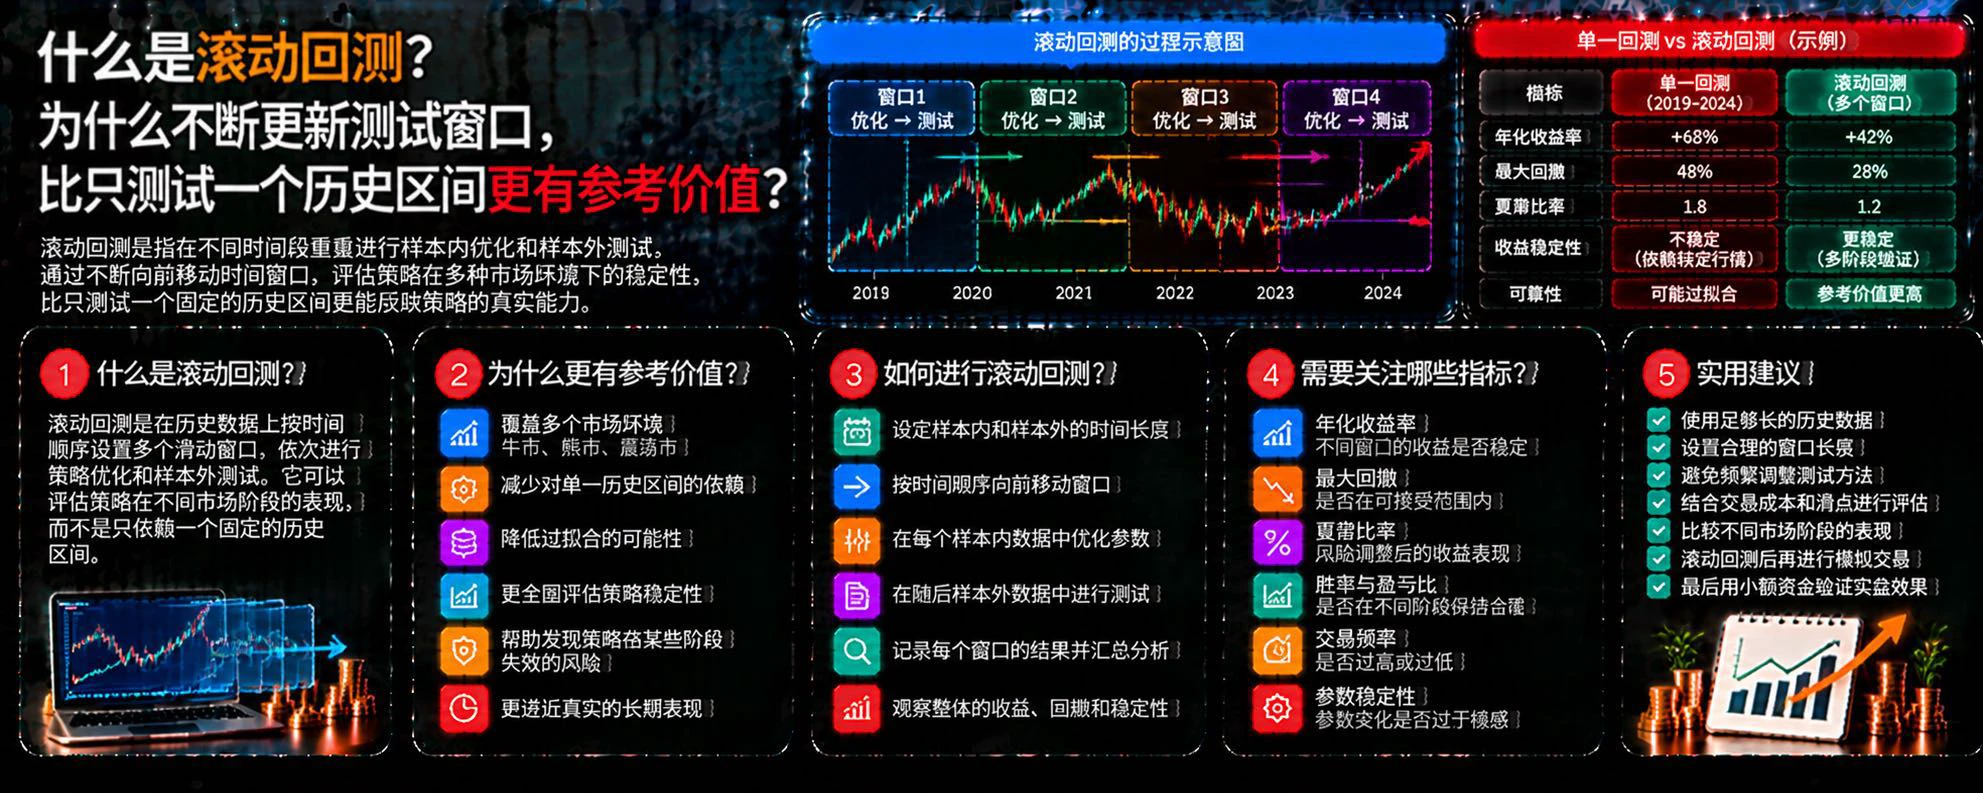
What Is Rolling Backtesting? Why Is Continuously Updating the Test Window More Informative Than Testing Just One Historical Period?

In cryptocurrency trading, a strategy may perform well in one period of historical market activity but fail to adapt to subsequent market changes. Testing only one fixed period can easily overlook how the strategy performs in different conditions. Rolling backtesting continuously updates the test window, helping traders evaluate a strategy’s stability more comprehensively.

First, what is rolling backtesting?

Rolling backtesting divides historical data into mult
post-image
The operator of Dove’s Kuaishou flagship store was fined 800k yuan for portraying infidelity as sweet in an advertisement.
But the party fined was Shanghai Zongzheng Food, the flagship store operator—not Dove’s brand owner!
post-image
The Higher the Funding Rate, the More You Should Short? Don’t Mistake Market Sentiment for a Trading Signal

In crypto perpetual futures markets, when funding rates continue to rise, some traders believe longs are overcrowded and the market could reverse at any moment, so they choose to go short.

But a high funding rate does not mean prices will fall immediately. It reflects the relationship between perpetual contract prices and market mechanisms such as mark prices, as well as the holding costs for longs and shorts at a given moment.

First, understand the role of funding rates.

Perpetual c
post-image
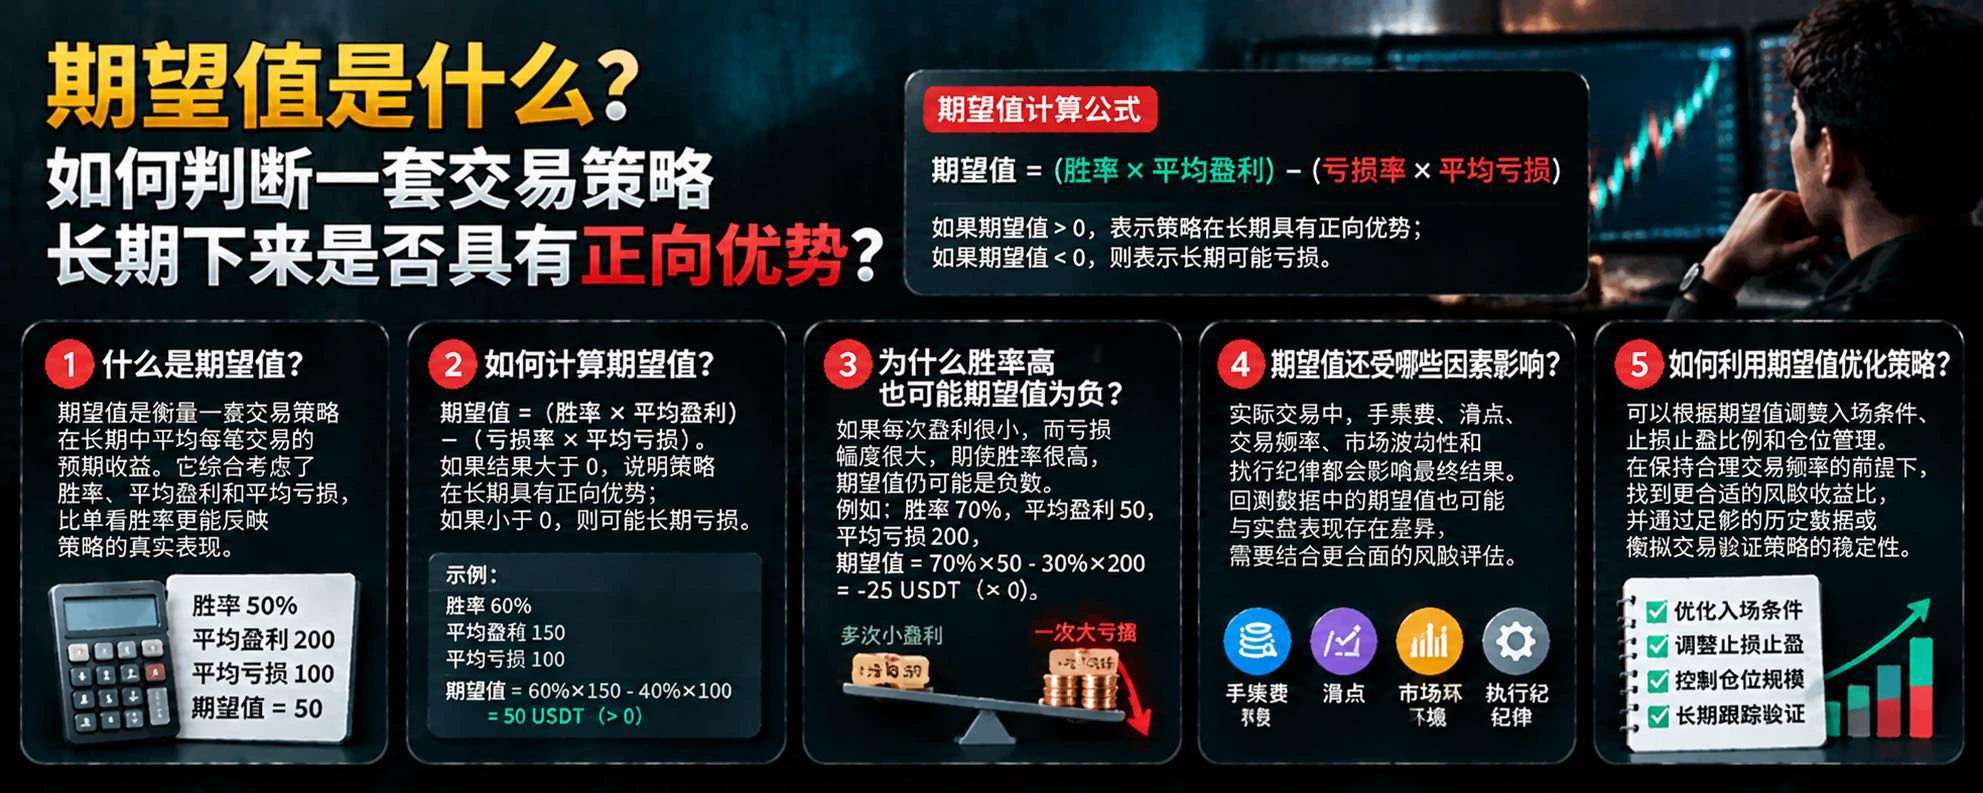
What Is Expectancy? How Can You Tell Whether a Trading Strategy Has a Positive Edge Over the Long Term?

Whether a trading strategy is worth using over the long term cannot be judged by how much a few trades made. What matters is how much profit each trade generates on average and how much loss risk it carries. That is the purpose of expectancy.

First, what is trading expectancy?

Expectancy is a metric that estimates the average long-term outcome per trade based on the win rate, average profit, and average loss. The formula is:

Expectancy = win rate × average profit − loss rate × average lo
post-image
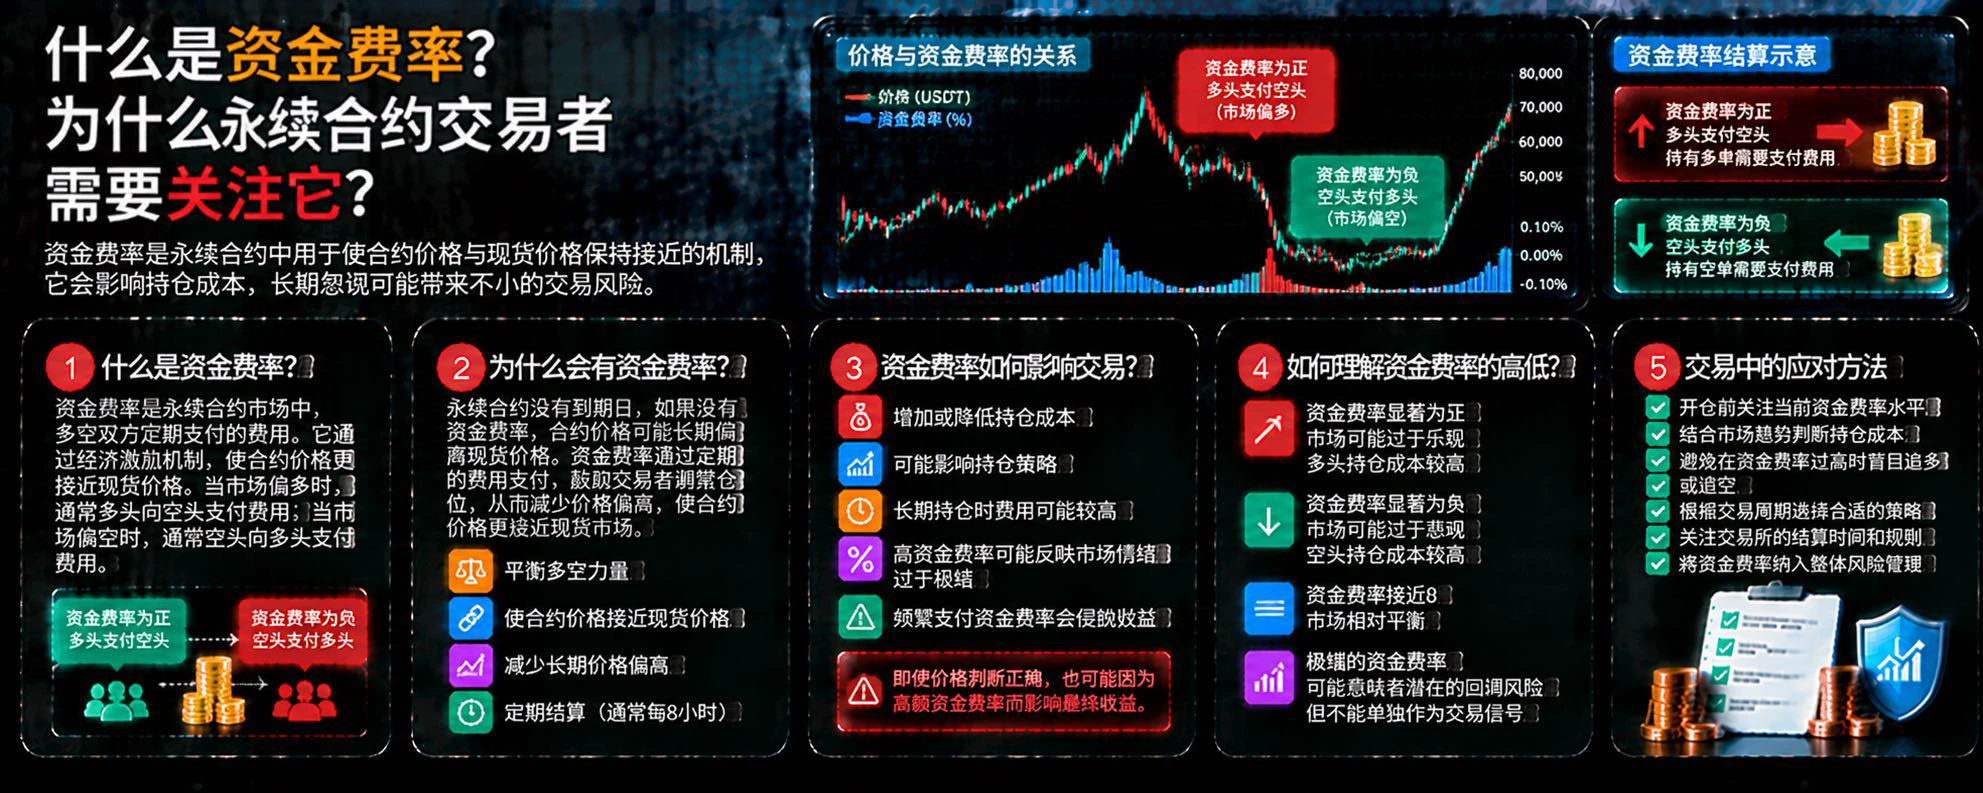
What Is a Funding Rate? Why Should Perpetual Contract Traders Pay Attention to It?

In the cryptocurrency market, perpetual contracts have no fixed expiration date. The funding rate mechanism helps keep contract prices relatively close to spot prices. For those who trade contracts frequently, the funding rate not only affects holding costs but can also offer clues about market sentiment.

First, what is a funding rate?

A funding rate is a periodic exchange of fees between long and short perpetual contract holders. Typically, when the funding rate is positive, longs pay shorts; when it is nega
post-image
Load More

Join 40 M users in our growing community

⚡️ Join 40 M users in the crypto craze discussion

💬 Engage with your favorite top creators

👍 See what interests you

Trending Topics

JensenHuangResigns

508.8K Views7.7K Discussing

Jensen Huang has resigned as NVIDIA CEO and stepped down from the board. CFO Colette Kress will serve as interim CEO while NVIDIA considers internal and external successors. $NVDA fell more than 10% in premarket trading following the announcement. With one of AI’s most influential leaders stepping aside, markets are now reassessing NVIDIA’s leadership stability, AI strategy, and long-term valuation.

GateIPOAccessAnthropic

276.3K Views2.6K Discussing

Dr.HanOxfordUnionSpeech

143.8K Views416 Discussing

View More