Share your thoughts
placeholder
Article
JUST IN: $400M+ HAS BEEN LIQUIDATED FROM THE CRYPTO MARKET
post-image
🇺🇸 CLARITY Act Could Be Delayed AGAIN
The U.S. House just canceled its final two September voting weeks, leaving lawmakers with only 4 days to get work done before the midterms.
That puts the CLARITY Act in a much tighter spot.
If the Senate changes the bill, the House may need to vote on it again. With so little time left, that could push the final decision into the November lame-duck session.
The bill isn’t dead. But right now, timing is the biggest problem.
post-image
#USELESSSurgesAnother67%
$USELESS
MOMENTUM IS STILL RUNNING
USELESS has once again become one of the most aggressive momentum stories in the market. After its explosive multi-day rally, the token is now trading around $0.22, following a powerful move that previously pushed price toward the $0.25–$0.28 region. The latest market data shows just how extreme the move has become: USELESS has gained roughly 250%+ over seven days, while 24-hour trading volume has expanded above $200M.
THE BIGGER PICTURE
What makes this setup interesting is that USELESS is not simply experiencing a one-candle pump
Falcon_Official
#USELESSSurgesAnother67%
USELESS is once again proving that small-cap momentum can move extremely fast. Around $0.24, the token has delivered another explosive move of roughly 67%, while the latest market data shows price pushing close to the $0.25 area. The move is especially notable because it follows an already powerful multi-day rally rather than coming after a long period of weakness. Current data also shows roughly $140M+ in 24-hour trading volume, meaning this is not simply a low-liquidity price spike.
From a technical perspective, the chart is extremely bullish but also extremely stretched. The RSI(14) is around 77 on one major technical snapshot, while another calculation has pushed RSI above 90. Either way, the message is similar: momentum is powerful, but buyers are operating in an overbought zone. MACD remains positive and moving averages are aligned bullishly, with the short-term averages sitting well below the current price. This combination confirms that the trend is strong, but it also increases the probability of sharp pullbacks after such a vertical move.
The most important level right now is the $0.25 psychological zone. Price reaching approximately $0.25 means buyers are testing a clean round-number resistance after the huge acceleration. A convincing breakout above $0.25, supported by sustained volume rather than only a quick wick, could open the way toward $0.258 and then the $0.30–$0.31 area. The latter becomes particularly interesting because technical resistance data places a major resistance zone around $0.312.
But there is another side to this chart. After a 67% surge, chasing the candle becomes much riskier than entering during the earlier breakout. The current price is significantly above its short-term averages: the latest technical data places the 5-day SMA near $0.20, the 10-day SMA around $0.19, the 20-day SMA around $0.176, and the 50-day SMA around $0.141. That distance tells us just how aggressively momentum has expanded. Strong trends can remain irrational for longer than expected, but eventually the market often returns to test previous breakout zones.
For me, the key battle is therefore not simply “can USELESS go higher?” but whether $0.20–$0.21 can become a new support zone. If price pulls back and buyers defend this region, it would show that the latest breakout is being accepted rather than completely rejected. Below that, the next meaningful technical area is around $0.176–$0.18, close to the 20-day average. A deeper correction toward the $0.15 area would still leave the broader recent rally intact, but losing that region with heavy selling would weaken the immediate momentum structure. Technical pivot data also identifies approximately $0.1498 as a support level.
The volume picture is equally important. USELESS has recently experienced a dramatic expansion in trading activity alongside its price appreciation. That is generally healthier than a huge move occurring on disappearing liquidity, but high volume can work both ways. If volume continues expanding while price holds above $0.20, it would support the continuation thesis. If volume becomes dominated by sellers around $0.25–$0.26 and price starts producing long upper wicks, that would be an early warning that momentum is becoming exhausted.
So the current setup is bullish trend + extreme momentum + elevated correction risk. The chart does not currently look like a normal slow accumulation; it looks like a momentum phase where candles can move several percentage points very quickly. RSI and ADX are warning that the market is overheated, while MACD and moving averages continue to confirm the underlying bullish trend.
At around $0.24–$0.25, I would watch three zones very closely: $0.25 for breakout confirmation, $0.20–$0.21 for immediate support, and $0.176–$0.18 for deeper trend protection. Above $0.25 with strong volume, $0.258 and then $0.30–$0.31 become the next technical areas to monitor. If $0.20 fails decisively, however, the market could need a cooling-off period before another serious attempt higher.
My technical view: USELESS remains strongly bullish, but after another ~67% surge, the risk/reward is no longer the same as it was at the beginning of the move. The next confirmation matters more than the size of the last candle. **A clean $0.25 breakout could extend the momentum toward $0.30+, while rejection followed by a loss of $0.20 would make a deeper correction increasingly likely.**
@Gate_Square
$USELESS ‌ ‌
repost-content-media
USELESS+0.02%
  • 5
🚨 #GateEventContractTradeSharingChallenge
What if one market idea could do more than just make you money?
What if the same trade could also help you build your reputation, grow your audience, and earn extra rewards?
That's exactly why I'm paying close attention to Gate Event Contracts.
This isn't just another trading activity.
It's an opportunity to turn your market knowledge into something valuable.
Whether you're bullish or bearish doesn't matter.
What matters is having a reason behind your decision.
📈 Every Great Trade Starts With One Simple Question
Instead of asking...
"Will the market
BTC-1.58%
ETH-2.34%
HYPE-2.17%
SOL-1.73%
It’s weekend proper
Gonna be touching some grass today while still trying to print from prediction market
We go again as usual
post-image
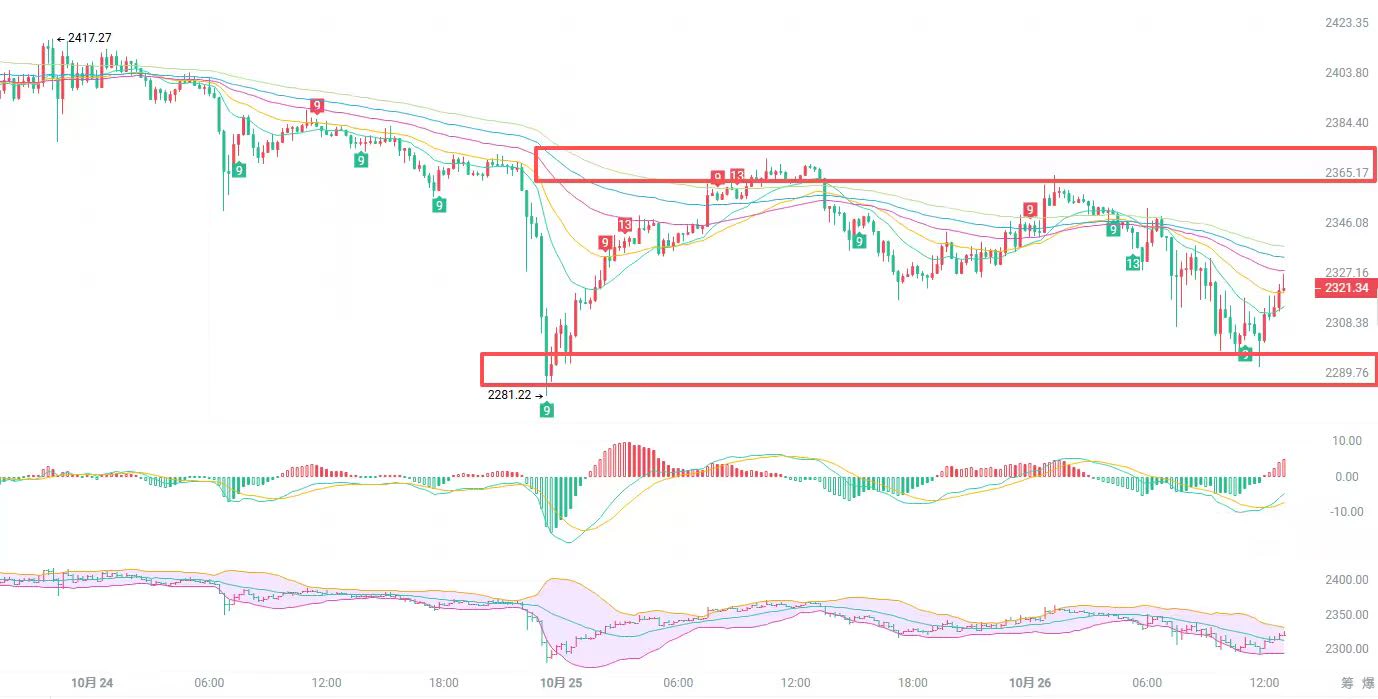
$ETH This long position has certainly paid off, but to be honest, the process was far from smooth. I entered at 2394.32, based on the fact that after breaking above the previous high, the pullback had not fully erased the gains, while the moving averages remained in a bullish alignment, so the logic for going long with the trend was sound. However, there was a rapid dip midway that wiped out most of the unrealized profit, and it would have been easy to get shaken out if watching the minute chart.

I did not make any moves at the time, because although that candlestick had a lower wick, it rec
post-image
ETH-2.35%
BNB-0.05%
XRP-3.22%
$SOL Signal】4H death cross + order book sell pressure, short attack
$SOL 4H MACD death cross in progress, with the price below and hugging EMA20. Sell pressure dominates the order book, with a depth imbalance of -5.93% and a bid-to-ask ratio of 0.89. The 1H Bollinger Bands are narrowing, volatility is contracting, and a short-term reversal point is approaching.
🎯Direction: short
⚡Entry/limit order: 101.6641 - 101.9700
🛑Stop-loss: 102.9897
🚀Target 1: 100.4404
🚀Target 2: 99.6757
🛡️Trade management: - Reduce the position by 50% upon reaching Target 1 and move the stop-loss up to breakeven.
post-image
SOL-1.72%
BTC-1.58%
ETH-2.34%
new market update
live-cover
LIVE729
TODAY CRYPTO MARKET TRENDS
live-cover
LIVE990
#ZEC Zcash is the only cryptocurrency in history whose price has ever surpassed Bitcoin’s
Zcash (ZEC) is a fork modified from Bitcoin version 0.11.2 code. It retained Bitcoin’s original model and was released on October 28, 2016.
Zcash is an anonymous coin, a special blockchain token that hides the transaction amount, sender, and recipient during transactions. In contrast are “transparent coins” such as Bitcoin and Ethereum. Major anonymous currencies include Dash, Monero, and Zcash. It aims to create a truly anonymous transaction method and is a decentralized, open-source cryptographic curren
ZEC+6.47%
BTC-1.58%
ETH-2.34%
DASH+43.24%
XMR0.00%
  • 1
“Content Creators” Among 60 Million
Among Gate’s 60 million users, I probably belong to the group that “loves writing.”
I like posting on the Square. Writing market analyses, sharing trading experiences, and reflecting on lessons from losing money. Sometimes, after finishing a post and reading it again, I think, “So this is what I was thinking at the time”—writing is the best way to review and reflect.
And there are genuinely people on the Square who read, comment, and tip. That feeling of “my views have been seen” makes me even happier than making money from trading.
Each of Gate’s 60 million
MU+5.89%
Longed $29m of $BTC
Free Signals:
post-image
BTC-1.59%
Goldman Sachs: The yuan is expected to appreciate by 3% to 5% annually and may rise to 5.5 per U.S. dollar in five years.
Please, really don’t let it rise anymore. bitcoin:native was cut in half over the past year, and the $USDT I’m holding also fell 10%. With it going up and down like this, I’m getting wrecked.
I miss when $U was still around 7.3. Trump, put in some effort. 😭
post-image
BTC-1.58%
$AKE bought the dip and pumped it again.
AKE+16.18%
These returns have me feeling nervous, worried the market will wake up tomorrow and blacklist me.
A few days ago, the last thing I checked before bed was the chart. $SNDK pulled back to around 1500.51 and stopped moving. It was bottoming out without breaking support, while funds were still quietly entering. I felt this level had potential, so I casually opened a long position.
The first thing I did after waking up was check my phone: 1771.62 had shot up, and +1282.92% was in the bag. After dragging on for so long, seeing it finally break out feels incredible.
Don’t rush to add to your positio
post-image
SNDK+12.32%
ETH-2.35%
ZEC+6.55%
$SKUU 24h trading volume is only $2.6 million, yet I watched it surge from 22.9 to 27.0 before being slammed back to 26.6. This is not a candlestick chart retail traders could draw. The market maker’s script usually unfolds in three steps: first, sweep up all the weak hands at low prices—the high-volume bullish candle in the morning was the signal; next, push it up and distribute, with the fake breakout at 27.08 in the afternoon likely leaving most followers stranded at the top; finally, this consolidation at the current level is waiting for the next batch of bagholders to enter.
My move is si
SKUU+13.44%
September 5 Bitcoin and Ethereum Market Analysis
After a sharp pump, Bitcoin and Ethereum have entered high-level distribution and choppy consolidation.
What is most tormenting now is not a major drop, but repeated wick moves.
A slight rise sparks fantasies of the bull market taking off, while a slight drop triggers panic over a collapse. Leverage traders are most likely to get hit from both sides.
There is no one-way trend in the short term. The focus is on repeatedly washing out weak hands. Keeping your hands off and not chasing highs is the first rule.
Focus on 3 key factors
1. Federal Rese
post-image
BTC-1.58%
ETH-2.34%
Brother Tong’s 9.5 BTC plan
Enter shorts around $BTC 798-803, stop-loss 808, first target 788, second target 780.
Current price: 79514. Yesterday’s nonfarm payrolls data exceeded expectations, and longs took a direct hit, with the price crashing from 813 all the way to a low of 786 without even a decent rebound. Data is data—the market voted with its feet.
It is now hovering around 795; don’t get itchy just because it has fallen a lot. A rebound to the 798-803 zone is where shorts can add to their positions. The data’s bearish impact has not been fully digested yet, so don’t fight the data.
Th
post-image
BTC-1.59%
$MUBARAK is breaking out heavy supply zone on 1d timeframe 👀
Expecting 150%-250% Bullish Rally 📈
Free Signals:
#Crypto #MUBARAK #MUBARAKUSDT #MUBARAKCoin #cryptocurrency
post-image
MUBARAK-0.08%
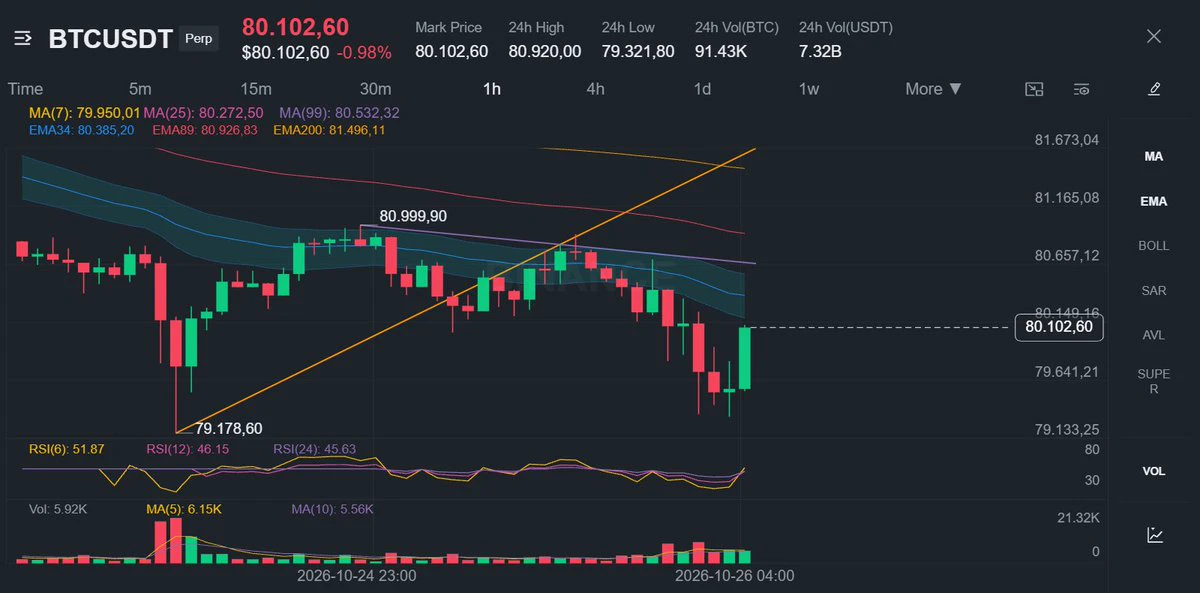
BTC just reclaimed $80,000 before getting knocked back down—the bulls have it tough
Now that we've covered the data, let's talk about what everyone cares about most—Bitcoin.
Just one day before the nonfarm payrolls data was released, BTC had reclaimed $80,000. U.S. Treasury yields fell and the dollar weakened, finally giving risk assets some breathing room. But as soon as the nonfarm payrolls data came out, BTC was hit hard. It fell as much as 2.8% intraday, touching $79,197. The $80,000 threshold was breached again.
Ethereum was not spared either, falling below $2,500. More than 120,000 trade
MU+5.89%
Load More

Join 40 M users in our growing community

⚡️ Join 40 M users in the crypto craze discussion

💬 Engage with your favorite top creators

👍 See what interests you

View More