Square
Following
Hot
News
Notifications
Profile
Share your thoughts
placeholder
Article
I know someone wants to see this in their wallet
post-image
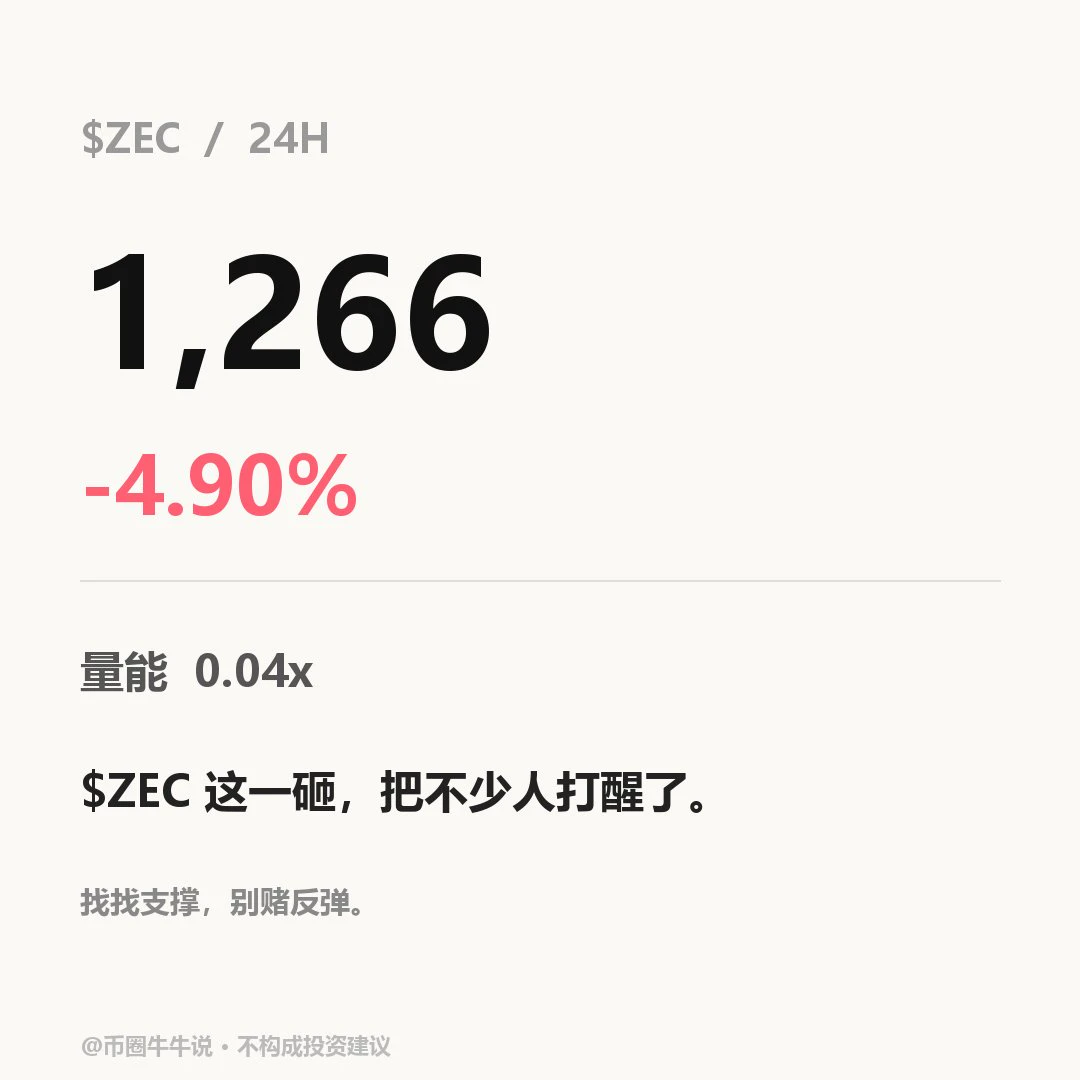
$ZEC Current price: 1265.77, 24H -4.90% (1235.00–1334.33). 1H is weak, with RSI 46.20/EMA20 1270.67, support at 1235.00/resistance at 1330.1; 4H is weak, with RSI 46.77/EMA20 1280.98, support at 1213.56/resistance at 1387.89. A sustained move above the 1330.1 resistance level is meaningful; a break below the 1235.00 support level would signal further weakness. Review whether price holds above 1330.1 and whether it recovers after losing 1235.00; volume is only 0.04x, and the setup is invalid without confirmation from participation. Market volatility is high; for observation only.
post-image
ZEC+1.16%
Trenches
ZIG
Z
bade
b
ZIG
0x8c...1145
Market Cap
$.
Change
.
24h Vol
$.
Holders
.
STONK
S
bade
b
STONK
6GmA...UNgx
Market Cap
$.
Change
.
24h Vol
$.
Holders
.
IDOL
I
bade
b
IDOL
0x3b...ab07
Market Cap
$.
Change
.
24h Vol
$.
Holders
.
BTC
B
bade
b
BTC
C5xp...pump
Market Cap
$.
Change
.
24h Vol
$.
Holders
.
FLOAT
F
bade
b
FLOAT
Bv1a...BMmr
Market Cap
$.
Change
.
24h Vol
$.
Holders
.
$AIN saw an $8.03K long liquidation near $0.1401, highlighting downside pressure as leveraged buyers were forced out. This could represent a liquidity sweep, but buyers need to defend demand and reclaim the previous breakdown area. Until then, the short-term structure remains cautious.
Support: $0.1370 – $0.1340
Resistance: $0.1430 – $0.1470
Next Target: $0.1520
Confirmation: A strong reclaim above $0.1430 could indicate buyers are returning. Losing $0.1340 would increase bearish continuation risk.
Let's go $AIN 🚀
post-image
AIN+3.85%
Featured11.8 Weekend Morning Market Overview: Sideways Trading Over the Weekend—Get Some Rest

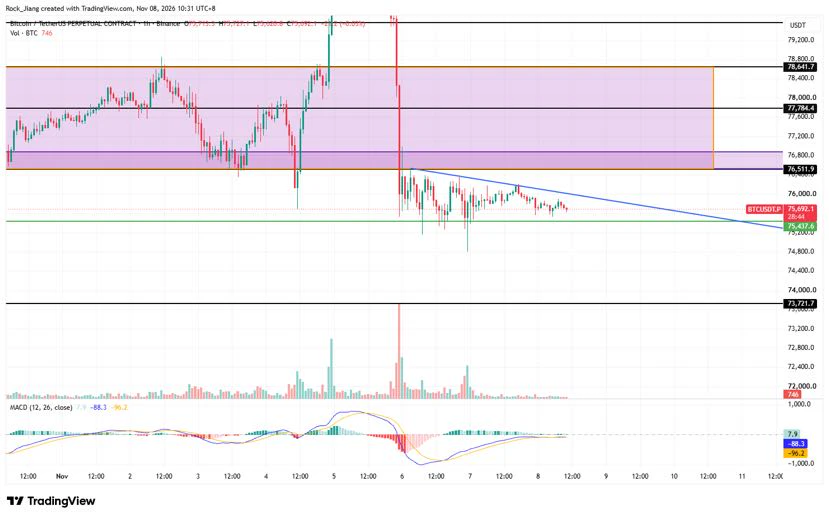
BTC formed a doji this morning and is trading sideways near the lows

BTC is in a descending converging triangle pattern. As time passes, 7.54 and the descending trendline are converging, showing signs of a rebound

BTC has retested 7.54 several times, and the candlestick bodies have not broken below it, so support is holding for now

Resistance is above 7.65. Support and resistance have switched roles. A bullish rebound is only likely if the price breaks above 7.65 and holds; otherwise, expect c
post-image
BTC-0.65%
  • 5
Crypto friends, eat and drink as usual, and take a walk when you can
This is small stuff—we’ve weathered all kinds of storms
The market will come back
morning market update
live-cover
LIVE2,024
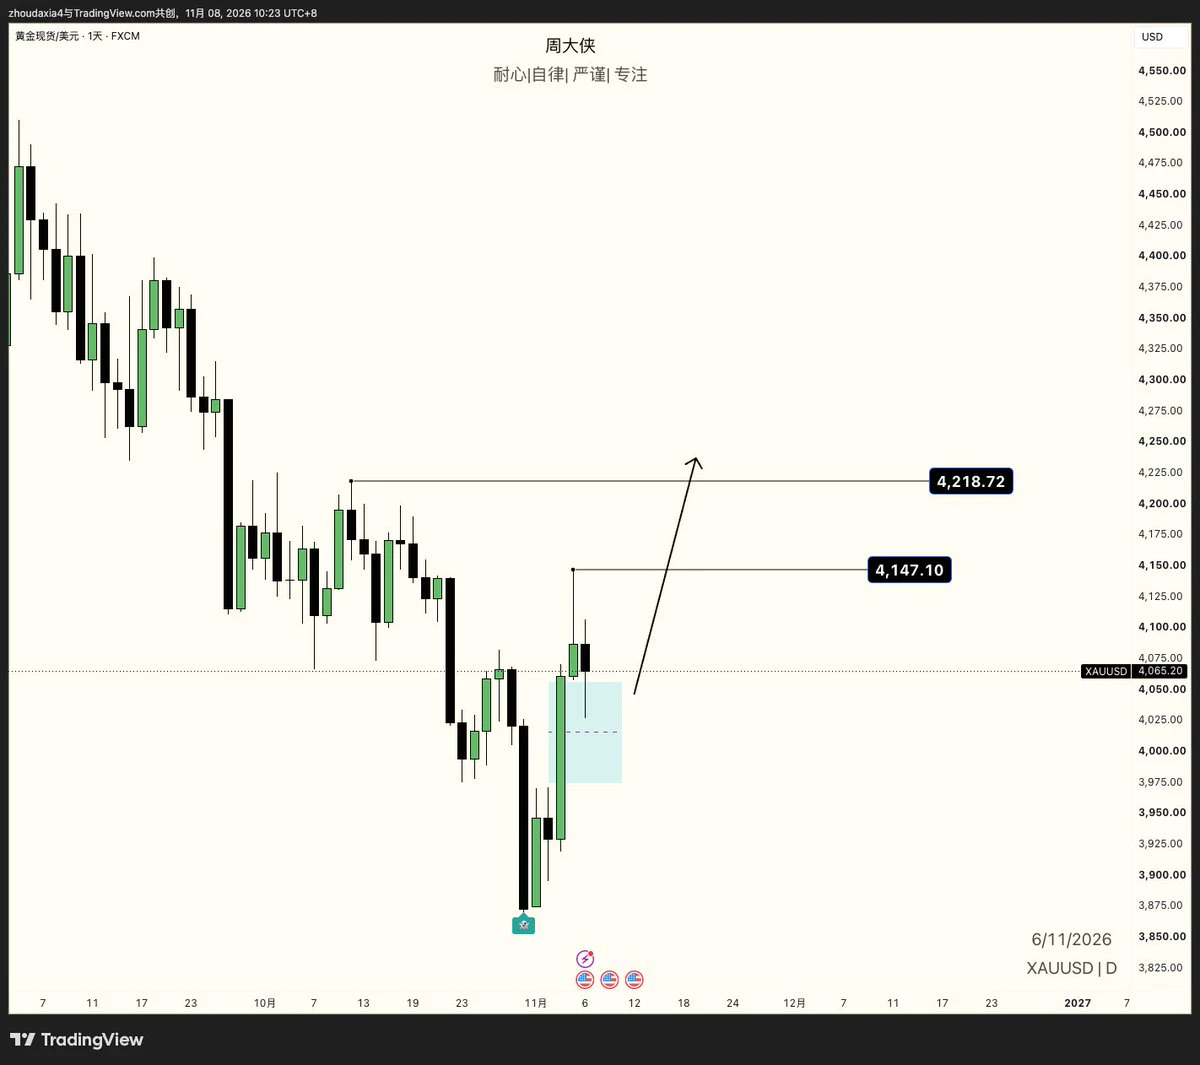
Gold daily chart bullish bias vs. weekly chart bearish bias. #XAU
post-image
GLDX-0.40%
PAXG+0.37%
XAU+0.38%
  • 1
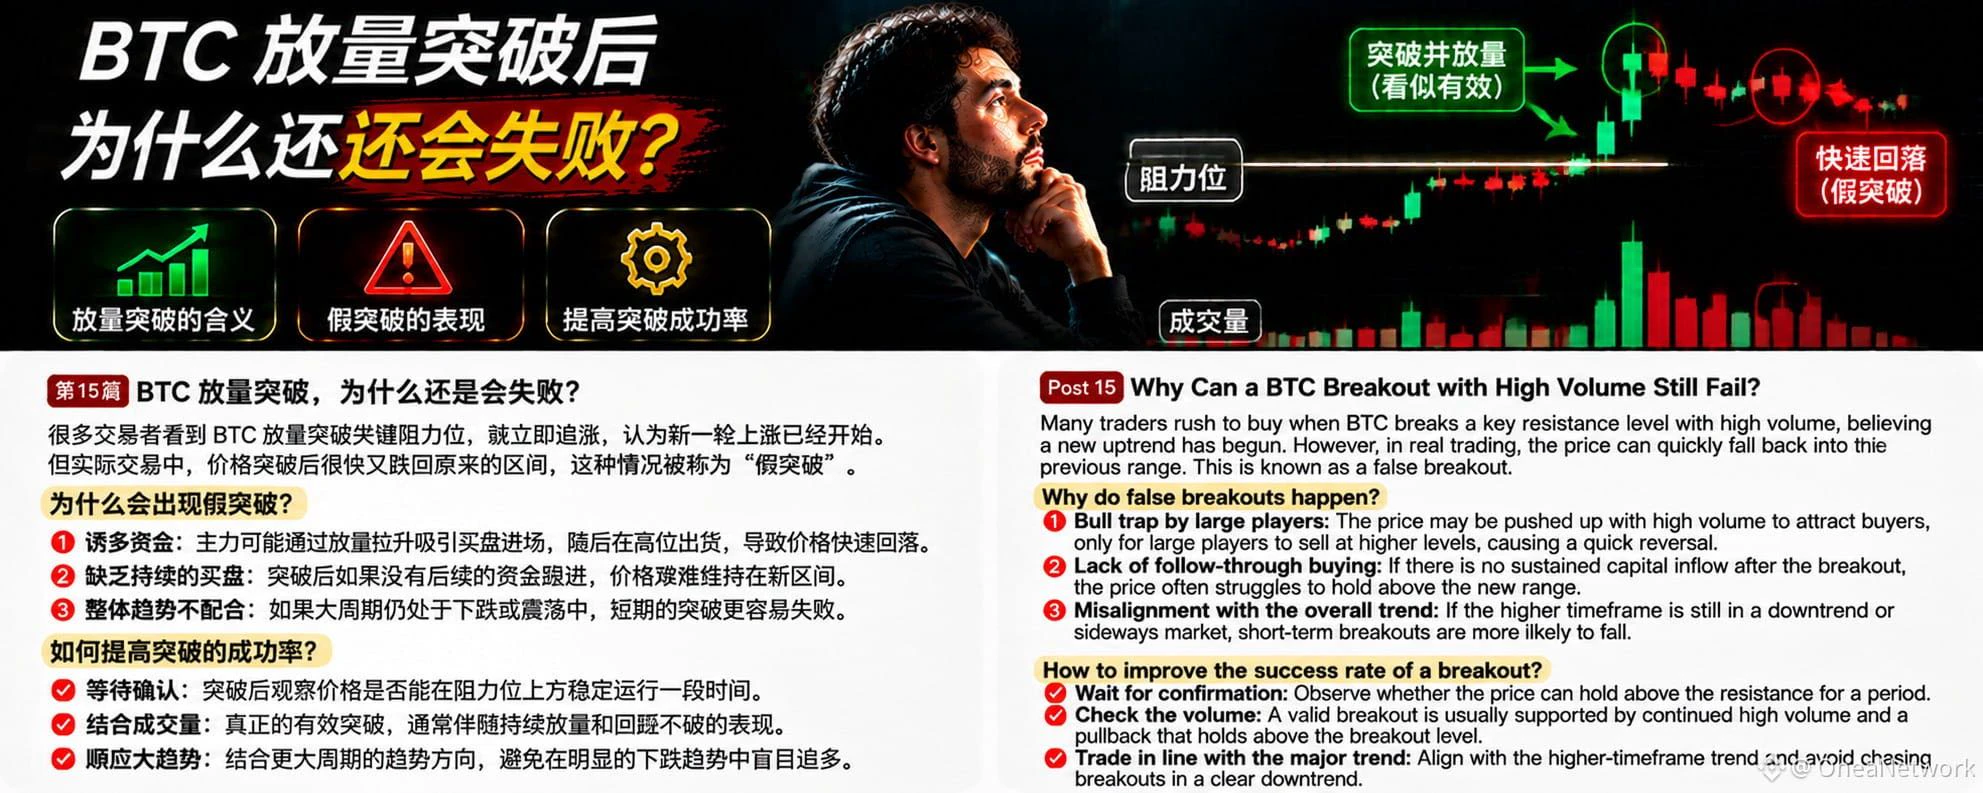
Many traders see BTC break above an important resistance level on high volume and immediately chase the rally, believing a new uptrend has begun. But sometimes, after breaking out, the price quickly falls back into its previous range, catching those who just entered off guard. This is commonly called a false breakout.
Why can a high-volume breakout fail?
First, buying lacks follow-through. A large amount of capital may enter at the moment of the breakout, but if no new buyers follow, it is difficult for the price to hold steadily above resistance.
Second, there is strong selling pressure at th
post-image
BTC-0.67%
Funds from sanctioned (platforms) cannot get in, and this has caused quite a stir lately. Double-check before transferring money, then proceed ✅
post-image
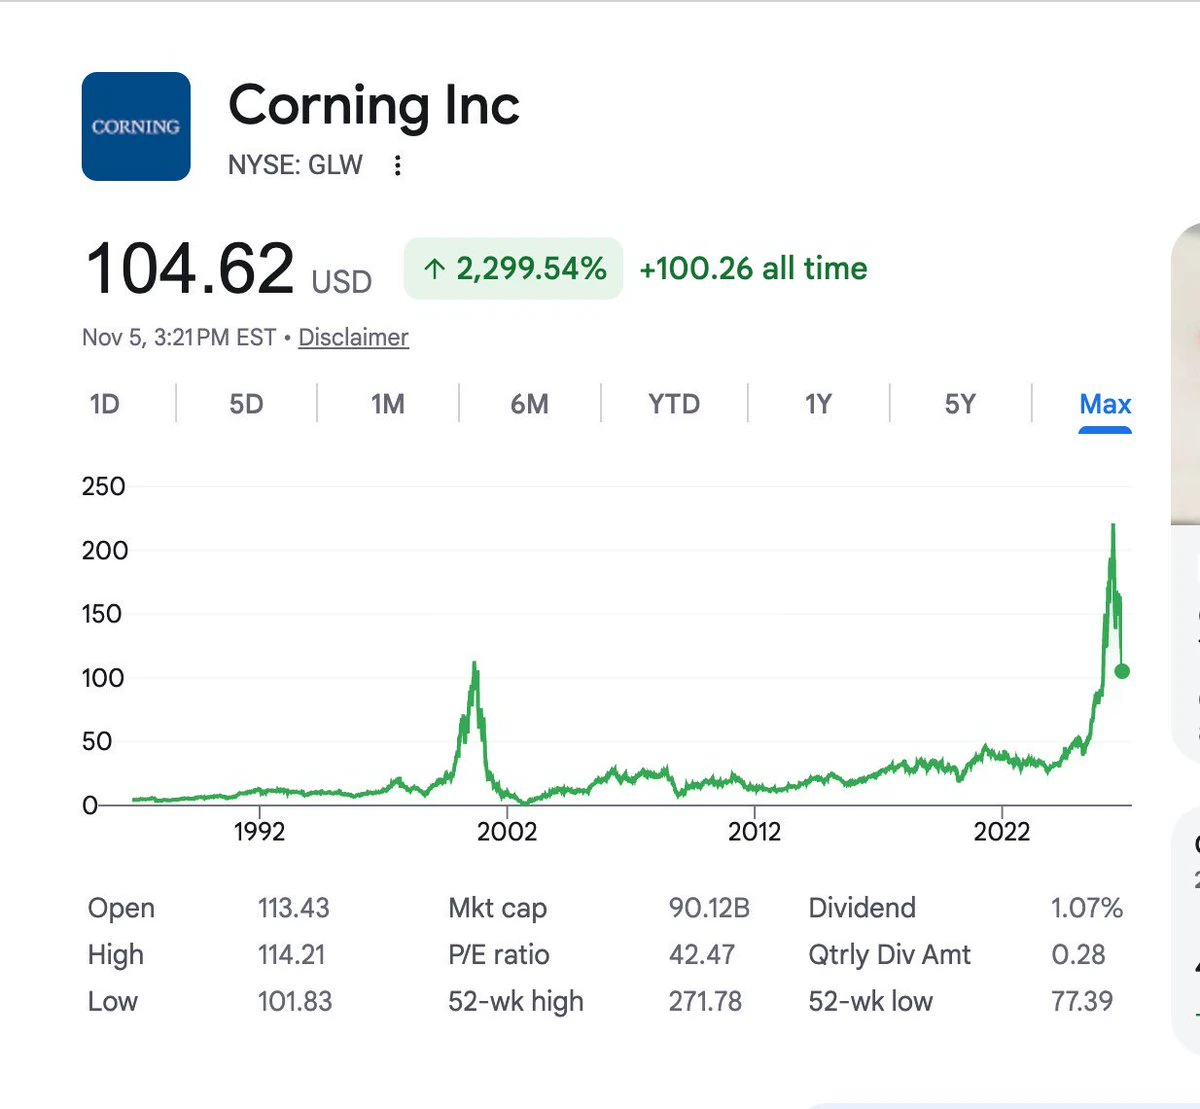
Bulls, take a look at this candlestick chart
You tell me, after falling from such a sharp peak
can the stock price return to a bull market and make new highs?
Does this comply with the basic laws of physics?
Thank you, everyone
post-image
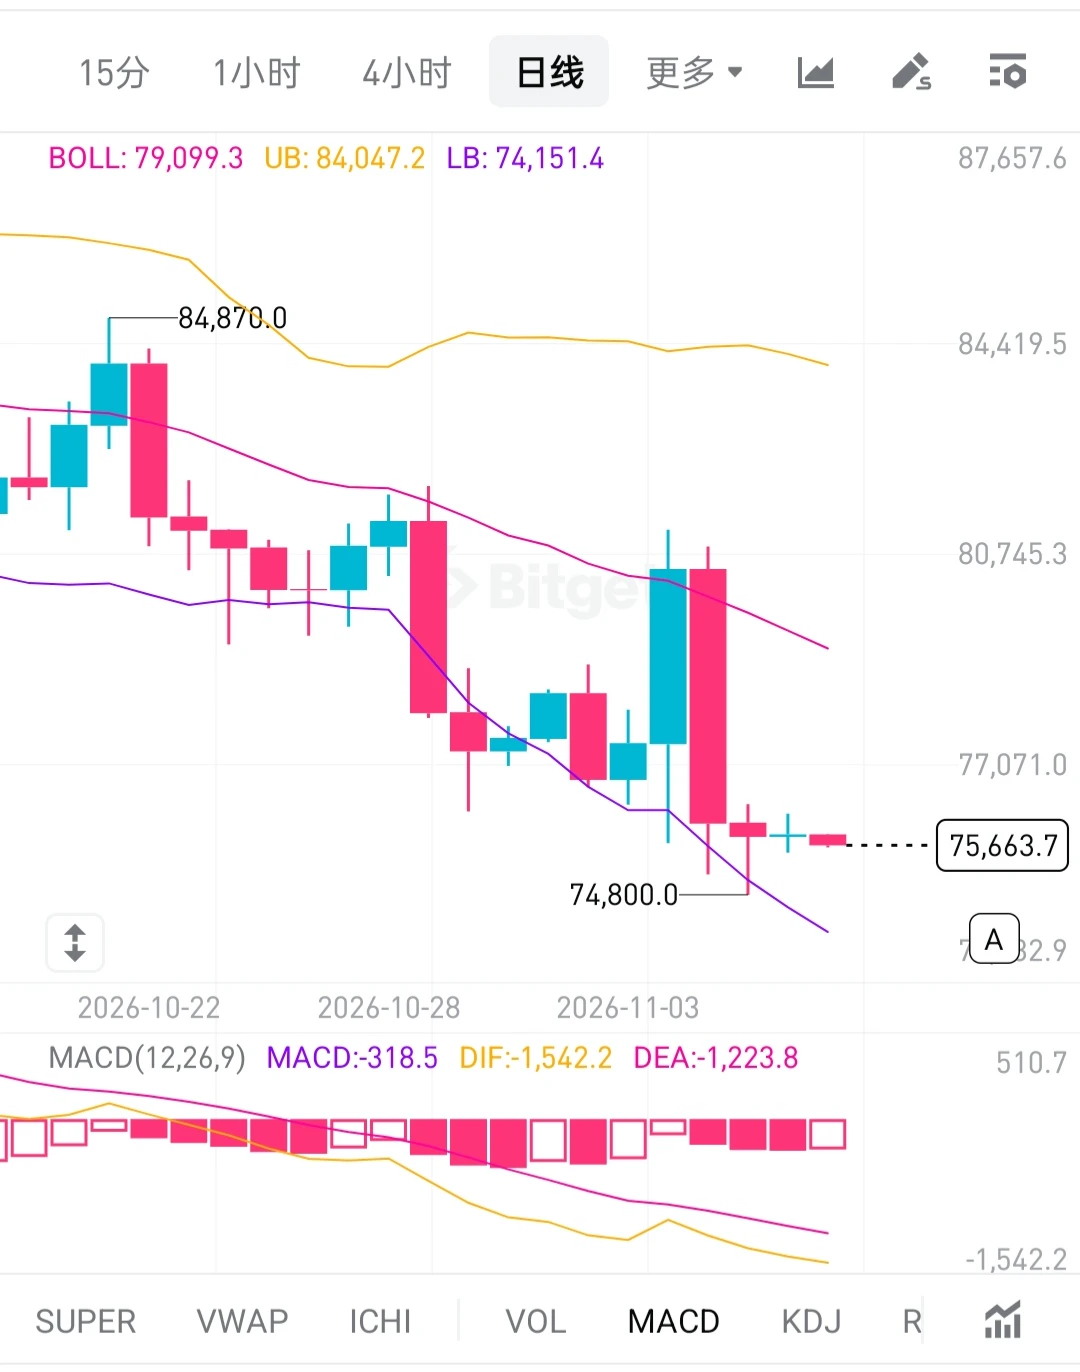
Bitcoin for 11/8:

On the daily chart, the price is currently below the BOLL middle band and near the lower band, with support at the previous low of 74800. The broader bearish trend is clear. After reaching a low, the price has temporarily stopped falling and entered a period of sideways consolidation.

The MACD indicator’s DIF is below DEA and remains negative. The bearish structure has not reversed; downside momentum has only temporarily slowed. Focus on the 74800–74150 support zone. If support holds, a short-term rebound may offer a trading opportunity, with the BOLL middle band as the fir
post-image
BTC-0.67%
‍#每周来晒 #广场交易达人 #WCTCS9

Next Week's Crude Oil Trading Plan

Crude oil posted its biggest weekly drop in six years last week, confirming a double-top pattern. I expect it will likely rebound early next week, and my trading strategy is to go long first, then short:

1. Crude oil long:

Planned entry: around 97

Stop-loss: 92

Take-profit: around 105

2. Crude oil short:

Planned entry: above 105

Stop-loss: 111

Take-profit: Hold for the long term $XBRUSD
post-image
XBRUSD-1.42%
When BTC shows bearish divergence, does it mean a decline is imminent?
In BTC technical analysis, bearish divergence is often seen as a warning that an uptrend may be weakening. But many traders rush to short as soon as they spot bearish divergence, only for the price to keep rising instead of falling, ultimately getting caught on the wrong side of the market.
So how should bearish divergence be interpreted?
First, understand the basic principle of bearish divergence. When the BTC price keeps making new highs, but the peaks of the RSI or MACD gradually decline, bearish divergence may be formin
post-image
BTC-0.67%
165,000 jobs stun markets! Fed December rate hike probability hits 77.7%—rate-cut hopes dashed?

Investors had just gotten ready to pop champagne for a year-end rally when U.S. nonfarm payrolls suddenly poured cold water on things.
The U.S. added 165,000 nonfarm jobs in October, well above market expectations. The strong labor market has renewed concerns that the Fed may continue to maintain its tight policy.
Even more striking, the probability of a December rate hike reportedly rose to 77.7%.
What does this mean? Investors who had been expecting monetary policy to turn dovish may now need to
MU+4.71%
No wonder they were X's former product lead—they really know their stuff.
We now have:
1. CME Group listing ADA futures
2. Germany's DZ Bank letting Volksbanks and Raiffeisenbanks offer ADA to their customers
3. The Cardano Foundation in Mastercard's Crypto Partner Program
@Cardano
CME-0.40%
ADA-1.41%
MA-0.42%
Consecutive big wins 🤩🤩 trades that made big profits today $ONE & $AKE
No risk, no money 😁 keep shorting 🥂
post-image
ONE-1.19%
AKE+6.07%
Aero is making a serious move on Arbitrum's DeFi landscape. 👀

Following the merger, trading activity on Aero has surged significantly, pushing it into the position of Arbitrum's second-largest DEX, with only Uniswap ahead.

This is an important development because DEX growth is not just about rankings. Sustained trading volume, liquidity and user activity are what really matter when evaluating an ecosystem's expansion.

If Aero can maintain this momentum, it could become an increasingly important player in Arbitrum's DeFi market.

The real question now is whether this growth is just a post-m
ARB+1.17%
AERO-2.98%
  • 1
🔥 $ZEC /USDT – Bears Are Losing Control or Is This Just a Trap?

I'm watching $ZEC closely because the 15-minute chart is showing an important battle around the $1,250–$1,265 zone.

After getting rejected from the $1,387 high, ZEC has experienced a clear downside move, forming lower highs and lower lows. However, buyers are now attempting to defend the $1,247 support area. A successful recovery could trigger a short-term bullish reaction, but confirmation is still needed.

🎯 Entry Level: $1,255 – $1,267

🥇 TP1: $1,280

🥈 TP2: $1,300

🥉 TP3: $1,325

🛑 STOP LOSS: $1,242

⚡ Key Level to Wat
ZEC+1.16%
Eth market update
live-cover
LIVE1,889
Load More

Join 40 M users in our growing community

⚡️ Join 40 M users in the crypto craze discussion

💬 Engage with your favorite top creators

👍 See what interests you

Trending Topics

USCPIDataIncoming

1.04k Views1.48k Discussing

The U.S. October CPI report will be released on November 10 at 8:30 a.m. ET. September CPI came in at 3.7% year over year, and markets will be watching closely for signs that inflation is cooling, especially in core CPI. A softer-than-expected reading could strengthen rate-cut expectations, while hotter inflation may pressure risk assets through higher Treasury yields and a stronger dollar. How do you think this CPI print will move $BTC, U.S. stocks and gold?

USAIStocksHitHard

23.56k Views3.69k Discussing

USNonfarmPayrolls

40.34k Views4.38k Discussing

View More