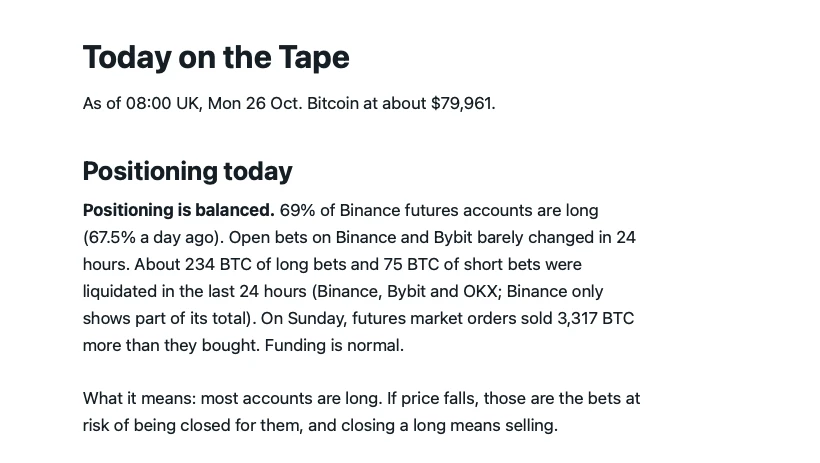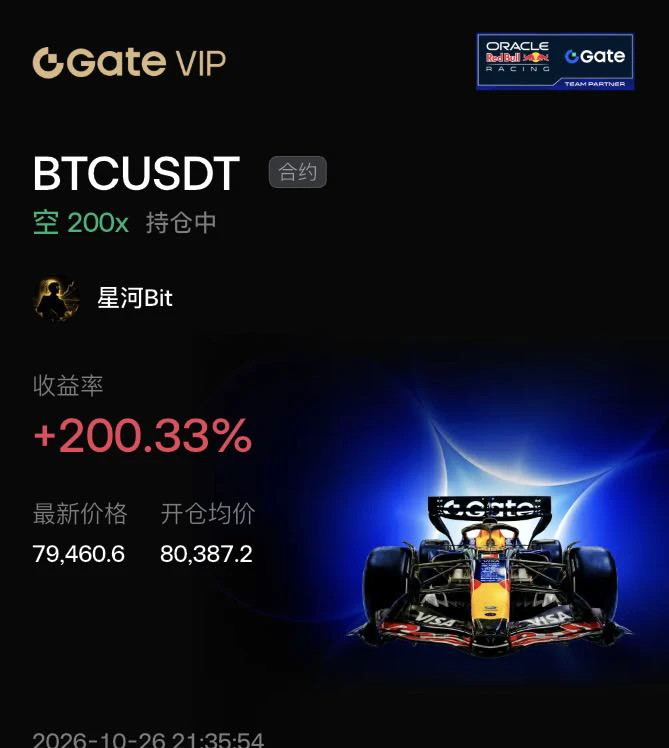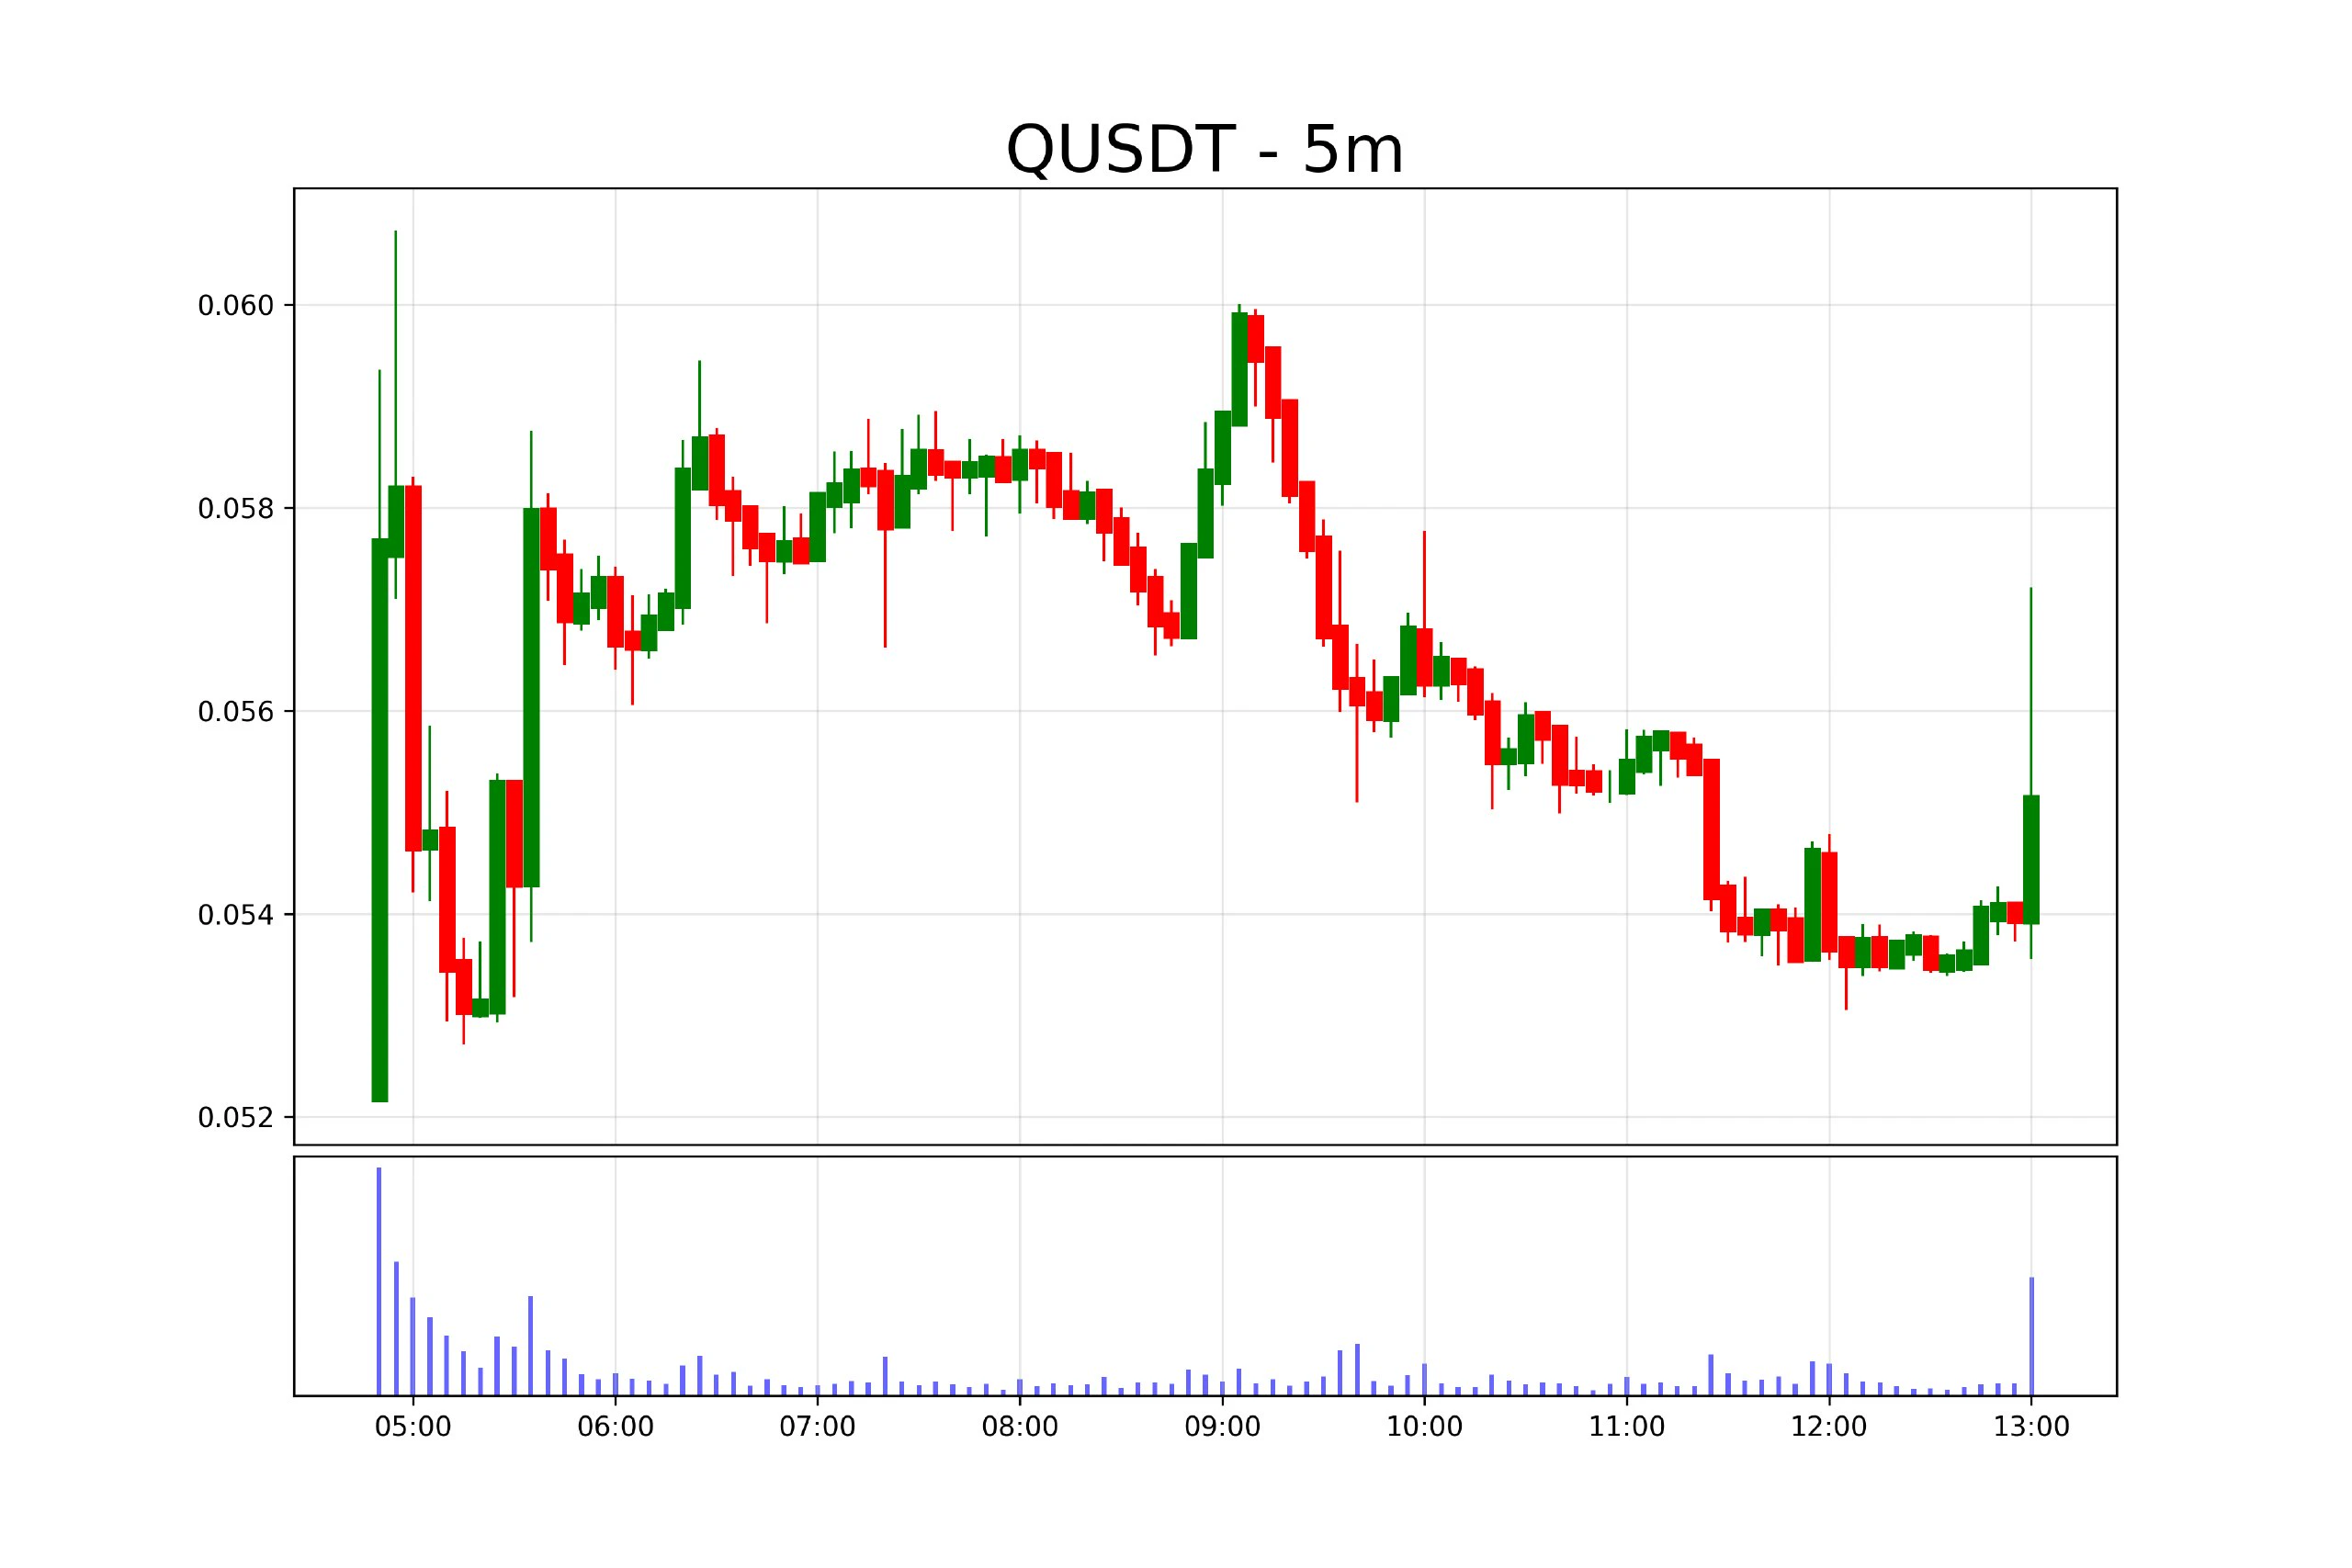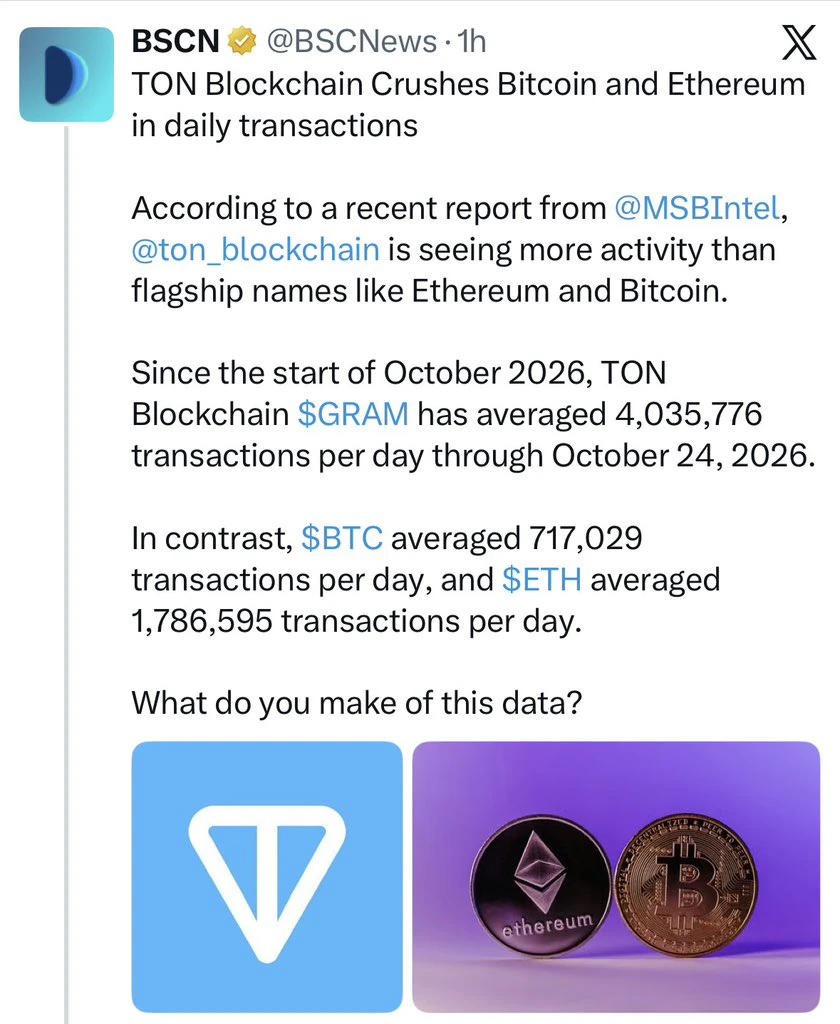




Share your thoughts
placeholder
Article
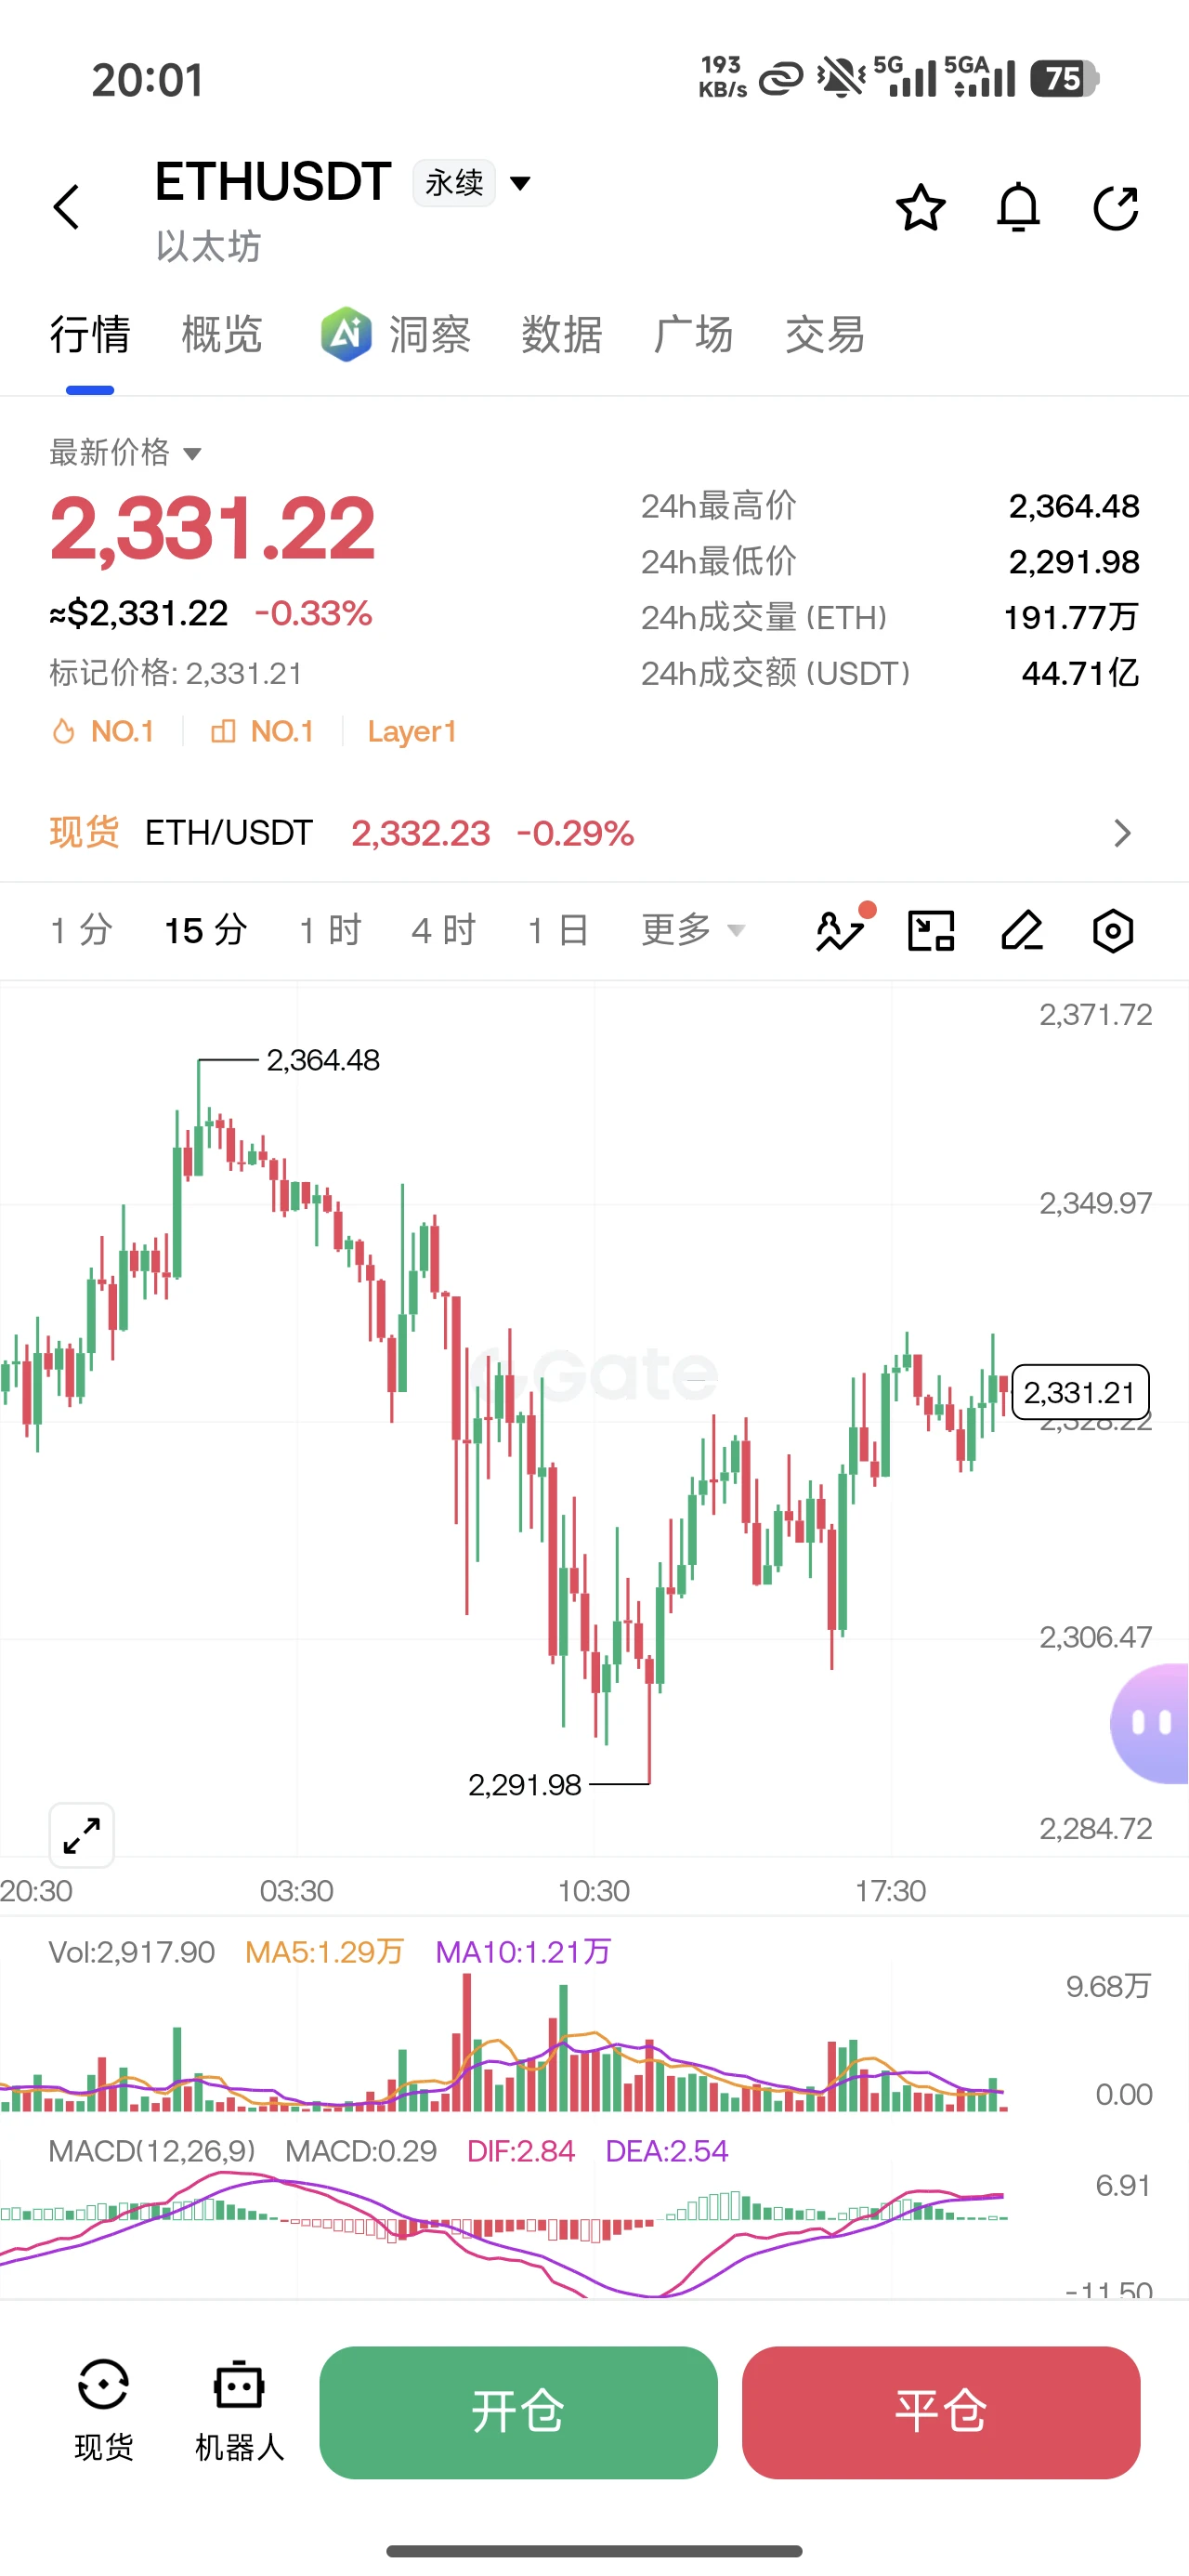
$ETH Signal】Longs are absorbing the pullback, with 1H funds providing support
$ETH 1H order book depth imbalance at 81.01%, buy/sell ratio at 9.53, with extremely thick buy orders below 2630.
RSI 1H at 61.40 and 4H at 64.99—hot but not overheated. MACD 1H positive bars are shortening, while 4H negative bars are narrowing. The 1H Bollinger midline at 2598 is rising, and the 4H midline is at 2580; the bullish EMA20/50 alignment remains intact. Funding rate at 0.0083%, OI stable, and low long-side crowding. The current price is just over 1% from the stop loss, with a risk-reward ratio of 1.5 and
post-image
ETH+0.09%
Found myself in a cat/stonk coin/nft project w the leaders of the stonk meta and the leader of the cat meta. Probably nothing…
post-image
STONK+18.34%
Layout for Bitcoin, Ethereum, and Dogecoin
live-cover
LIVE1,645
$LTC LTC straight to $100 after breaking $60
LTC update on the daily chart. Everything is bullish. Oscillator indicators up to trending indicators.
We can clearly see on the daily chart that we have a resistance level around the $60 range, and soon we will try to break it. After a successful breakout, LTC will immediately teleport into the $100 range
Plus, we have a Buy signal below the resistance area, and the EMA Ribbon indicator has flashed bullish after being bearish for a long time. That means buyers are stepping in, and we are currently making HH-HL, which is a beautiful structure for a
post-image
LTC+1.58%
☀️ 9/21 Zuo Zuo Morning Brief
Macro/Current Affairs|As of 07:00, news that has not passed real-time cross-verification will not carry over yesterday’s narrative.
U.S. Stocks|Verification of the drivers behind the latest close is not yet complete; do not force-fit reasons for gains or losses.
post-image
$ENA enausdt short
INSTRUCTIONS TO READ AND TO FOLLOW:
Entry point: yellow
Stop loss: red
Take profit: green or blue
Leverage x 5-10-20 for crypto
Leverage x 20-50-100 for commodities, stocks, indices, and forex
Margin 1-5% max:
This limits your maximum loss to 5% and guarantees that you retain 95% of your portfolio in the event of a stop-loss.
ALWAYS PRACTICE RISK AND MONEY MANAGEMENT:
Invest a maximum of 5% on any trade or across all your trades.
Invest only what you can afford to lose, as no one is in control of the market.
I repeat: this limits your maximum loss to 5% and guarantees—or rat
post-image
ENA+8.22%
I had already finished complaining to my friends about this week’s market, but now I have to take it all back. A bit awkward.
A few days ago, when the price pulled back that afternoon, I saw $SNDK hold steady and buying pressure strengthen, so I suggested entering a long position around 1651.78. From 1651.78 to 1773.12, +521.61%—those who got in should be waking up laughing.
Don’t let profits inflate your ego, and don’t despair over a drawdown. Managing risk in advance is called rationality; cutting losses only after losing is called cutting off an arm to save the body.
Take profit on 80% fir
post-image
SNDK+0.35%
BTC-0.10%
ZEC+2.75%
BNB is about to print its biggest move of the year and most traders are not ready.

$BNB /USDT - LONG

Trade Plan:
Entry: 767.97 – 770.53
SL: 756.97
TP1: 778.46
TP2: 784.61
TP3: 793.82

Why this setup?
Why now? The daily trend is firmly bullish, setting the stage for continuation. The 1h ATR of 5.12 shows active volatility that can fuel a sharp push toward the targets. The 15m RSI at 63.84 confirms momentum is intact without being overbought. The entry zone between 767.97 and 770.53 offers a precise risk-controlled entry, with TP1 at 778.46 and TP2 at 784.61 defining the immediate upside. T
post-image
BNB+1.56%
Everyone’s hyping AI startups, but I haven’t seen enough reason to. Even Anthropic’s co-founder said the pressure from this AI wave is all resting on the shoulders of a few founders, and they still need to learn from the social media crowd to avoid repeating the same mistakes. The on-chain relationship logic behind social graphs applies to AI too: price gains without volume are just smoke and mirrors. The volume will have to catch up sooner or later. What have you observed on your end? From where I stand, the founders look like they’re about to buckle under the pressure. Keep an eye on the one
post-image
( new streamer) market overview
live-cover
LIVE14
The second day of recovering, I made over 100 points, but the position was small, so there wasn’t much profit. It’s no comparison to before I got chopped; just keep working at it.
Hard to believe, right? This is a ¥4 breakfast. Without a stop-loss, I only deserve a simple meal. 😂
Trading with ant-sized capital—“plain and unremarkable” is truly an apt description. Anyone else here in the same boat?
In life, setbacks happen.
You fail at something or didn't get the results you wanted.
And then you're frustrated, upset.
This is a SIGN that you need to CHANGE something.
Don't fall into the trap of "Okay, I must get back up and keep going"
Because otherwise you can keep failing forever with this mentality.
You take the pain and the frustration, and instead of just digesting it, you make a PLAN and change everything.
Because if everything was going fine, you wouldn't be hurt by this setback in the first place.
Always adapt.
post-image
SpaceX’s stock price has fallen by approximately 33% from its post-listing high.
It previously reached a valuation of nearly $2.8 trillion. After this pullback, Morgan Stanley maintained its bullish outlook and set a price target of $300, mainly citing growth in its AI computing business.
The fact that a rocket company’s valuation anchor has shifted to computing power is itself more noteworthy than the decline. When the market uses an AI ruler to measure an aerospace company, its volatility naturally begins to move to the rhythm of AI.
Click the group link below for my gate group and join us t
post-image
SPCX-1.29%
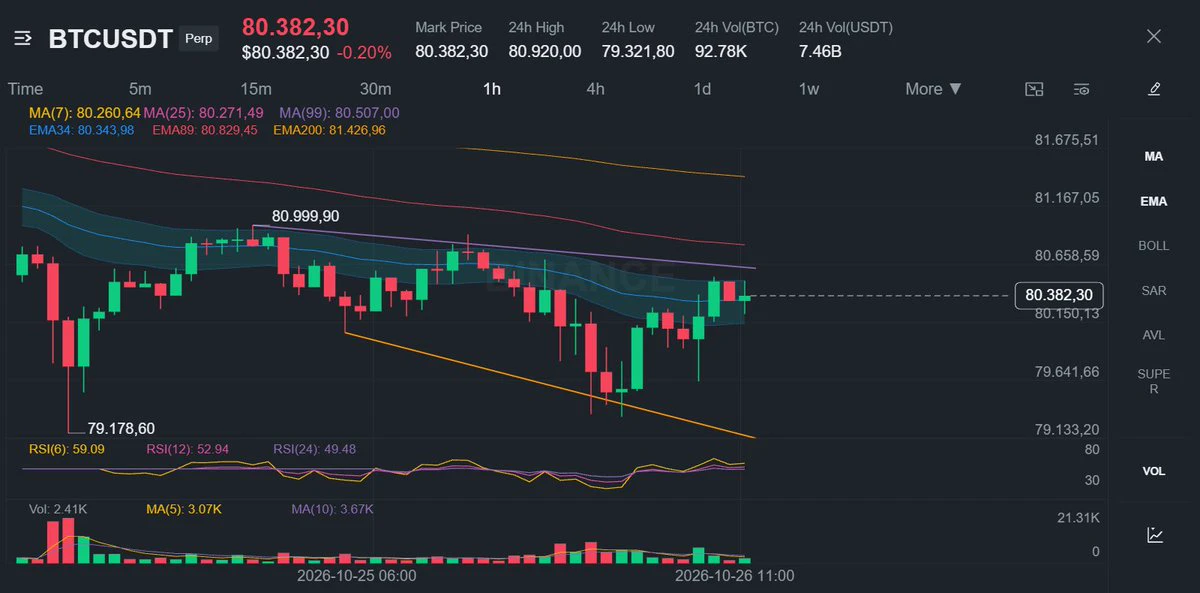
$BTC BTCUSDT 5m - Retest of 80883-81097 supply after liquidity sweep,
Market structure analysis combining lower-high sequencing, a bearish order block, and a liquidity sweep for short-side confirmation.
Context: price rallied from a 80173-80456 base into a breakout leg that topped near 81500, then began printing a clear sequence of lower highs (81500, 81464.7, 81431.8, 81282.3, 81231.5).
Key levels: a bearish order block sits at 80883-81097, formed by an impulsive candle that swept liquidity down to 80588 before closing mid-range; this zone now acts as fresh supply on any retest.
Scenario: fav
post-image
BTC-0.10%
Everyone watching ONDO is about to miss a massive move up

$ONDO /USDT - LONG

Trade Plan:
Entry: 0.4252 – 0.4296
SL: 0.4062
TP1: 0.4433
TP2: 0.4539
TP3: 0.4699

Why this setup?
Why now? The daily trend is bullish and the 4h setup is armed with 95 percent confidence, so the macro tailwind is already in place. The 1h ATR of 0.008849 tells us volatility is compressed enough for a sharp breakout once price acts on the entry zone around 0.4274. With the 15m RSI sitting at 51.96, momentum is neither overbought nor oversold, leaving room for a clean push toward the first target at 0.4433 and the
post-image
ONDO+2.32%
The token with 4.47x volume is trending: ZAMA up 85% in seven days, ignoring sentiment
Good grief, it has taken over the trending charts—$ZAMA gained 85% in seven days and added another 8.37% in 24h. The direction is clear: I’m bullish below 0.0955, buying only on dips and not chasing highs; cut losses if it breaks down.

Volume is more honest than sentiment—the meme token playbook only recognizes volume. 24h trading volume was 33.02 million USDT, 4.47 times the 30-day average; the funding rate at 0.005% is not overheated, OI stood at 221 million tokens, down 4.49%, and the long-short ratio
ZAMA+4.08%
$EPIC is holding above the $0.55 area after a strong breakout from the $0.48 zone. Recent candles are forming higher lows, keeping the short-term structure healthy.
Long setup entry: $0.555 – $0.570TP1: $0.590TP2: $0.620TP3: $0.650Stop-loss: $0.535Buy and trade $EPIC.
post-image
EPIC+20.25%
There have clearly been more short orders placed above 4380 for gold over the past two days. I checked the order books on several major platforms, and the limit sell orders between 4380 and 4400 have increased by roughly 30% compared with last Friday, with the heaviest concentration around 4390. I also mapped out a range myself, and 4380 to 4395 is indeed a prior supply zone. When prices pulled back from 4420 before, they were repeatedly rejected in this area, leaving several long upper wicks. So I placed my stop-loss above 4422. To the downside, I’m first targeting 4365, followed by 4350, 433
post-image
GLDX-0.41%
PAXG-0.01%
ETH+0.10%
BTC-0.10%
  • 1
Everyone watching SYMBOL long just missed the move down.

$LAB /USDT - SHORT

Trade Plan:
Entry: 0.05292 – 0.05358
SL: 0.05643
TP1: 0.05086
TP2: 0.04927
TP3: 0.04689

Why this setup?
Why now? The 1h price is 0.05325, sitting exactly at the entry_ref and the upper edge of the entry zone, which means the short setup is live at the first trigger. The 1D trend is bearish, so the higher-timeframe structure is already aligned against longs and favors continuation lower. The 15m RSI is 44.66, showing just enough bearish momentum without being oversold, which keeps room for further downside. The 1h
post-image
LAB-6.48%
Watched the chart for ages, and the more I watched, the less I dared to go long. In the end, it proved right not to chase. When I checked the chart after lunch, the lack of support was too obvious, and volume had not followed through either. I noted that the upper levels were under pressure, so shorts could be entered in batches.

$SKYAI The short position went from 0.06198 to 0.04975, securing +481.89% in profit. It was genuinely sluggish at first, but the result feels great.

Close the bulk of it, 80%, first. Protect the remaining 20% at breakeven, move the stop-loss closer to the entry pr
post-image
SKYAI-0.82%
LAB-6.48%
ZEC+2.75%
Load More

Join 40 M users in our growing community

⚡️ Join 40 M users in the crypto craze discussion

💬 Engage with your favorite top creators

👍 See what interests you

Trending Topics

MSTRTopsNasdaq100

74.36k Views3.06k Discussing

Strategy (MSTR) has gained about 48% over the past month, making it the best-performing stock in the Nasdaq 100, while Bitcoin rose roughly 12% over the same period. The company holds 845,050 BTC with a cumulative cost basis of about $63.73B. MSTR is not a pure Bitcoin proxy — its price swings can be more extreme. Can this rally last?

Gate Tops 24H Net Inflows Among Exchanges

26.62k Views3.69k Discussing

BTCRetakes80K

57.51k Views60.76k Discussing

View More