Square
Following
Hot
News
Profile
Share your thoughts
placeholder
Article
Market update
live-cover
LIVE661
#SimpleEarnUSDTLimitedTime11%APR
🚀 Gate Idle Funds Treasure × Coin Treasure Phase 2: A Smarter Approach to Managing USDT
In crypto, success is not always about buying at the lowest price or selling at the highest point. Sometimes, the real advantage comes from knowing how to manage your available capital while waiting for the right opportunity.
With the market experiencing unpredictable movements, many traders prefer to keep a portion of their portfolio in USDT rather than immediately entering volatile positions. Gate's Idle Funds Treasure × Coin Treasure Phase 2 introduces limited-time earn
BTC+0.49%
$US is fucking harmful. Don’t touch
post-image
US-39.94%
Bullish on today
Bullish on builders
Bullish on frens
What #memecoin are you bullish on?
post-image
MEME-0.84%
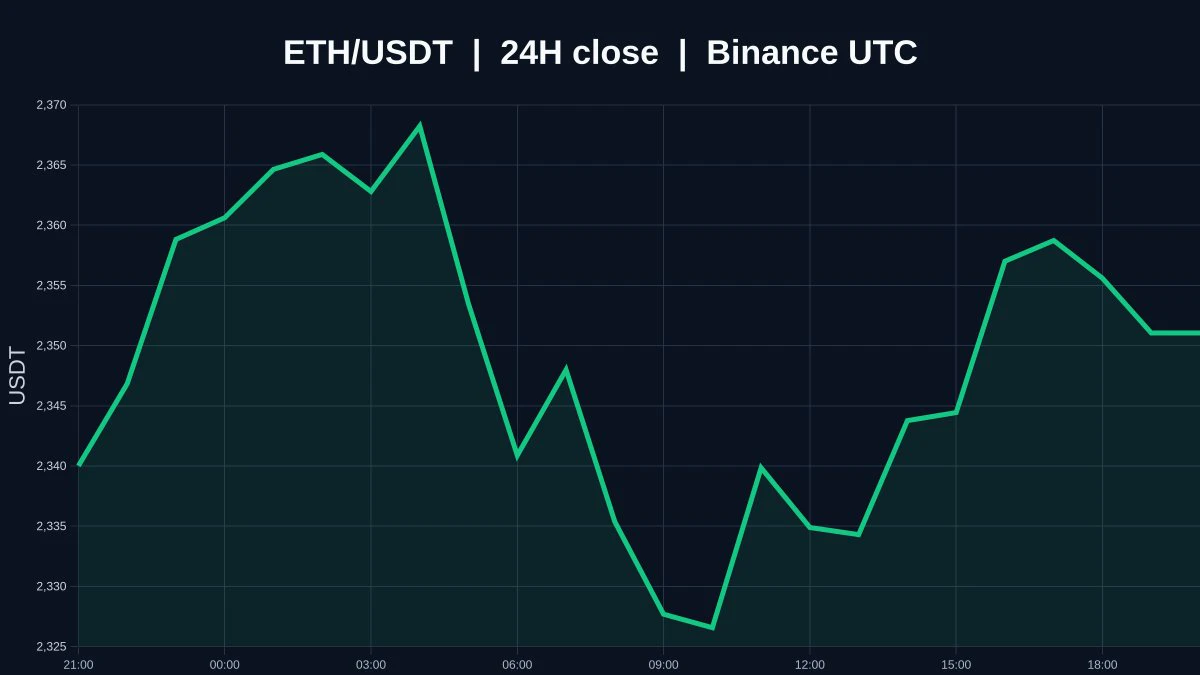
$TSLA $ETH Is Sitting Right on $2,500, and That’s the Whole Story 🎯
Crossing $2,500 is a headline. Holding it is the trade.
$ETH is at 2,500 USDT, up just 0.36% on the day. It’s barely above the line after Thursday’s flush, which wiped out $356M in ETH positions.
🔹 Pivot: $2,500, where bulls and bears are fighting
🔹 Upside: $2,550, then $2,650 if buyers take control
🔹 Downside: lose the ~$2,490 flush low and sellers get the next move
🔹 Headwind: ETH ETFs lost $201.9M on Oct 6 and $160.9M on Oct 7
I like the resilience, but I won’t call a reversal until ETH closes above $2,550 on a daily
TSLA+2.04%
  • 1
#EthereumUpOver71%inQ3
Ethereum’s 71% Q3 Rally Was Impressive. The Real Test Begins When Buyers Have to Defend It.
There is a difference between watching Ethereum rise and understanding what is actually pushing it higher. A strong candle can attract attention, but the combination of capital flows, market liquidity, investor positioning, and price structure tells us much more about whether a rally has room to continue.
Ethereum’s reported 71% gain in Q3 2026 put it firmly on the radar. What makes this move interesting is not just the percentage return. It is the reported reversal in spot ETF f
post-image
Next Week’s Macro · Exact Release (Beijing) Times

Macro | Data Release Times (Monday–Sunday)
✅ Monday 10.12
16:00 Domestic monetary and credit data (M0, M1, loans)
No major U.S. data, suitable for staying on the sidelines

✅ Tuesday 10.13
Multiple European and U.S. economic indicators and Fed officials’ speeches; minor fluctuations are likely in the evening

✅ Wednesday 10.14【Biggest Event of the Week】
20:30 U.S. September CPI inflation data
This is the most important event of the week and will directly affect Fed expectations, amplifying volatility
The IEA monthly oil market report will
$ERA Current price: 0.0788. The short-term long/short dividing line is 0.0782 (the MA5 and MA20 convergence level), with resistance at 0.0894 (the Bollinger upper band) and support at 0.0672 (the Bollinger lower band).
A horizontal comparison of three candidates in the same sector: $ERA is up 20.30% over 24h with a trading volume of 21.1M, making it the strongest among the three in both gains and volume; $MIN is up only 7.91% with a trading volume of 12.2M, and its MA5 remains below the MA20, indicating a follow-the-rise profile; $ATOM is down 5.18% against the trend. Although its moving av
post-image
ERA+14.43%
ATOM-4.63%
MINA+8.61%
Good morning, $DOGE family! 🤝🐶
Gm C X 📈 🫡
Happy weekend, legends! 🍂✌️☀️
Dogecoin to the moon! 🚀🌑
post-image
DOGE-0.32%
$BTC The upward structure is still intact, with the price continuing to hold above the 50-week moving average.
During the 2020–2021 cycle, the price rose by more than 690% after crossing this line. If the current trend continues, it will head straight for $100,000 and set a new all-time high.
#GateAtTOKEN2049 #GateWCTCS9GlobalTradingCompetition #btc $BTC ‌
post-image
BTC+0.50%
#Gate亮相TOKEN2049
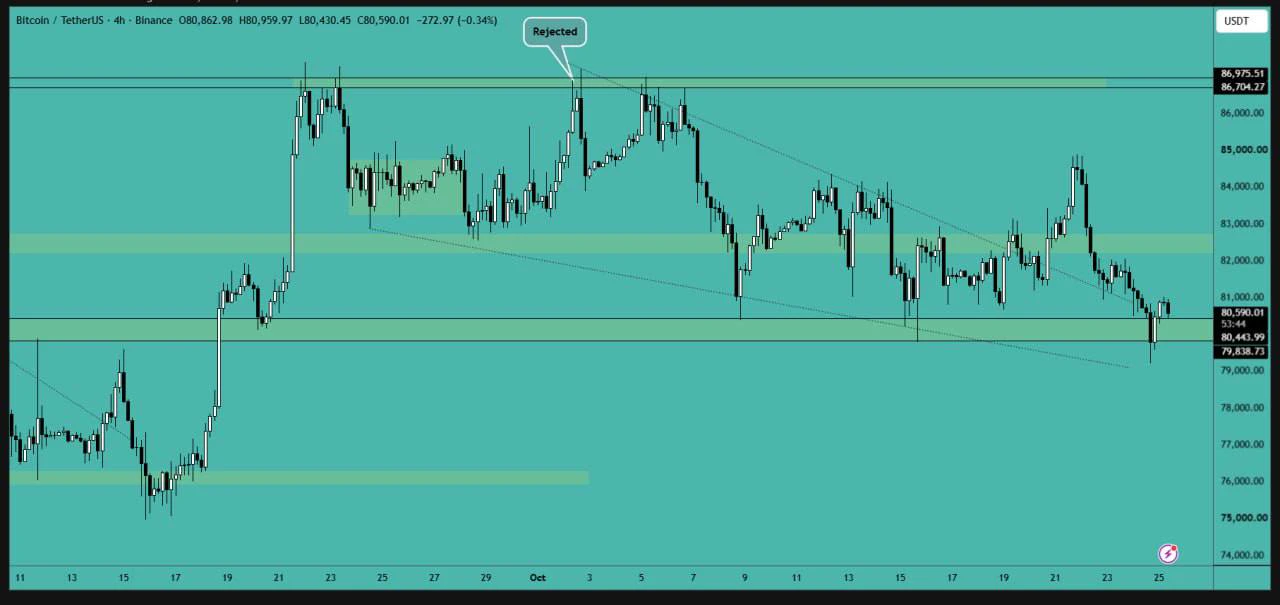
BTC 83024, 4H bottoming rebound, 80393 sets the direction
Market: After bottoming at 80393.56 on the 4H chart, it rebounded to 83024.65, up +0.50% over 24H (high 83173.29/low 82545.82). A bearish channel has been in place since 86999, with an oversold sideways rebound; confirmation is needed that 83173 is resistance.
Key levels:
• Support: 82545 (24H low), 80393 (previous low)
• Resistance: 83173 (24H high), 84797 (starting point of the decline/short-entry level), 86999 (swing high)
• Targets: A break below 82545 targets 80393→78000; holding above 83173 targets 84797
Objectiv
post-image
BTC+0.50%
#BTC回调触及81000美元
#BTCPullsBackTo81000
BITCOIN MARKET OUTLOOK: BTC RECOVERS TOWARD $83,000 — IS $85,000 THE NEXT BREAKOUT LEVEL?
Bitcoin is trading around the $82,000–$83,000 range according to the latest price reference provided for this analysis, recovering from its recent decline toward the $80,000–$81,000 support zone. This rebound brings renewed attention to an important question: Is BTC preparing for a stronger recovery, or is this simply a temporary bounce before another downward move?
My current outlook is cautiously optimistic about the short-term recovery but remains defensive until
BTC+0.49%
It took Japan's stock market 34 YEARS to recover from its 1989 peak:
In December 1989, the Nikkei 225 closed at a record 38,916, and Japan made up ~45% of global stock market value.
Then the bubble burst, and by March 2009 the index had fallen -82% to ~7,055.
The Nikkei did not set a new all-time high until February 2024, more than 34 years later.
Today, it trades near 68,871, roughly +77% above its 1989 peak.
In other words, an investor who bought at the top waited over three decades just to break even.
post-image
$LUMIA This 26% green candle almost shook me out.
The night before last, BTC was churning around 94000, while Fed officials said they were “in no hurry to cut rates,” leaving the broader market as cold as an ice cellar. I watched the $LUMIA order book, where buy orders had been sitting at the 0.082 support level for three days, but I honestly had no confidence—the trading volume was only tens of millions, and liquidity was as thin as paper. Any large order could easily crash through it.
Then, at 2 a.m. yesterday, volume suddenly exploded. By the time my phone alert went off, the price had alre
LUMIA+25.30%
BTC+0.49%
The Greed Index is still stuck at 64, but $JST is weakening on its own—down 3.78% over 24h, with just 5.9M USDT in trading volume. This is the most unusual detail in today’s market: sentiment is relatively warm, yet funds are withdrawing from small-cap assets. A decline on low volume indicates thin liquidity, amplifying the risks of slippage and sudden wicks. In this structure, trying to catch the bottom is dangerous.
From a position-management perspective, $JST ’s current volatility is clearly too high relative to its trading volume. The worst-case scenario is continued lack of buying suppor
post-image
WLD+8.52%
Insiders are quietly fading a range-bound daily trend on $QQQ /USDT right now.

$QQQ /USDT - SHORT

Trade Plan:
Entry: 751.51 – 751.85
SL: 753.29
TP1: 750.47
TP2: 749.66
TP3: 748.45

Why this setup?
Why now? The 1h price is sitting at 751.68 inside a tight entry zone between 751.51 and 751.85, which gives a precise short trigger. The 1h ATR of 0.67191 shows enough volatility to reach the first target at 750.47 without noise. The 15m RSI at 46.84 confirms mild bearish momentum that fits the short bias. With the daily trend labeled as range, this trade aims to fade any bounce toward the inval
QQQ-0.18%
Financial News, Crypto Updates, Real Trading Strategies
live-cover
LIVE1,001
Don't rush to take a position on $ADA . The 1-hour and 4-hour charts are still in conflict, and this is when it's easiest to mistake a rebound for a reversal. I'd rather lay out the bearish case first.
Bears are focused on the risk after a break below 0.2424, while bulls need to prove that buyers remain after a break above 0.2595. Current volume is 0.63x.
The current price is 0.25, about 3.04% from the 1-hour support at 0.2424 and about 3.80% from the resistance at 0.2595. Position determines which side is more urgent; the next level to watch is 0.2238.
Waiting for the boundaries to provide an
post-image
ADA+0.99%
I've been away for a whole week—what's the market like now?
post-image
  • 1
$AERO Woke up from a nap to find my account up 16 points—more satisfying than grabbing a red packet. This thing is like that milk tea shop downstairs that suddenly goes viral. Aerodrome is the largest trading hub on Base, and every new project launching a token has to pay it a “toll” first. As liquidity keeps snowballing, the token price naturally rises with it.
Look at the data: the 24-hour low of 0.7953 surged to a high of 0.9460, with $52.9 million in trading volume. This isn’t small-time retail trading—it’s real money scrambling to accumulate. Technically, it has just broken through the 0.
AERO+16.35%
Load More

Join 40 M users in our growing community

⚡️ Join 40 M users in the crypto craze discussion

💬 Engage with your favorite top creators

👍 See what interests you

Trending Topics

GateAtTOKEN2049

40.07k Views21.58k Discussing

Gate brought a series of major events to TOKEN2049 Singapore! From the official launch of Gate Money to the F1 Red Bull driver meet-and-greet and the Gate Gala, we witnessed a new chapter of "One Gate, Borderless Finance." Which moment from TOKEN2049 stood out most to you?

LedgerLossesNear90Million

39.15k Views205 Discussing

GateWCTCS9GlobalTradingCompetition

33.67k Views4.94k Discussing

View More