Square
Following
Hot
News
Notifications
Profile
Share your thoughts
placeholder
Article
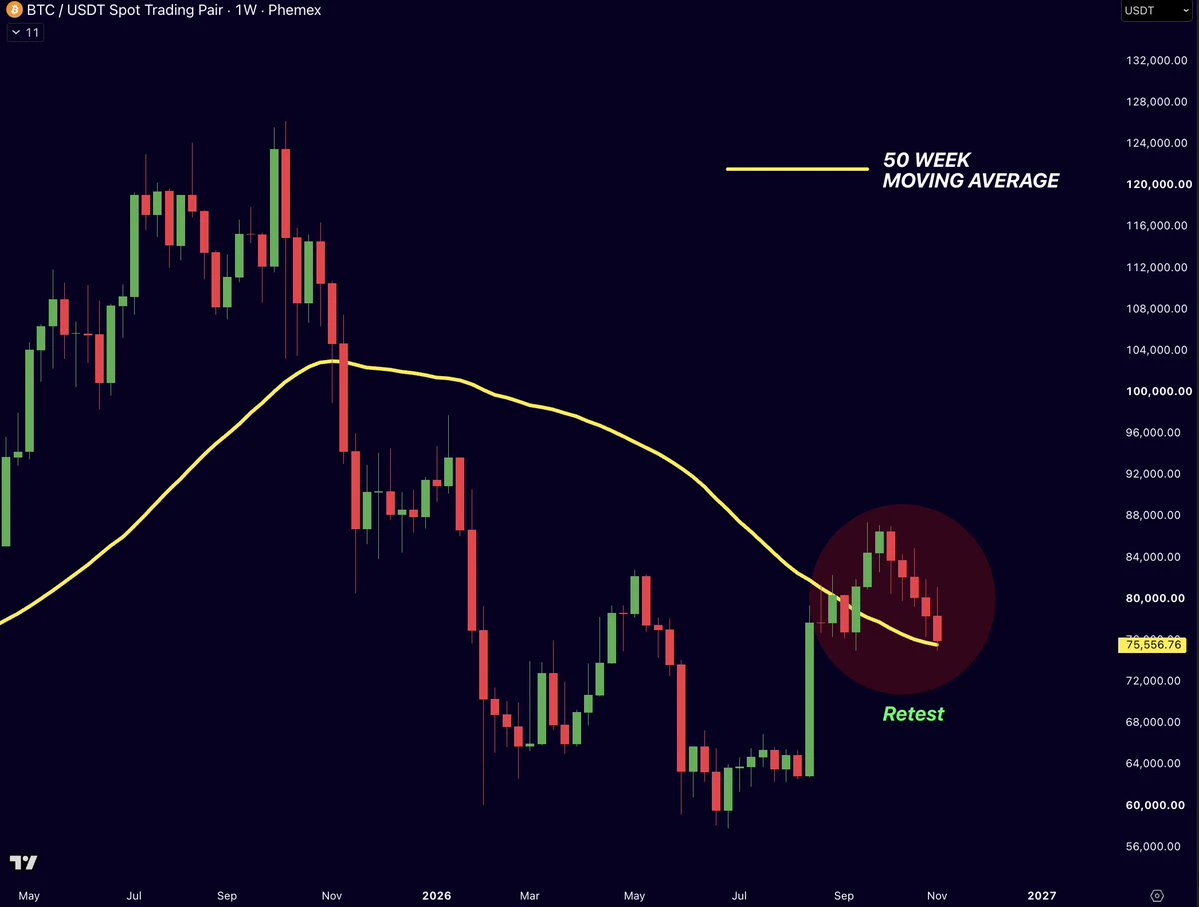
$BTC is retesting the 50 week moving average at $75,500.

Bulls need to hold this level and bounce to keep the bullish trend intact.

#USNonfarmPayrolls
#USCPIDataIncoming
post-image
BTC-0.67%
$ETH Weekly still working on that right shoulder, as well. Going to have to be open-minded to more downside possibly, but we still have the track line underneath us at ~$2,085. And I know it doesn't look like it, but the Daily has a wonky H&S still playing out. Just waiting for that downtrend to end.
ETH-1.26%
Trenches
ZIG
Z
bade
b
ZIG
0x8c...1145
Market Cap
$.
Change
.
24h Vol
$.
Holders
.
STONK
S
bade
b
STONK
6GmA...UNgx
Market Cap
$.
Change
.
24h Vol
$.
Holders
.
CLAUDIA
C
bade
b
CLAUDIA
2j5S...W2ZM
Market Cap
$.
Change
.
24h Vol
$.
Holders
.
BTC
B
bade
b
BTC
C5xp...pump
Market Cap
$.
Change
.
24h Vol
$.
Holders
.
FLOAT
F
bade
b
FLOAT
Bv1a...BMmr
Market Cap
$.
Change
.
24h Vol
$.
Holders
.
In crypto, the only advantage ordinary people have is “time,” but most waste it
First, see clearly who you’re trading against.
Institutions have capital; you don’t
Whales have information; you don’t
Market makers have speed; you don’t
Project teams have tokens; you have even less
So what do you have?
You have something none of them do: the ability to wait.
Institutional capital has a cost; yours doesn’t
Funds have to answer to LPs every year, report quarterly, and face redemptions if their drawdowns get too large.
They have to act; not acting is dereliction of duty.
You don’t have that pressur
post-image
BTC-0.65%
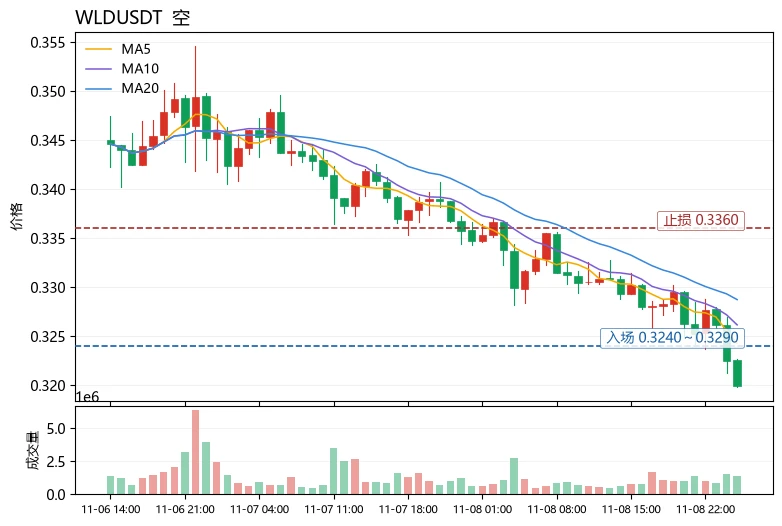
$WLD Current price is 0.3199, below the lower Bollinger Band at 0.321834. MA5 at 0.3243 is below MA20 at 0.328745, with short-term moving averages in a bearish alignment. RSI is just 27.1, in oversold territory but with no divergence yet. The MACD histogram at -0.0004331 continues to show bearish momentum. The range over 30 candlesticks is about 6.53%, indicating medium-high volatility. The funding rate is -0.0157%, meaning shorts pay longs and suggesting short positions are already crowded, making it less attractive to chase the decline; the Fear & Greed Index is 28, reflecting fearful marke
post-image
WLD-5.61%
BNB-0.76%
LINK-0.18%
#USCPIDataIncoming **US CPI Data Incoming: A Key Moment for the Crypto Market**

The upcoming US Consumer Price Index (CPI) data could become a major catalyst for financial markets, especially Bitcoin and the broader crypto sector. Investors are closely watching inflation trends because they may influence the Federal Reserve’s next interest rate decisions.

If inflation comes in lower than expected, markets could see renewed optimism and stronger buying interest. However, a hotter-than-expected reading may increase uncertainty and put pressure on risk assets.

For traders, this is a moment to
post-image
Strong line-up ready for tomorrow
post-image
Nobody knows about this sport
And it's a fking shame imo
post-image
Watching your account turn deep red? Let’s talk about the “fatal mistakes” retail traders are most likely to make on a crash night

Guys, I don’t know how many people trading U.S. stocks and crypto lost sleep on the night of November 5. Watching the numbers in their accounts instantly shrink by over 10%, or even tens of percent—I know that feeling of panic all too well.

But as someone who’s been through this, I have to give you a reality check: on a crash night, retail traders are most likely to make three fatal mistakes. Make even one, and you may never recover.

First mistake: rushing to “b
NVDA+2.80%
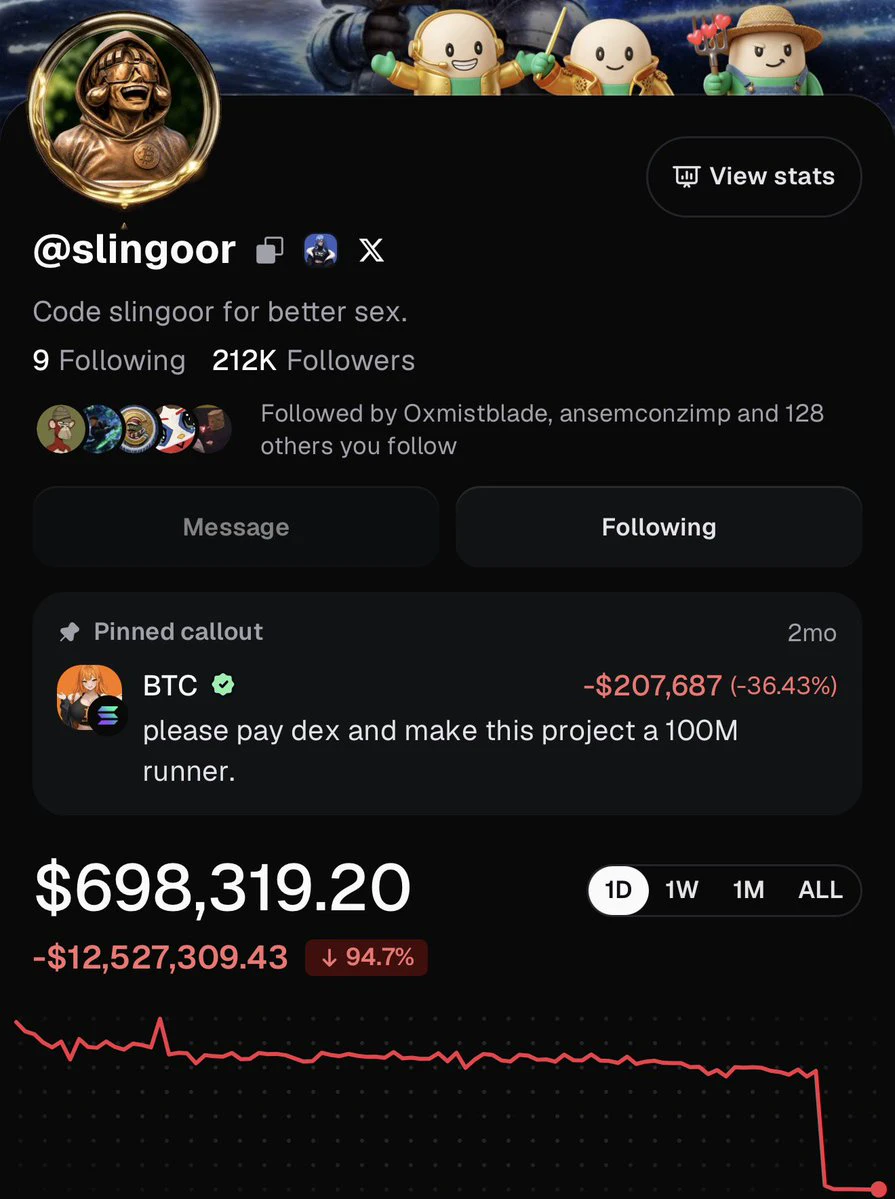
So Slingoor just nuked everything?
post-image
$UAI Down 44% in a day—those who chased at 0.13 are sweating now. The 24h low was 0.0666, and the current price of 0.0692 is basically on the floor. Trading volume of 101.6M shows panic selling, not a lack of attention.
My discipline: don’t catch a falling knife; wait for stabilization. Enter in batches in the 0.066–0.068 range, set an unconditional stop-loss below 0.064, and take profit at 0.082 for the first target and 0.095 for the second. Keep the position below 20%; don’t go all in.
The logic is simple: it fell from 0.13 to 0.066—a deep enough drop—but any rebound depends on whether volum
UAI-7.58%
JCT-3.26%
BTC-0.67%
$FIL It’s been steadily grinding lower, and it looks like it’s about to break below the previous low—it’s only a matter of one wick. 0.4 isn’t far off either. I’ll place 50% of the 5,000 at 0.4, then place the remaining 50% at 0.1 and see whether I get stuck holding the bag again. This will be my last time averaging down. Surely it won’t fall to 0.00-something; there’s no chance of that right now, though in 2 years, who knows,
post-image
FIL-2.00%
i beLive the term "create" should be removed from all tech devices/software and from the vocabulary people use in their everyday speech
this is beCause only God can "create"
at best : anything else can merely offer a GOoD imitation of His perfection. Period.
post-image
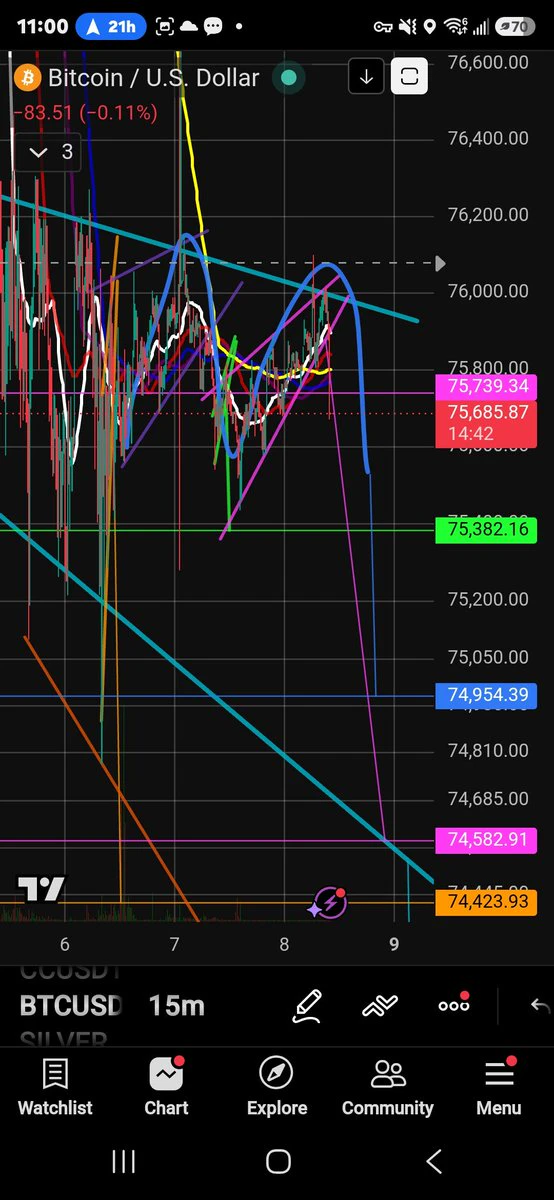
$BTC Breaking Downwards Fron The Pink Rising Wedge As Projected
Yes the chart is definitely messy. I understand. 💯
All of the patterns and measured moves play a role in price action.
I used to constantly clean the charts. Then I started to let it go.
This is when I realized how connected it all really is!
Nothing is ever financial advice.
I look at thing different than most.
My Goal Is To Learn And Teach The Symbiotic Nature Of The Charts.
#BTC #Crypto #Trading
post-image
BTC-0.67%
SUNDAY MARKET UPDATES
live-cover
LIVE568
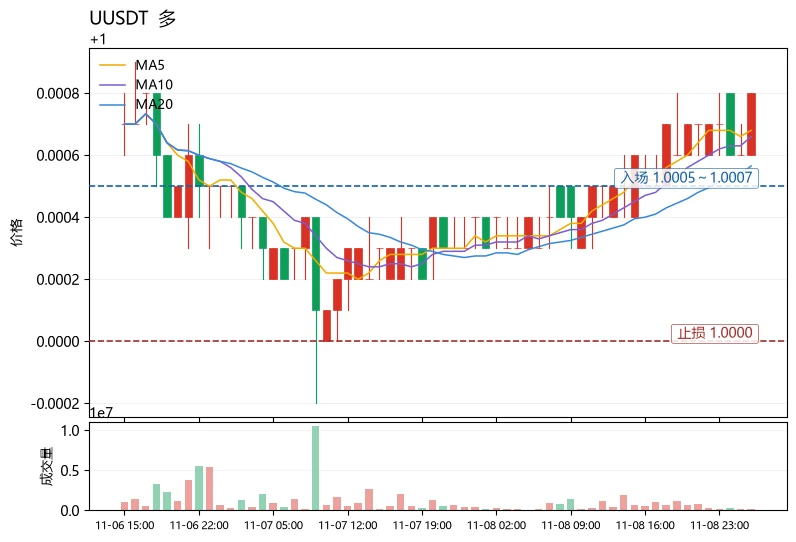
When volatility falls so low that there is almost “nothing to guard against,” should you relax your stop-loss discipline? Quite the opposite—the calmer the market, the more you should size your position based on worst-case scenarios.
$U The current price is 1.0008, with a range of just about 0.05% over 30 candles, indicating an extremely low-volatility structure. However, MA5=1.00068 has moved above MA20=1.00056, the MACD histogram is positive, and RSI=65.1 is strong but not overbought. The price is near the Bollinger upper band at 1.0008, with the short-term center of gravity edging higher. T
post-image
ACT-1.19%
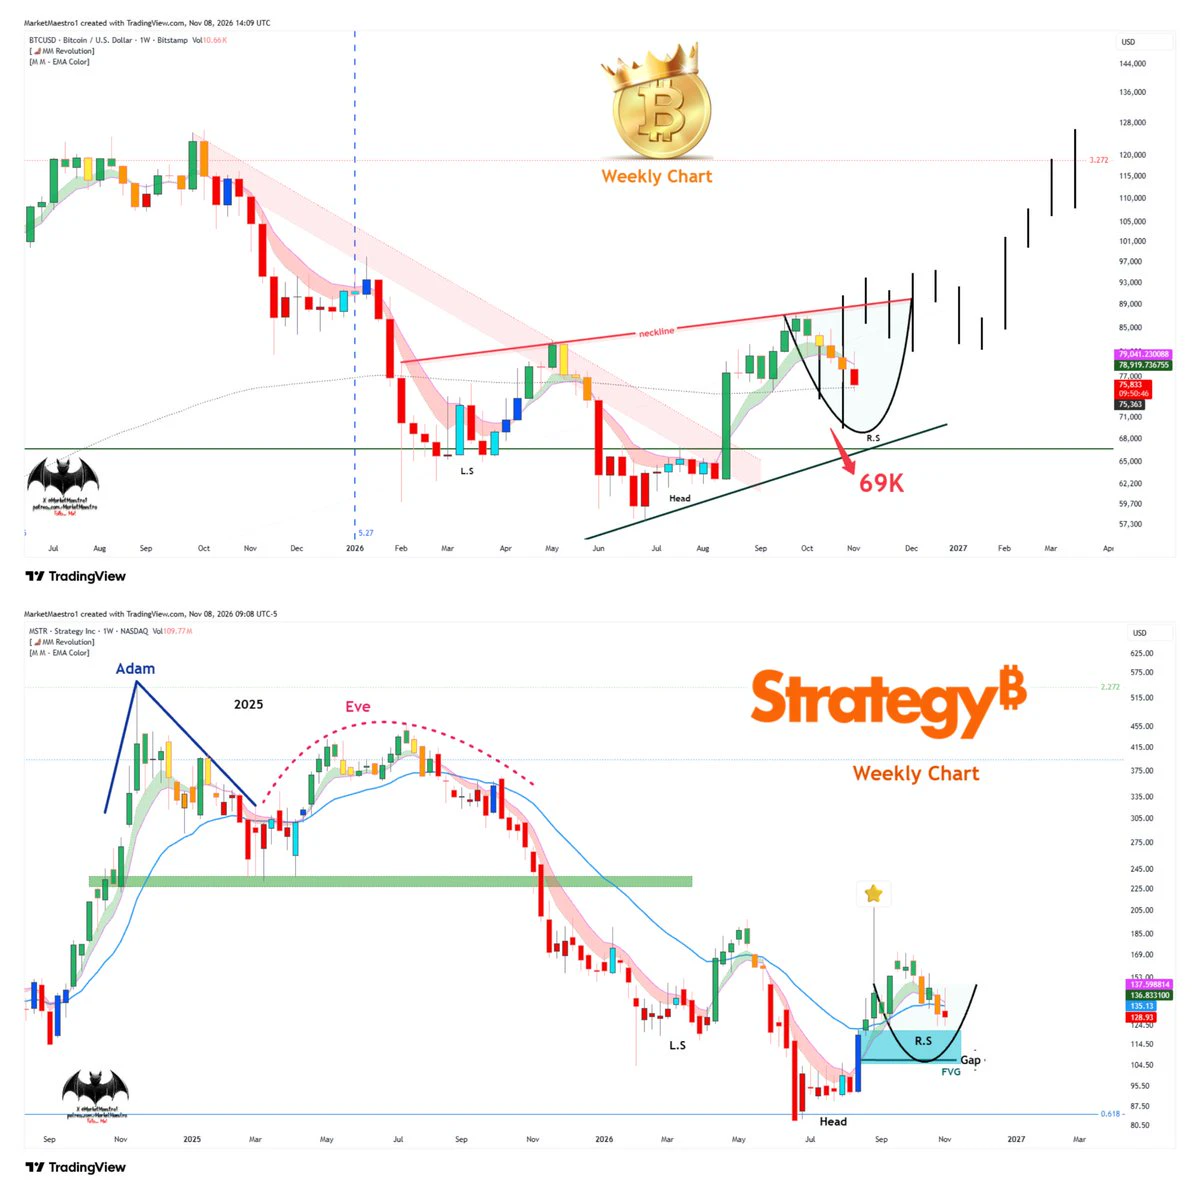
$MSTR bitcoin:native
BTC will very likely close the week below the EMA21-$76,635. That brings support at $69K into play. Of course, instruments like ethereum:native , $ASST , and $BMNR could follow a similar path
post-image
MSTR-0.30%
BTC-0.67%
ETH-1.26%
ASST+4.15%
BMNR-1.15%
I just came across a message and was completely stunned—is this actually true or not?
Let me make my stance clear first: I'm bullish, no hesitation.
$SOX $BNB $BTC I'm keeping an eye on all three of these assets.
I took a quick look at the trading ledger for the past 90 days, and the numbers speak for themselves: +1,500.08+66.06%
Now let's look at their short-term performance: $BNB +0.18%$BTC -0.17%$SOXL +0.24%
Let's set aside whether the news is true or not—positions and profits and losses don't lie. A 66% return over 90 days comes not from chasing news, but from holding steady and reading t
post-image
BTC-0.67%
BTC MARKET prediction
live-cover
LIVE1,492
Load More

Join 40 M users in our growing community

⚡️ Join 40 M users in the crypto craze discussion

💬 Engage with your favorite top creators

👍 See what interests you

Trending Topics

USCPIDataIncoming

13.55k Views1.64k Discussing

The U.S. October CPI report will be released on November 10 at 8:30 a.m. ET. September CPI came in at 3.7% year over year, and markets will be watching closely for signs that inflation is cooling, especially in core CPI. A softer-than-expected reading could strengthen rate-cut expectations, while hotter inflation may pressure risk assets through higher Treasury yields and a stronger dollar. How do you think this CPI print will move $BTC, U.S. stocks and gold?

USAIStocksHitHard

28.45k Views3.74k Discussing

USNonfarmPayrolls

54.47k Views4.49k Discussing

View More