Share your thoughts
placeholder
Article
Gemini on Android can shrink into a floating spark bubble so you keep the chat while you use other apps.
Open the Gemini overlay, ask something, then tap Minimize (or tap outside after a reply). It collapses to a spark bubble. Tap to expand. Drag to move or dismiss.
Would you leave Gemini parked on your home screen?
Everyone’s staring at ADA’s range—but the 4H just whispered a secret that most will ignore.

$ADA /USDT - SHORT

Trade Plan:
Entry: 0.2187 – 0.2199
SL: 0.2249
TP1: 0.2151
TP2: 0.2122
TP3: 0.2080

Why this setup?
- ADA/USDT is coiling at 0.2193 with a 55% short bias, but the 1D is still "range"—not a breakout.
- RSI 15m at 51.19 = zero momentum; ATR 1H shows a tight 0.0023 squeeze—volatility is loading.
- Why now? The 4H structure says the path of least resistance is down to TP1 0.2151, yet the invalidation at 0.2110 is a trap door for late shorts.
- If price rejects 0.2199 (entry high
ADA+4.53%
Why is everyone long MU/USDT while the 4h timeframe is screaming SHORT with 84% confidence?

MU/USDT - SHORT

Trade Plan:
Entry: 1015.27 – 1016.89
SL: 1026.20
TP1: 1008.49
TP2: 1003.43
TP3: 995.84

Why this setup?
- The 1D trend is bullish, but the 4h setup just armed a SHORT at 1016.08 — that’s a classic higher-timeframe pullback trap.
- RSI on 15m is at 47.64, showing zero momentum for a bounce — sellers are in control of the micro-move.
- ATR 1h at 3.24 means the expected move is tight, but TP1 at 1008.49 is only 0.75% away — low risk, high probability.
- Why now? The entry zone (1
MU+0.19%
Market prediction
live-cover
LIVE1,589
$BULLA Signal】1H momentum weakening + funding rate too high, quick short-term long
$BULLA 4H momentum bars are shortening, RSI 71.5 is flattening at elevated levels, and 1H buying inertia remains. The 0.1175% funding rate is relatively high, the order book bid-ask ratio is 0.99, and depth imbalance is -0.51%. Volume has plunged from the previous hour, with the price trapped in a narrow consolidation range.
🎯Direction: Long
⚡Entry/Limit order: 0.08422-0.08448
🛑Stop-loss: 0.08363
🚀Target 1: 0.08575
🚀Target 2: 0.08638
🛡️Trade management:
- Execution strategy: After reaching Target 1, reduce
post-image
BULLA+209.68%
BTC+0.18%
ETH+1.18%
SOL+1.66%
Everyone’s long XLM, but the 4H clock just ticked against the crowd.

$XLM /USDT - SHORT

Trade Plan:
Entry: 0.18373 – 0.18449
SL: 0.18771
TP1: 0.18141
TP2: 0.17960
TP3: 0.17690

Why this setup?
Why now? The range-bound 1D trend is your tell—no momentum to break higher.
- RSI (15m) at 48.2: neutral, giving sellers room to push without overbought friction.
- ATR (1h) at 0.0015: tight volatility—perfect for a clean slide to TP1 (0.18141) and TP2 (0.17960).
- Entry at 0.18411 is armed; invalidation sits at 0.18203, so the risk is defined and tight.

Debate:
Is XLM faking the dip below 0
XLM+3.21%
It was down 6% yesterday, then exploded higher today! Has SoftBank boarded the AI roller coaster?
SoftBank's recent stock performance has made the meaning of “high volatility” crystal clear.
SoftBank fell 6.42% on September 2, but by September 4, its stock had surged 11.78%, closing at 5,590 yen.
Behind this move, on the one hand, is the rapid recovery in market risk appetite, and on the other, the renewed strength of the AI sector. Japan and South Korea's markets have recently been clearly driven by the semiconductor and AI supply chains, with Samsung Electronics and SK Hynix in South Korea,
post-image
SK Hynix+3.19%
  • 41
Liquidation at its peak 🥺😂
post-image
Everyone’s staring at LTC’s range—but the 77% short signal says the exit door is already open.

LTC/USDT - SHORT

Trade Plan:
Entry: 53.89 – 54.17
SL: 55.80
TP1: 52.70
TP2: 51.82
TP3: 50.49

Why this setup?
- Price is pinned at 54.03 while 4h momentum rolls over; RSI 15m at 47 shows no buying spark.
- ATR 1h (0.57) is tight—this coil snaps fast, and TP1 at 52.70 is only 2.5% away.
- 1D trend is *range*, not bull—so this isn’t a dip-buy, it’s a mean-reversion gift.
- Why now? Entry zone 53.89–54.17 is the last polite area before the slide to 51.82.

Debate:
If LTC breaks 53.80, do you
LTC+8.46%
Seems like Christmas 🎁⛄🎄
$TROLL
post-image
TROLL-23.05%
  • 1
My long position made a round trip, and today I finally saw the protective level do its job. The drop a few days ago came sharply; to be honest, I was somewhat panicked because a lot of the unrealized profit had already been given back. But since I had placed a stop-loss order in advance, I didn’t have to watch the market all night trying to guess the key level. Once the price climbed back above 0.0116, I first took profit on 30% of the position, while moving the protective level higher with the trend for the remaining 70%. This wasn’t about predicting how much further the price could rise; I
post-image
LAB+2.21%
SNDK+1.85%
These returns are making me nervous, as if I’m afraid the market will come to its senses tomorrow and blacklist me.
During the intraday bottoming phase, $UNI /UNI oscillated around 4.828, and many people couldn’t hold on and handed over their chips. I took another look at the order book: each pullback to a key level was higher than the last, and funds quietly entered every time it reached a key level. This didn’t look like a breakdown was coming, but more like the final shakeout before a move up. Once I had thought through the stop-loss level, all that remained was to leave it to time.
The pric
post-image
UNI+15.92%
LAB+2.21%
ZEC-0.33%
Crypto Signals and Trding Insights
live-cover
LIVE76
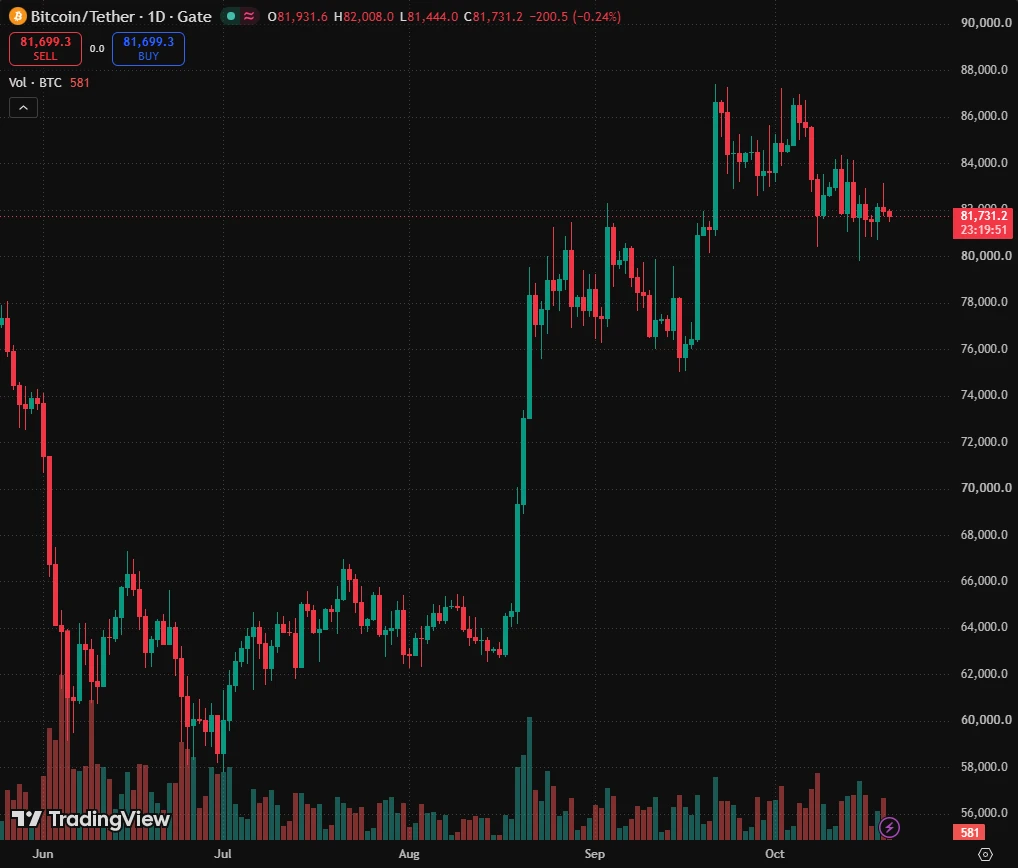
$BTC 's Recent bear market trend has seen a -54% drawdown top to bottom.
This was while all other markets were rallying hard, which is a good argument as to why it was "just" -54% this time around. Arguably, price would see a much larger drawdown if stocks and everything were down a lot too during this time.
This was a very isolated bear trend this time around.
#Gate60MillionUsers #BTCReclaims80K
post-image
BTC+0.18%
  • 7
Everyone’s staring at 103.36—but the real trap is hiding in plain sight on $SOL /USDT.

$SOL /USDT - SHORT

Trade Plan:
Entry: 103.18 – 103.54
SL: 105.05
TP1: 102.09
TP2: 101.25
TP3: 99.98

Why this setup?
- The 4h frame says SHORT, but confidence is just 55—this is a knife-edge, not a conviction.
- RSI on 15m (45.75) is dead neutral: no panic, no euphoria—just a coiled spring.
- ATR 1h at 0.70 means the next 4 candles could fake you out before the real move.
- Why now? The range on 1D is the anchor—we’re bouncing inside it, and TP1 at 102.09 is the first magnet, but a break below 102
SOL+1.71%
I originally planned to cut my losses as a sacrifice to the heavens, but the ritual never happened—the meat roasted itself.
With green filling the screen, $XAU kept oscillating around 4474.29, while the sell walls grew thinner each time. There was clearly no big money looking to take the other side. The rebound lacked volume and support, so I followed the trend and entered a short.
I switched over casually and saw it had already dropped to 4438.98, giving me a full +72.11% on paper. That was real meat on the table. It dragged its feet earlier, but the result tastes just as good.
Take profits
post-image
XAU+0.09%
XRP+1.47%
BNB+7.18%
Everyone’s chasing the 15m RSI bounce—but that’s exactly where ESPORTS traps breakout traders.

$ESPORTS /USDT - SHORT

Trade Plan:
Entry: 0.01492 – 0.01500
SL: 0.01533
TP1: 0.01468
TP2: 0.01450
TP3: 0.01423

Why this setup?
- 1D trend is bearish; 4h bias is SHORT with 95% confidence—not a guess, a weighted edge.
- Price is stalling at 0.01496, right on the 1h reference, while RSI 15m at 68 screams overbought *into* resistance.
- ATR (0.000153) shows tight coils—breakdowns here snap fast, not crawl.
- Why now? The “waiting” status means the setup is armed; invalidation at 0.01530 is a
ESPORTS+1.02%
This was purely the market being in a good mood and casually tossing out some coins, which happened to land right on my head. While everyone else was rushing in, I was instead watching for a fake move. At the time, $LIGHT surged sharply and aggressively, but the volume didn’t match at all—however I looked at it, it seemed like a bull trap. I didn’t follow the rush; instead, I placed a short around 0.2321.

Being out of the market isn’t a sin; opening positions recklessly is the mistake.

Once the sentiment cooled and the price gradually returned to 0.188, +187.16% was secured. It felt reall
post-image
LIGHT+3.45%
LAB+2.21%
ZEC-0.33%
Everyone’s long gold—but the 4H clock just ticked 22:56 against you.

XAU/USDT - SHORT

Trade Plan:
Entry: 4438.35 – 4441.17
SL: 4453.25
TP1: 4429.64
TP2: 4422.90
TP3: 4412.78

Why this setup?
Why now?
- XAU/USDT is range-bound on the 1D, but the 4H structure says SHORT with 55% conviction.
- RSI 15m at 55.2—not overbought, but stalling into resistance at 4439.76.
- ATR 1h at 5.62 means volatility is tight—breakouts fake, mean reversion pays.
- Entry zone 4438–4441 is the pivot; TP2 at 4422.90 is a clean 0.38% grab before the daily range traps you.

Debate:
If 4441 rejects again, a
XAU+0.09%
Everyone’s staring at NEAR’s dip—but the 95% confidence score says this pullback is the trap.

$NEAR /USDT - LONG

Trade Plan:
Entry: 2.1571 – 2.1813
SL: 2.0529
TP1: 2.2564
TP2: 2.3146
TP3: 2.4019

Why this setup?
- RSI on the 15m is crushed at 33.82—oversold fuel for a bounce, not a breakdown.
- 1D trend remains bullish; this 4h setup is a classic retest of 2.1692 support.
- With ATR at 0.048, the squeeze is primed: TP1 at 2.2564 is just 4% away, but TP2 at 2.3146 is the real prize.
- Why now? The entry window (2.1571–2.1813) is open, and momentum is coiling for a vertical push.

De
NEAR+2.62%
Load More

Join 40 M users in our growing community

⚡️ Join 40 M users in the crypto craze discussion

💬 Engage with your favorite top creators

👍 See what interests you

View More