Square
Following
Hot
News
Profile
Share your thoughts
placeholder
Article
$BERA Current price 0.2275, 24h -5.88%, trading volume only 5.6M USDT, MA5 at 0.23092 has crossed below MA20 at 0.23155, RSI at 46.6 is weak, the MACD histogram at -2.941e-05 remains bearish, and the Bollinger Bands are [0.214696, 0.248404], with the 30-candle amplitude at approximately 17.58%. The funding rate is -0.0001%, with bears slightly dominant but not at an extreme, and the Fear & Greed Index is neutral at 53—this is a typical low-volume, gradual decline structure rather than panic selling, meaning downside may open slowly instead of being released all at once.
Directional view: Beari
post-image
EPIC-18.35%
Range-bound SKHYNIX is about to break out and most traders are positioned the wrong way.

$SKHYNIX /USDT - SHORT

Trade Plan:
Entry: 971.37 – 978.79
SL: 1010.69
TP1: 948.37
TP2: 930.56
TP3: 903.85

Why this setup?
Why now? The daily trend is range, but the 1h ATR of 14.839521 signals a squeeze is building inside that range. The 15m RSI at 58.85 shows momentum is not yet exhausted, so a short entry near 975.08 is valid as long as we stay below 978.79. TP1 at 948.37 and TP2 at 930.56 define the first two targets on the path down, while the invalidation level of 1156.63 is the hard line that w
SKHYNIX-3.64%
$ZEC The altcoin king is a money printer—stay steady, hold spot through the bull market. It feels incredible
ZEC+8.07%
Insiders are quietly stacking shorts on BTW while the 1h ATR screams volatility.

$BTW /USDT - SHORT

Trade Plan:
Entry: 1.875069 – 1.928019
SL: 2.155704
TP1: 1.710924
TP2: 1.583844
TP3: 1.393224

Why this setup?
Why now? The daily trend is range-bound, which favors mean reversion and gives the short bias a structural edge. The 15m RSI sits at 49.09, hovering just below neutral and signaling that momentum is not yet oversold enough to invalidate a pullback. The 1h ATR of 0.1059 confirms that the asset is in a high-volatility phase, making the entry zone between 1.875069 and 1.928019 a preci
BTW-21.83%
( new streamer ) market overview
live-cover
LIVE534
Guys, a quick short-selling trade—don't miss it! Coin: $INIT 🎯 Target: 0.1360
post-image
INIT+11.65%
What Does SanDisk’s $14 Billion Buyback Plan Signal After Its Plunge?

Today, let’s focus on SanDisk. The trigger for the plunge in Japanese and South Korean stocks was in Asia, but SanDisk, a leader in the NAND sector, was also hit hard. SanDisk fell more than 5% in premarket trading, quoted at 203.9 billion.‌

But amid this wave of panic, one signal has been overlooked by many: SanDisk’s board approved a $14 billion stock buyback plan, bringing its total remaining buyback authorization to $15.5 billion.‌

What does this figure mean? SanDisk generated $20.25 billion in revenue in fiscal
Layout: Bitcoin, Ethereum, Dogecoin
live-cover
LIVE880
  • 4
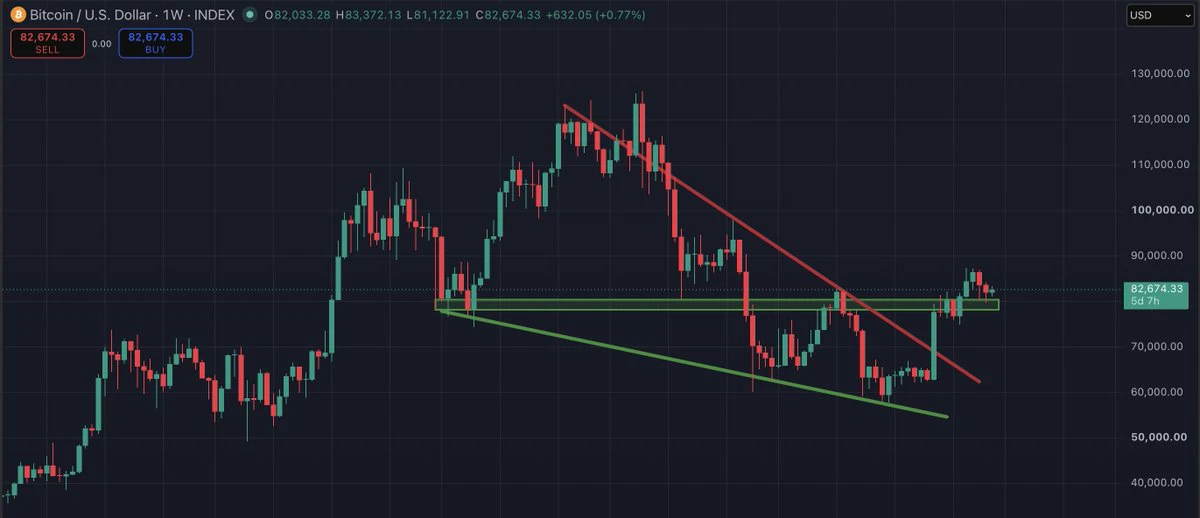
October 16 $BTC Strategy: Based on the current market, BTC's upward movement is being blocked by the 84200 resistance level. We continue to expect a pullback in the near term, but the decline has not been deep.
Do not rush to buy the dip. Open short positions in the 83500-84000 range, with a stop loss at 84500 (the starting point of the decline on October 7). If a solid bearish candle continues to break below 81800, keep the stop loss at breakeven.
Wait for a new low to appear. Reduce short positions in the 79200-78000 range and look for an opportunity to enter long positions.
post-image
BTC+0.99%
JUST IN: MSCI to remove Michael Saylor's Strategy $MSTR from its indexes.
MSCI+2.49%
MSTR+5.58%
$FIL Cun Cun is garbage; the 5x one follows the major coin, with a 60% gap: when the major coin rises, the 5x one falls more
FIL+7.94%
10.16 $SNDK The strategy has once again reached everyone’s favorite moment: the “three storage clowns.” First, SanDisk’s decline is not over yet; it’s just that the short positions exited early, while long positions still have to withstand further downward pressure. We previously discussed one logic,
namely, the three underlying elements for training small and large AI models: 1. Computing power: continuously allowing small and large AI models to iterate and upgrade step by step; 2. Electricity: demand for computing power continues to rise, and stable power supply is the foundation, with typic
post-image
SNDK-0.56%
From October 1 to October 16, all subscription trade records had only one loss, but the direction never changed, and we nailed it perfectly. Real-time trades basically entered and exited with pinpoint precision, and we have been profitable every day. The most important thing in futures trading is position management, not gambling. Ant King, open your dog eyes and see clearly what real strength is—defaming other streamers is not a skill
Are you tired of watching me win yet?! 🏆
We are just getting started! ✅️
Let's go make that money! 💰
Structure, no smoke! 🔥🐶🔥
Gold is finally dropping the act. As soon as PPI heats up, it runs faster than anything else. For example, in one U.S. PPI release, the year-over-year increase came in above expectations, core PPI also rose month over month, and the energy and transportation services components heated up together. Less than half an hour after the data came out, spot gold shot straight up from the intraday low, quickly expanding its gain to more than 1%, while COMEX gold futures volume suddenly surged. At the same time, the U.S. Dollar Index weakened, the 10-year Treasury yield fell, and as real rates eased, it
post-image
GLDX+1.78%
PAXG+1.24%
XAU+1.38%
XAG+2.92%
XCU-0.66%
On watch tomorrow $MSFT $GOOGL
post-image
MSFT+1.04%
GOOGL+0.37%
10.16 $BNB Strategy chart 1 is the BNB 4-hour candlestick chart, and chart 2 is the BNB hourly candlestick chart.
From the larger timeframe in chart 1, we can see that BNB has touched the lower major ascending trendline today, namely the positions at 10 a.m. and 10 p.m. on October 15, corresponding to 708 and 712, respectively. Given the very obvious signs of price control in BNB recently, when BTC falls and ETH falls, BNB can always recover its price after falling.
If the broader market continues to make new lows in the near term, BNB is very likely to break below this 4-hour ascending trend
BNB+0.14%
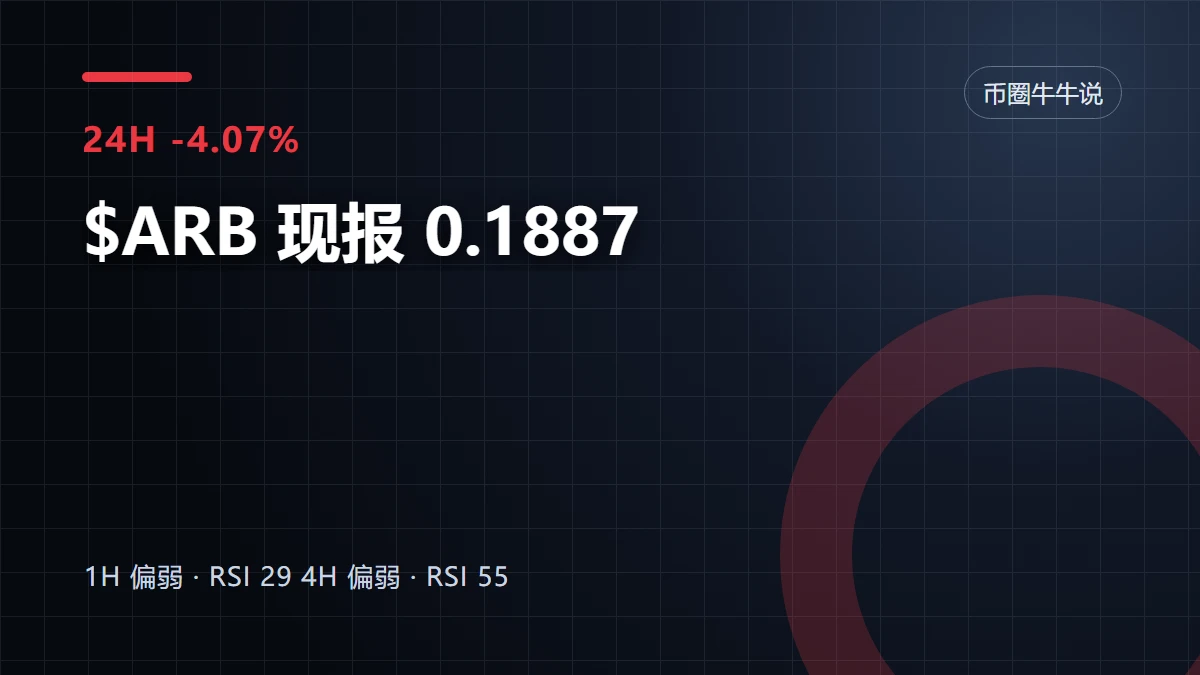
$MARSCOIN is currently in a high-volatility, weak-trend phase. Conclusion first: short-term bias is bearish; chasing longs is not recommended. If it rebounds to around 0.0782, a small short position may be cautiously attempted, but a hard stop-loss must be used.
The reasoning is as follows. MARSCOIN is currently at 0.0772, down 5.04% over 24h, with the amplitude over 30 candles reaching as high as 15.93%. Its volatility is significantly higher than BTC's 3.44%, making it a typical high-risk asset. In terms of moving averages, MA5=0.07824 remains above MA20=0.07621, so the apparent bullish ali
post-image
MARSCOIN-6.86%
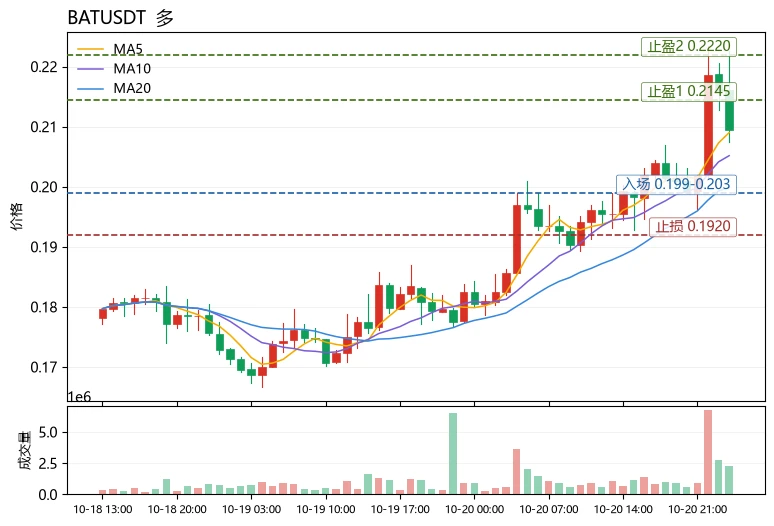
BAT+26.99%
BTC+0.98%
$ETH is about 9% below where it traded before Bitmine said it would stop buying. And as far as I can tell, Bitmine hasn’t even stopped yet.
Here’s the setup. As of Oct 4, Bitmine held about 6 million ETH, roughly 4.9% of everything out there. Chairman Tom Lee said on Oct 7 it will stop at 5%, about 100,000 ETH away. At around $2,460 an ETH, that’s roughly $246M by my math. Reports say it has $643M in cash and securities, so it isn’t stopping because the money ran out. It’s choosing to stop.
On my Gate chart, ETH sat around 2,700 before Oct 7. It slid to a low of 2,317 on Oct 15, then bounced
post-image
ETH+1.65%
$ICNT Up 21% in half a day, it surged straight from 0.1015 to 0.1371, with 13.7M in trading volume pouring in. That’s not the kind of volume retail investors can generate. I took a quick look on-chain just now: the top 10 addresses’ holding concentration hasn’t declined, indicating this move is not distribution but someone accumulating. On the macro side, here’s an anchor: during the week when the Fed minutes leaned hawkish, the 30-day correlation between altcoins and the Nasdaq surged to 0.78. Small-cap assets like ICNT have higher beta, so as long as rate-hike expectations don’t rebound, it
ICNT+24.55%
Load More

Join 40 M users in our growing community

⚡️ Join 40 M users in the crypto craze discussion

💬 Engage with your favorite top creators

👍 See what interests you

Trending Topics

USSeptemberPPIBeatsExpectations

91.35k Views1.88k Discussing

US September PPI came in at 6.3% YoY, well above the 5.3% market expectation, pointing to renewed producer-side inflation pressure. Weekly jobless claims were 199K, broadly in line with forecasts. Could hotter inflation further reduce room for rate cuts, and what does it mean for $BTC, US stocks, and gold?

DrLinHanSpeaksAtOxfordUnion

135.63k Views1.86k Discussing

JapanAndKoreaStocksPlunge

47.27k Views1.76k Discussing

View More