



Share your thoughts
placeholder
Article
Everyone’s buying XRP at 1.42, but the 4h tape just whispered something else.

$XRP /USDT - SHORT

Trade Plan:
Entry: 1.4184 – 1.4228
SL: 1.4415
TP1: 1.4049
TP2: 1.3944
TP3: 1.3787

Why this setup?
- The 1D trend is *range*, not breakout—so chasing longs here is gambling on noise.
- RSI on 15m is hot at 64 while price stalls at 1.4206, a classic bull trap setup.
- ATR is tight (0.0087), meaning the next 4h candle decides direction—my model leans SHORT with TP1 at 1.4049 and TP2 at 1.3944.
- Why now? The stop at 1.4415 is far, but invalidation at 1.4049 is close—risk/reward favors the
XRP+1.37%
I originally just planned to test the waters with a small position, but it nearly fell short? No, it delivered a big move instead! During the repeated intraday swings, I watched the order book for a long while. Every dip held its level, while the volume-price action grew healthier and healthier. My instincts told me this move had potential. I went with the pullback during the day and entered at 0.08454. When I opened the app again after lunch, it had already reached 0.08915, pushing the return to +507.25%. My account was dancing on its own—I was worried it might fall.

Profits, plain and clea
post-image
ZEC-0.29%
SOL+2.21%
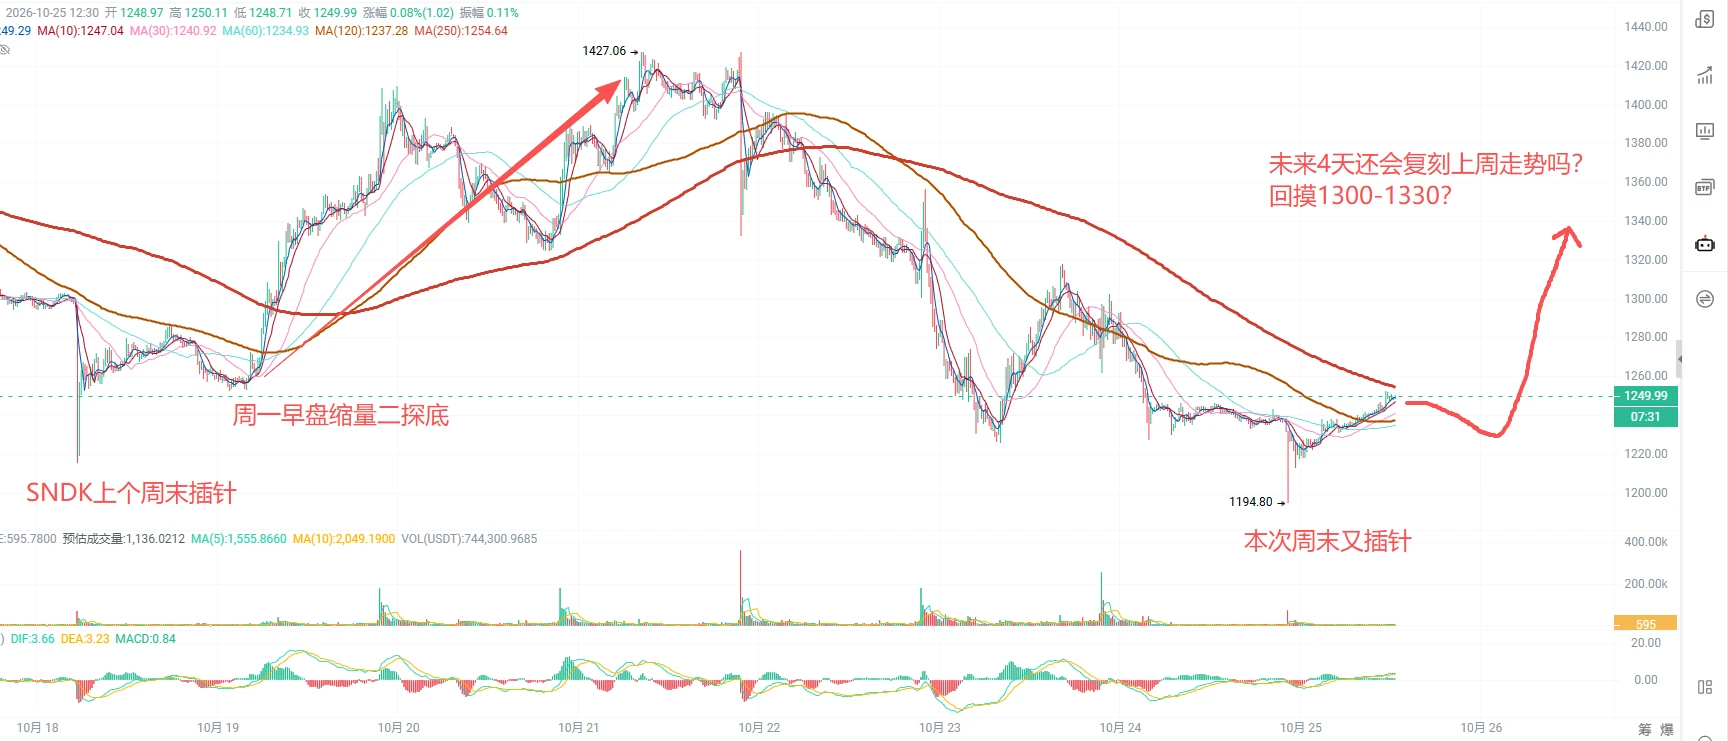
Everyone’s long SNDK, but the 4h chart just whispered a secret the crowd missed.

$SNDK /USDT - SHORT

Trade Plan:
Entry: 1762.72 – 1768.80
SL: 1794.96
TP1: 1743.86
TP2: 1729.26
TP3: 1707.36

Why this setup?
- RSI 15m at 62.25 shows fading momentum, not strength.
- ATR 1h at 12.16 means volatility is tight—waiting to snap.
- Price pinned at 1765.76 with TP1 at 1743.86: a clean 1.2% drop zone, no noise.
- Why now? Range-bound 1D trend + SHORT bias = mean reversion is the only game in town.

Debate:
Is the 1768.80 high the bull trap that sends us to TP1, or do we fade the fade?

⚠️ Pe
SNDK+2.93%
U.S job report market impact
live-cover
LIVE1,092
Everyone’s watching XLM’s breakout—but the 4H chart just whispered a different secret.

XLM/USDT - SHORT

Trade Plan:
Entry: 0.18407 – 0.18483
SL: 0.18814
TP1: 0.18168
TP2: 0.17984
TP3: 0.17707

Why this setup?
Why now? The 1D trend is dead range, and the 4H bias flips SHORT at 55% conviction. Price sits at 0.18445, hugging the entry zone with RSI 15m at 56.86—no overbought fuel, just heavy air above. ATR 1h (0.001538) shows tight coils, but TP1 at 0.18168 is a 1.5% drop that breaks the local floor. Momentum is fading, not building. The “waiting” status means the trap is set—either we slide
XLM+3.26%
Everyone’s staring at 91.55—but the real trap is the 4h candle that hasn’t closed yet.

$CL /USDT - SHORT

Trade Plan:
Entry: 91.46 – 91.64
SL: 92.42
TP1: 90.90
TP2: 90.46
TP3: 89.81

Why this setup?
Why now? The range-bound 1D trend is your enemy—it rewards patience, punishes impulse.
- RSI 15m at 57.7 shows a weak bounce, not a breakout.
- ATR 1h (0.36) is tight: this coil snaps fast.
- Short bias (55) favors fading rallies into 91.64, not chasing longs.
- TP2 at 90.46 is only ~1.2% away—but only if 91.55 holds as resistance.

Debate:
Are you fading this pop to 91.64, or waiting
CL+0.24%
$USDT anyone saw like this chart 1.7 for usdt price today?
#usdt
post-image
USDT0.00%
The suppression is pretty obvious···
Zelensky: Stop attacking Russia from now until September 7
What does that mean—is he taking the weekend off😂?
post-image
Here is your Daily dose to remind you of what can happen with $TEL in any momemt.
Staying 100% focused!!!
post-image
TEL-0.36%
$SOL Signal】1H volume-expansion rally, bullish momentum across multiple timeframes
$SOL The 1H MACD histogram continues expanding at 0.1382, with 4H expanding in sync. The funding rate remains stable at 0.0033%, the bid-side share is 1.08, active buy orders surged to 580,000 lots between 12:00 and 13:00, and the price has held above EMA20.
🎯Direction: Long
⚡Entry/Limit order: 102.9004 - 103.2100
🛑Stop-loss: 102.1779
🚀Target 1: 104.7582
🚀Target 2: 105.5322
🛡️Trade management:
- Execution strategy: After reaching Target 1, reduce the position by 50% and move the stop-loss up to breakeven.
post-image
SOL+2.21%
BTC+0.44%
ETH+1.09%
9.6 DASH Coin Analysis
Put simply, DASH’s surge this time was driven by the Grayscale Zcash ETF taking off, with funds moving through privacy coins one by one and DASH, as an established leader, getting picked next. Technically, it formed a golden pit at 54.15 (below the Bollinger lower band at 62.32), followed by a large bullish candle that surged straight to 74.63—the textbook “whale accumulation–violent rally–breaking away from cost basis.” The price is now pulling back to the middle band at 67.45, while the MACD golden cross remains in place (0.09). The bulls are not completely dead, but $
post-image
DASH+24.22%
ZEC-0.26%
Everyone’s long PEPE while the 4h chart whispers a different secret.

PEPE/USDT - SHORT

Trade Plan:
Entry: 0 – 0
SL: 0
TP1: 0
TP2: 0
TP3: 0

Why this setup?
- Signal says SHORT with 55% confidence—not a scream, but a warning.
- 1D trend is *range*, not breakout—so buying tops here is gambling.
- RSI on 15m at 57 shows a dead bounce, no fuel for a push higher.
- Why now? The “waiting” status means the trap is set—patience beats impulse.

Debate:
Are you fading this range or riding the fakeout—what’s your PEPE play before 19:00 UTC?
PEPE+2.00%
Everyone’s watching HYPE bleed—but the 4H chart just whispered a secret the crowd missed.

$HYPE /USDT - LONG

Trade Plan:
Entry: 85.409 – 85.721
SL: 84.072
TP1: 86.685
TP2: 87.431
TP3: 88.551

Why this setup?
Why now? The 1D trend is bullish, and the 4H MTF is *Armed* with 95% confidence. RSI on 15m sits at 58.18—not overheated, just warming up. ATR (1h) at 0.622 suggests volatility is coiled. Entry zone: 85.409–85.721. Targets: TP1 86.685, TP2 87.431. The invalidation line at 82.117 is your safety net. This isn’t a gamble—it’s a precision setup with a 2.4R to first target.

Debate:
If pr
HYPE+0.67%
Everyone’s staring at the 1D chart—but this 4h short just armed itself at 0.07769 with 95% confidence.

$H /USDT - SHORT

Trade Plan:
Entry: 0.07730 – 0.07808
SL: 0.08142
TP1: 0.07489
TP2: 0.07303
TP3: 0.07024

Why this setup?
Why now?
- RSI at 39.75 on the 15m shows momentum is already rolling over, not waiting for a bounce.
- ATR (1h) at 0.001553 means volatility is compressing—the break below 0.07730 triggers the trapdoor.
- TP1 at 0.07489 is a 3.6% drop; TP3 at 0.07024 is a 9.6% move if the bearish 1D trend resumes.
- Invalidation sits at 0.07964—tight risk, asymmetric reward.
H-4.48%
Everyone’s long LTC at 54.78—I’m counting the seconds until the 4h rug pull hits SYMBOL.

$LTC /USDT - SHORT

Trade Plan:
Entry: 54.64 – 54.92
SL: 56.58
TP1: 53.43
TP2: 52.53
TP3: 51.17

Why this setup?
- RSI on the 15m is already overheated at 68 while price sits mid-range—no fuel left for upside.
- 1D trend is *range*, and we’re at the top of that range with a 77% short conviction.
- ATR (0.58) is tight, meaning the breakout is violent when it comes—and it’s pointing to TP1 at 53.43 before you blink.
- Why now? Because the 4h structure is rejecting 54.92, and the waiting game ends w
LTC+8.37%
tendies-2:native breakout & retest
post-image
  • 4
Crypto market cycle.
Do you agree with this?
post-image
#BTCReclaims80K
🚨 BTC Reclaims $80K — Breakout or Another Market Test?
#BTCReclaims80K 📈🔥
Bitcoin is back in the spotlight.
After trading in the high-$70K region, BTC reclaimed the psychologically important $80,000 level, briefly pushing above $81K and reaching a multi-month high. The move was supported by improving risk sentiment, changing expectations around U.S. monetary policy, and renewed demand through spot Bitcoin ETFs.
But for traders, the most important question is not:
“Did BTC touch $80K?”
The real question is:
Can Bitcoin HOLD $80K?
That distinction could determine the next maj
BTC+0.44%
Load More

Join 40 M users in our growing community

⚡️ Join 40 M users in the crypto craze discussion

💬 Engage with your favorite top creators

👍 See what interests you

View More