Share your thoughts
placeholder
Article
Good morning, everyone. Although the broader market was still mainly range-bound and volatile last weekend, quite a few altcoins have already begun to rebound.
Last week, I also kept asking everyone to pay more attention to major altcoins that had not truly started moving yet. Judging from their performance over the past two days, more and more altcoins are indeed starting to catch up, which also makes me feel that the market is showing signs that “altseason is coming.”
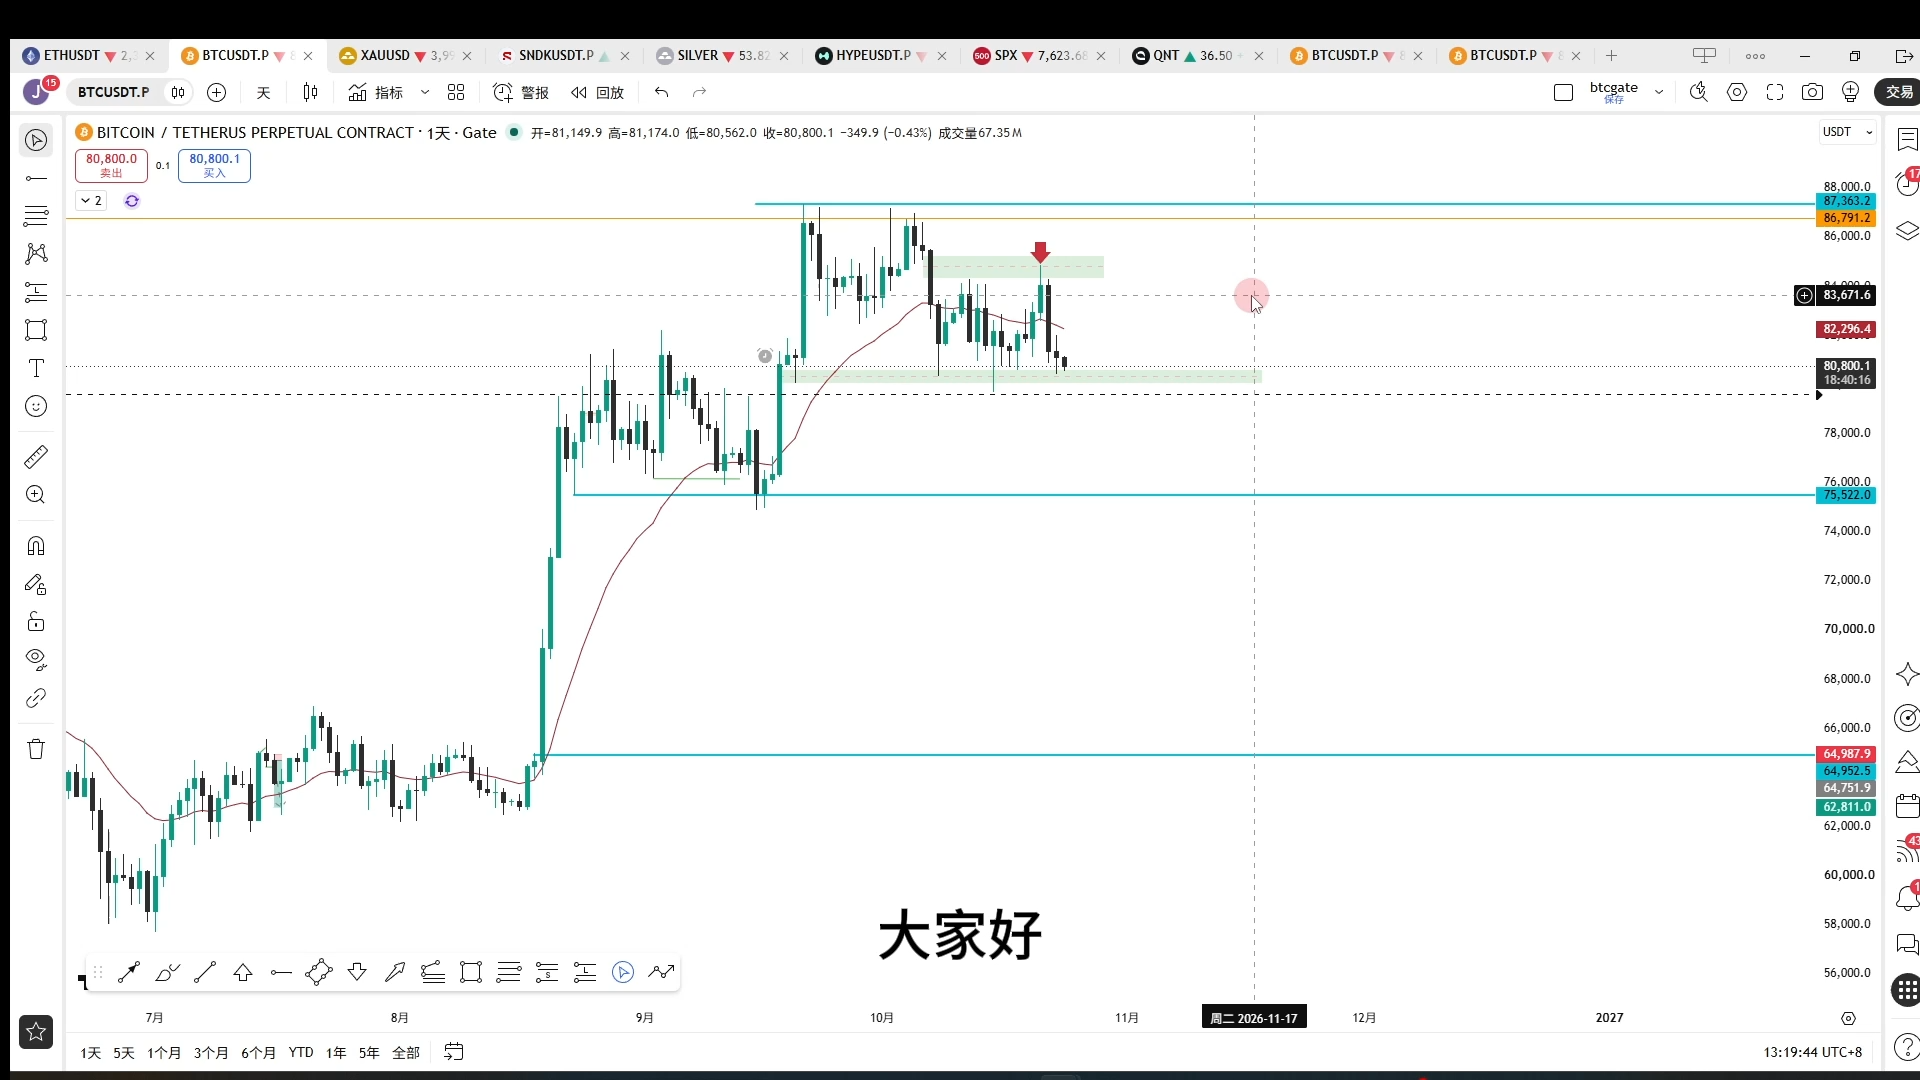
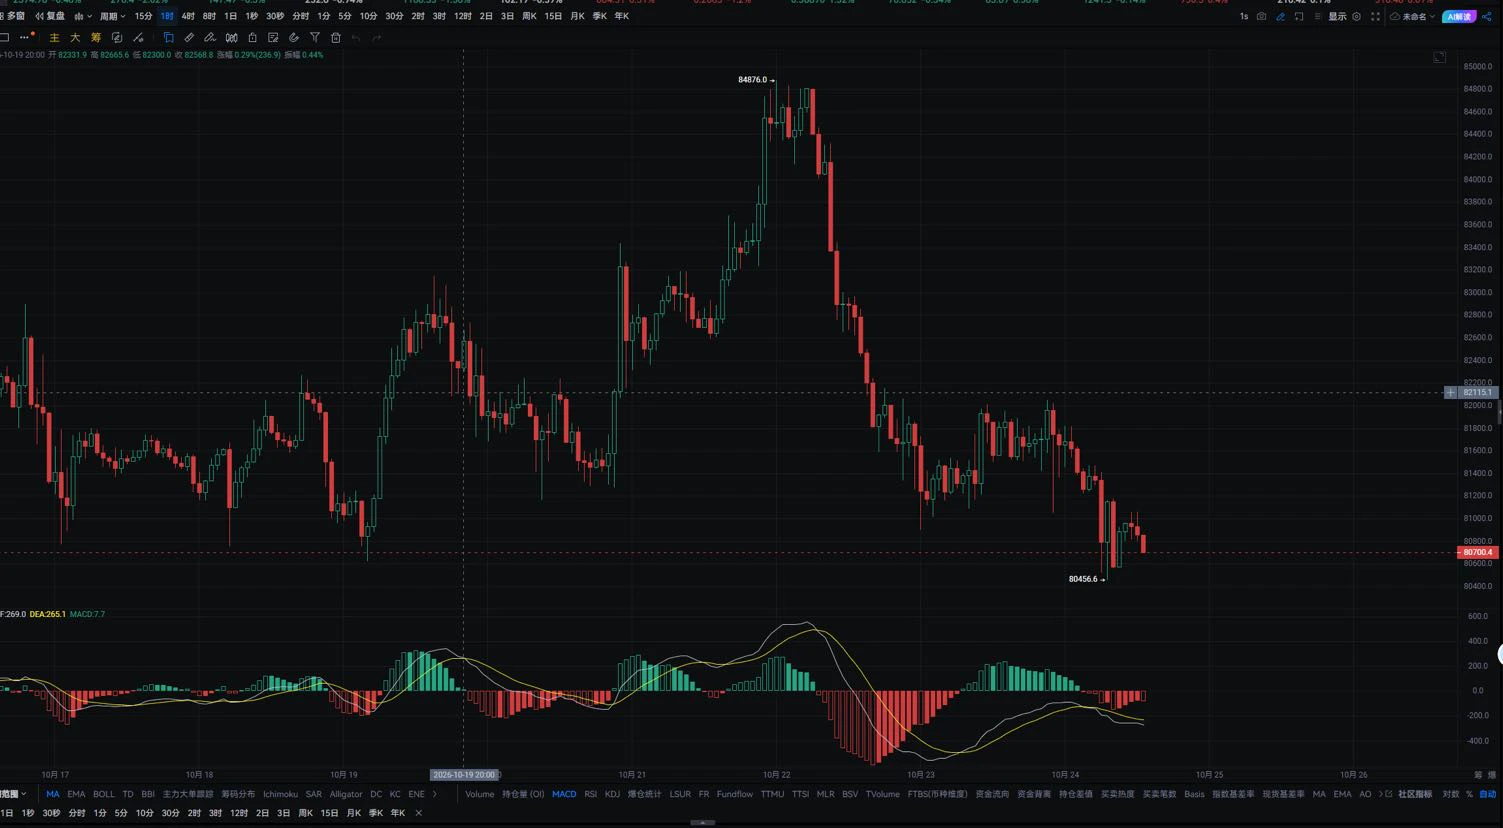
Whether the altcoin market can continue from here still depends largely on whether BTC can hold around $80,000.
If BTC pulls
BTC+1.36%
ETH+3.28%
SOL+2.83%
I had already finished complaining to a friend about this week's market, only to have to take it all back—pretty awkward. A few days ago in the afternoon, $WAL retested and held firm, buying strengthened, and I reminded longs not to rush: as long as it continued bottoming without breaking down, keep holding.

First, let's look at the results: entered at 0.02709, reached 0.03217, return +894.83%. It was truly sluggish at first, but the breakout feels great.

Panic comes from having no plan; losses come from overthinking.

Hold as long as the trend remains intact; run if it breaks down.

Fo
post-image
WAL+0.75%
SNDK+2.07%
ADA+4.64%
#BTC   #Bitcoin #行情分析   #Cryptocurrency #Bitcoin
The medium-term structure (bullish daily moving averages, recovering hashrate, and continued ETF accumulation) remains intact, but most of the short-term upward fuel (short covering) has already been consumed, and the thickest supply wall in the entire market lies directly ahead. So my current baseline view is “bullish direction, grinding pace”—the more likely path is to range between 80k–83k and then choose a direction, rather than rally in a straight line. The risk-reward of chasing highs here is not attractive; waiting for a pullback to
post-image
BTC+6.16%
  • 1
[$ETH Signal] Long + 1H pullback to EMA20 stabilizes, sniper entry
$ETH On the 1H timeframe, after a wick to the 2708 high, price pulled back to 2642 and is now consolidating sideways around 2660. Sell orders are stacked extremely heavily in the order book, with a buy/sell ratio of 0.23; despite the heavy selling pressure, price has not broken down, and support around the EMA20 remains solid. The MACD histogram at 5.42 is beginning to contract, while RSI at 61.73 still has room before reaching the overbought zone. The funding rate is 0.0092%, indicating extremely low holding costs. The upper
post-image
ETH+3.17%
JUST IN: Critics flag Kalshi’s ETH-PERP volumes, citing a ~174x daily turnover vs. open interest and a small top position, arguing potential inflations in reported metrics. Could spark scrutiny of prediction-market liquidity. $ETH $KALSI
post-image
KALSHI+6.94%
ETH+3.17%
9.21 SOL Analysis
Analysis: Go long on a pullback to around 109.5–110.5, with a stop at 108.5, a first target of 113.0, and a second target of 114.5.
On the 1H chart, the price began a rebound from the swing low of 107.34, quickly surged to the swing high of 113.40, then encountered concentrated short-term selling pressure and pulled back. The bearish candle completed a short-term profit-taking washout, while the overall bullish rebound structure remains intact. The rapid pullback is a normal shakeout during the uptrend, and the key support area below has strong buying support. The Bollinger B
post-image
SOL+2.83%
First time in 45 weeks! $BTC closes above the 50-week moving average— is 81000 just the beginning?
Guys, the bear-market bottom may already be behind us. Are you still waiting for a pullback?
Galaxy's head of research confirmed: BTC closed above the 50-week moving average for the first time in 45 weeks, rising 29% over the past 35 days. Historically, this signal often confirms that a bear-market bottom has formed.
Check the candlestick chart:
Resistance: 81620-82000
Support: 80800-80068
The MACD has formed a golden cross, but momentum is weakening. RSI at 57 is neutral, and a short-term pullb
post-image
BTC+1.28%
$MU
$MU: Local bottom before earnings or a bull trap?
Ahead of the key date—the release of the financial report on September 30—a serious battle is unfolding in Micron ($MU) shares. After an extended rally, the stock has pulled back 22% from its June highs.
Why current levels are attractive for a long position:
AI supercycle in full swing:
In addition to powerful GPUs from Nvidia, artificial intelligence models critically need ultra-fast, high-bandwidth memory (HBM3).
Micron remains a key beneficiary of this infrastructure boom.
Indicator cooldown: The deep correction has cleared the technica
MU+3.80%
September 21 Market Analysis
Bitcoin Silk Road Reference Setup
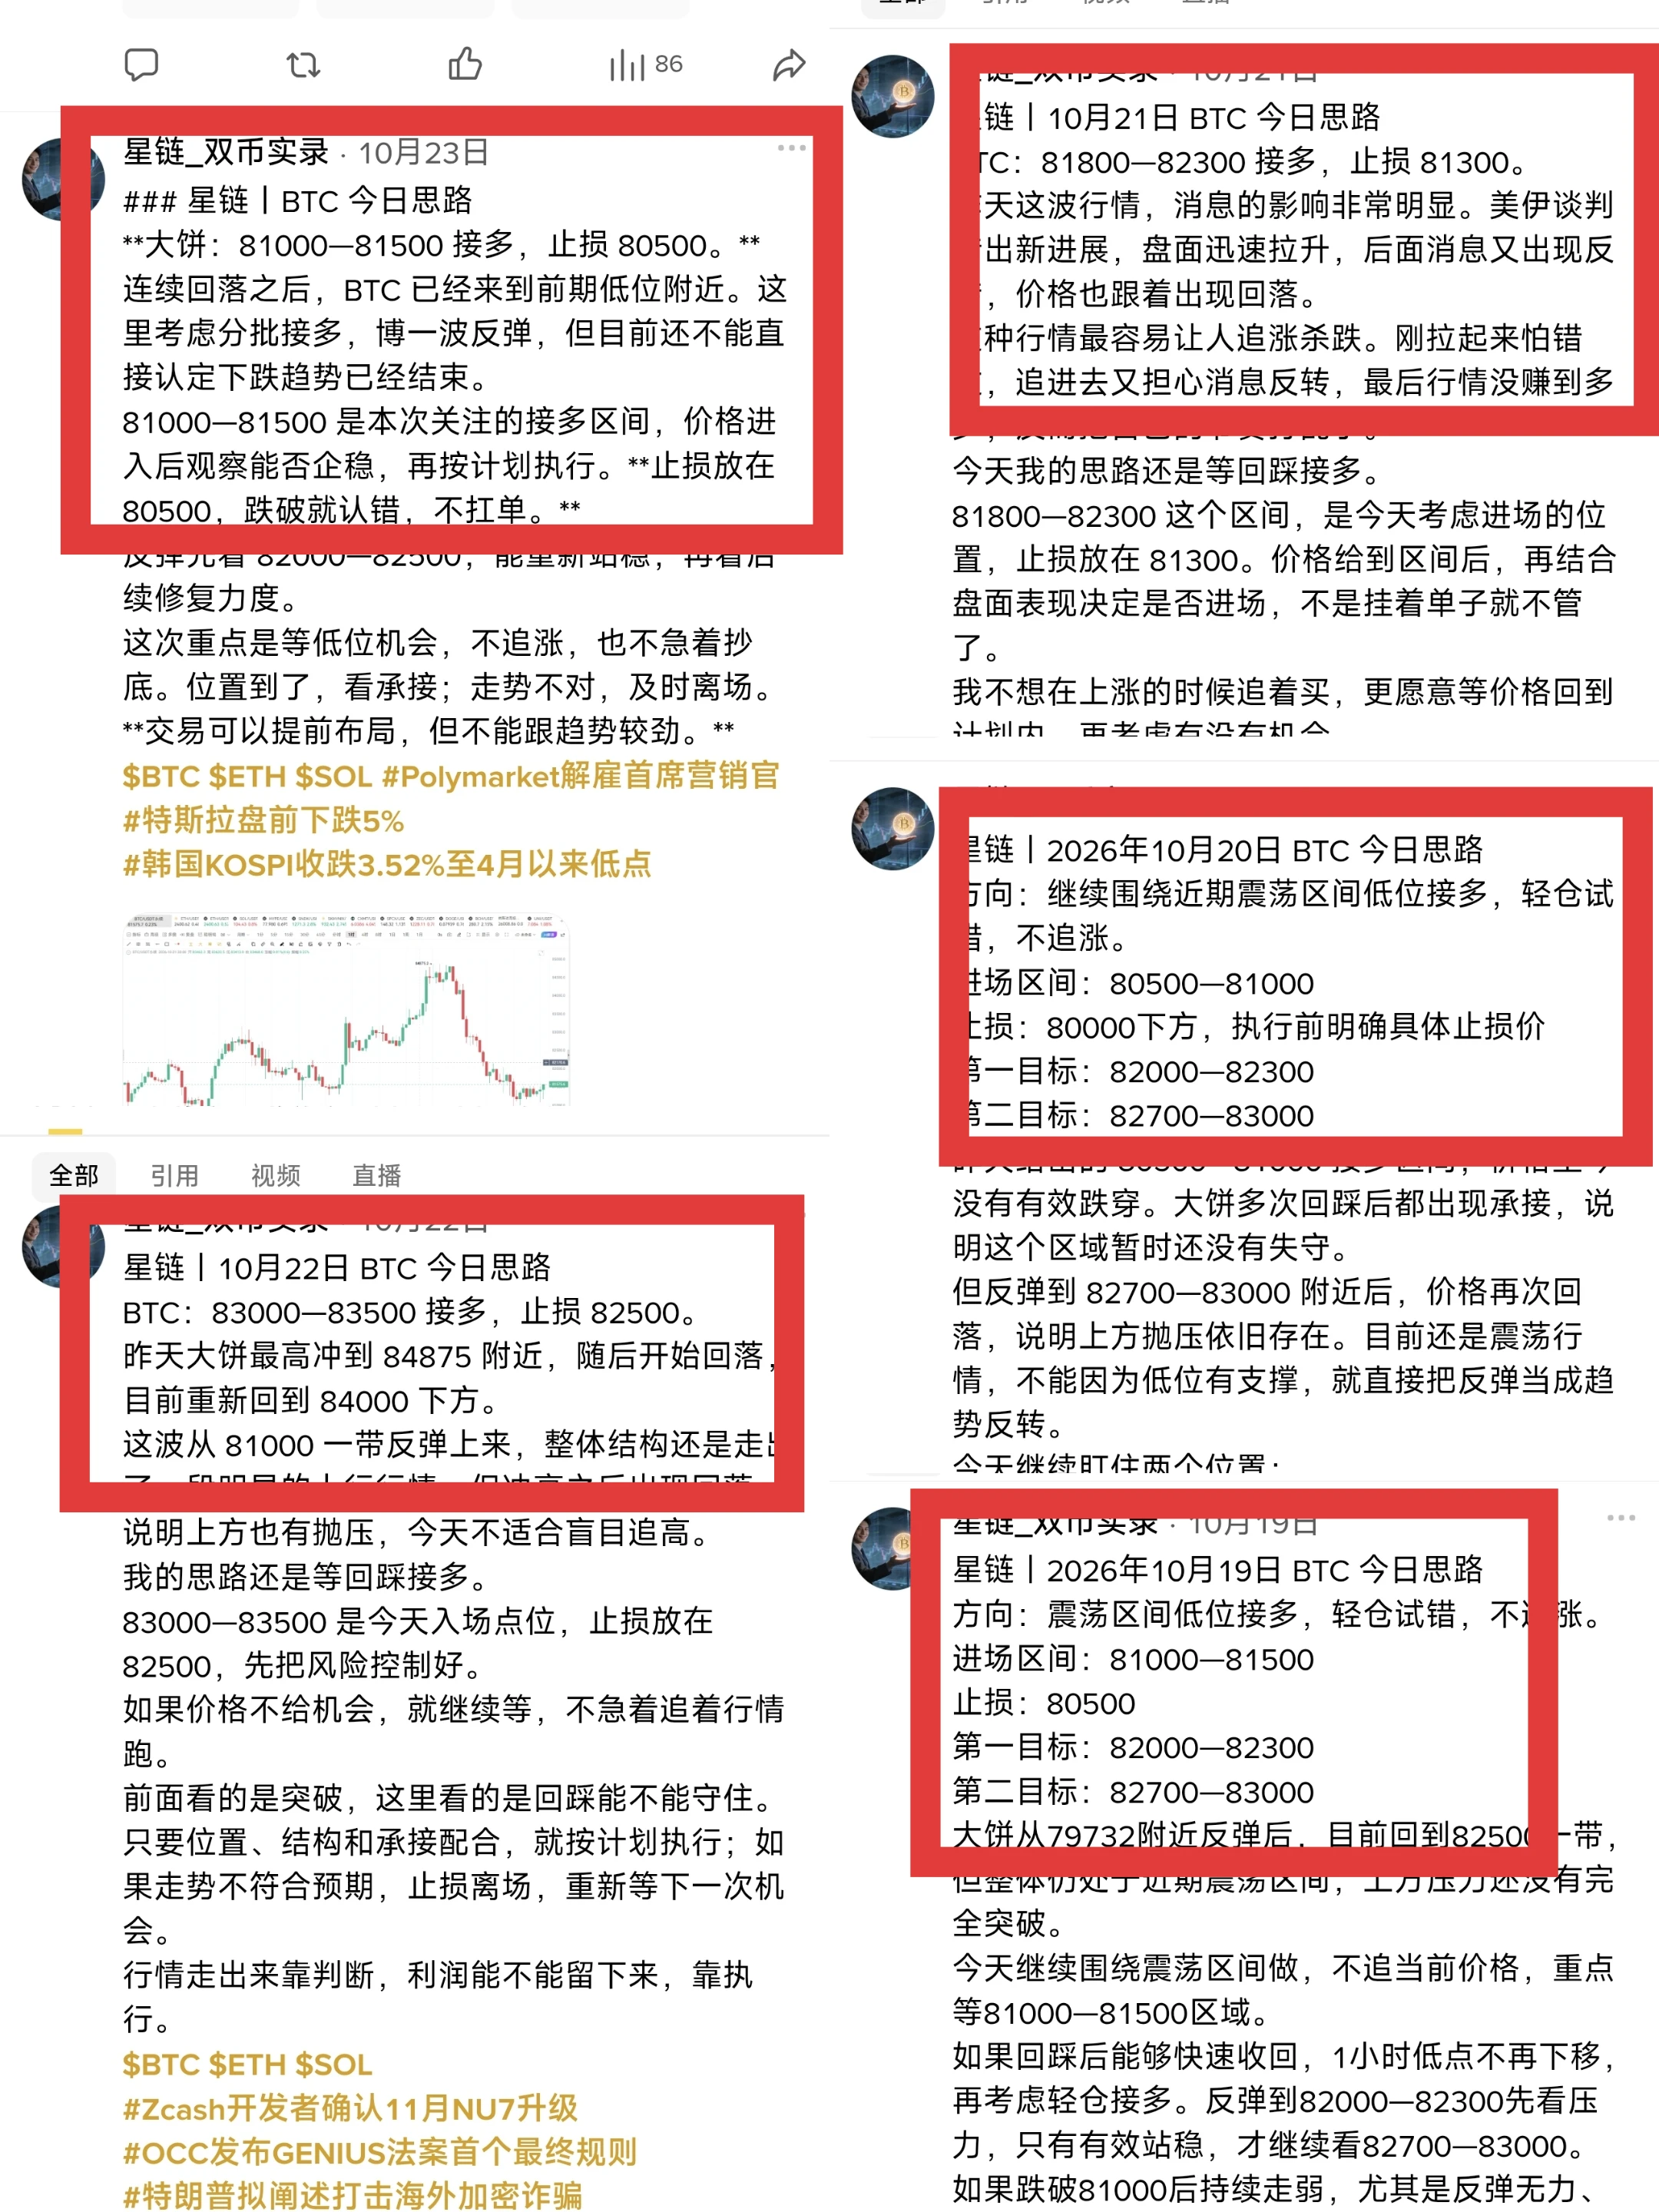
Entry range: around 81000–80500 — “Duo” (as written; meaning uncertain)
“Zhisun” (as written; meaning uncertain): 80000
First target: 82000; second target: 82800
After surging to 82099.9, Bitcoin formed consecutive large bearish candles, with longs taking profits en masse and a short-term pullback beginning.
Bollinger Bands: The price pulled back to the middle band, which serves as the bull-bear dividing line
Upper band: 81393.9|Lower band: 80872.3
Moving averages: The short-term yellow line has broken down and turned i
BTC+1.28%
ETH+3.17%
#BTC重回80K
Reclaiming levels above $80,000–$81,000 signals a clear shift in momentum, supported by institutional spot ETF inflows and the liquidation of short positions.
1. Market Outlook: Consolidation or Rally Continuation?
* Momentum Scenario: Holding above $80,000 indicates that strong spot demand has stepped in following the liquidation of leveraged short positions. If buyers maintain this level as support, the most likely direction remains upward.
* Sideways Scenario: Regaining key psychological levels often requires a period of retesting and consolidation before moving higher. Sideway
BTC+1.36%
Watching the market nonstop gets exhausting; turning it off actually makes things clearer, and when my eyes aren't glued to it, my mind doesn't panic either. A few nights ago, I glanced at $SKHYNIX before bed. Money was quietly flowing in, it was forming a base without breaking down, so I didn't call for a charge—I only suggested opening a long with a small position to test the waters, then following once it held firmly. When I opened the chart in the morning, it went from 1171.00 to 1357.81, delivering +1132.75% straight away. Feels great, brothers. It was really sluggish earlier, but once it
post-image
SKHYNIX+1.65%
SNDK+2.07%
DOGE+3.55%
$BTC The weekly chart has just posted its highest close in 4 months!
The price has moved back above the 50-week moving average. This is the first time in nearly 10 months that it has truly reclaimed this level! The medium-term trend is finally beginning to show clear signs of recovery. This weekly candle carries far more weight than an ordinary rebound! BTC’s latest weekly close reached a new high for nearly 4 months while also moving back above the 50-week moving average, marking the first time in approximately 10 months that it has truly reclaimed this medium- to long-term trendline. Many pr
post-image
BTC+1.36%
ZEC+4.54%
Thank You so much for selling your coins in a cheap price for me
$SI will cross $10M 12 hours later
I will tag this post again
Ca : 0xEF82DDc566653699B89C3aFe123559a75aAA2976
post-image
PTB | Long-term 🟢 | 15-minute entry: 0.001016 Stop-loss: 0.000898876 Take-profit 1: 0.0011624 | Take-profit 2: 0.00125025 | Take-profit 3: 0.00136737 For reference only; do not chase the trade. If the stop-loss is hit, the setup is invalidated. Technical setup only. Not financial advice. $PT
post-image
PTB+94.78%
9.21 BTC: Take a light long position around 81000, with targets at 81700/82500/83500
BTC surged from 74909 to 81732 on the 1H chart, with the moving averages in a bullish alignment. It is currently consolidating at the highs around 81400, so you can patiently wait for a pullback to enter long. I will continue adding to my long position if it retests around 81000.
ETF inflows have resumed, and risk sentiment is recovering. Supply concerns in the Middle East have eased, oil prices have pulled back, and short-term sentiment has improved significantly.
After 9 years of trading, the closer we get t
post-image
BTC+1.36%
$DOGE DOGEUSDT: Price Under Pressure, Channel Keeps Bulls Lower
DOGEUSDT is trading around 0.0877 USDT following a recovery from the 0.079–0.080 zone. However, the H4 structure remains within a descending channel, with previous rallies rejected at the channel's upper boundary.
The 0.0890–0.0910 zone currently serves as key resistance. If DOGE fails to clear the trendline and subsequently loses the EMA34–EMA89 cluster around 0.0850, I lean towards a scenario where the price drops to 0.0820 before extending down to the primary target near 0.0790 USDT.
The macroeconomic backdrop today is mixed. G
post-image
DOGE+3.55%
Insiders are calling $LINK /USDT a trap, but the numbers say otherwise.

$LINK /USDT - LONG

Trade Plan:
Entry: 12.551 – 12.635
SL: 12.194
TP1: 12.893
TP2: 13.092
TP3: 13.392

Why this setup?
Why now? The daily trend is bullish with a 95% confidence score, and the 1h price sits at 12.593, right inside the entry zone of 12.551 to 12.635. The 15m RSI at 54.12 shows room to run before overbought, while the 1h ATR of 0.166456 confirms enough volatility to reach TP1 at 12.893 and push toward TP2 at 13.092. The invalidation level at 11.708 is the hard stop that protects the long bias.

Debate:
A
post-image
LINK+5.12%
Crypto market update
live-cover
LIVE1,896
Important Notice

Recently, it has come to light that others have stolen my course materials—including position management, four trading strategies, and key inflection-point levels—and are privately selling them at high prices.

Although they have stolen the textbook content and operational procedures, they cannot grasp the underlying essence of trading or understand the logic behind capital movements. Please keep your eyes open, do not be deceived, and do not become someone else’s “drinking snack.” Make sure to identify the genuine materials, exercise rational judgment, and beware of scams.
post-image
Load More

Join 40 M users in our growing community

⚡️ Join 40 M users in the crypto craze discussion

💬 Engage with your favorite top creators

👍 See what interests you

Trending Topics

BTCBreaks82K

57.68k Views18.21k Discussing

BTC has reclaimed the $80,000 level and is consolidating near 81K. The $79,800-$80,500 zone serves as near-term support, while $82,000-$82,900 remains key resistance. Funding rates are back to neutral, and spot ETF inflows have resumed. Breakout or pullback?

GateVoyage

7.44k Views9.13k Discussing

CryptoMarketCapBackAbove2.8T

41.04k Views568 Discussing

View More