Share crypto content and earn up to 60% commissions through content mining.
placeholder
gatefun
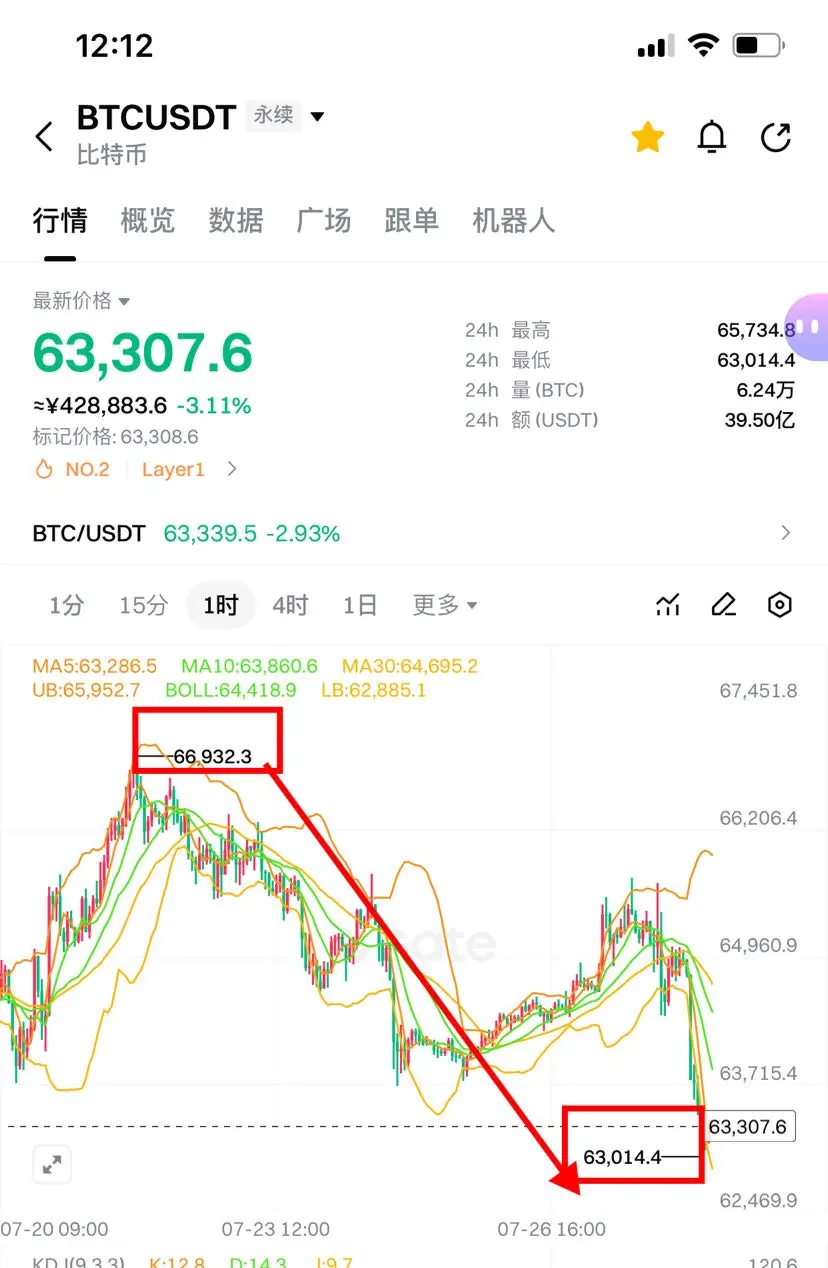
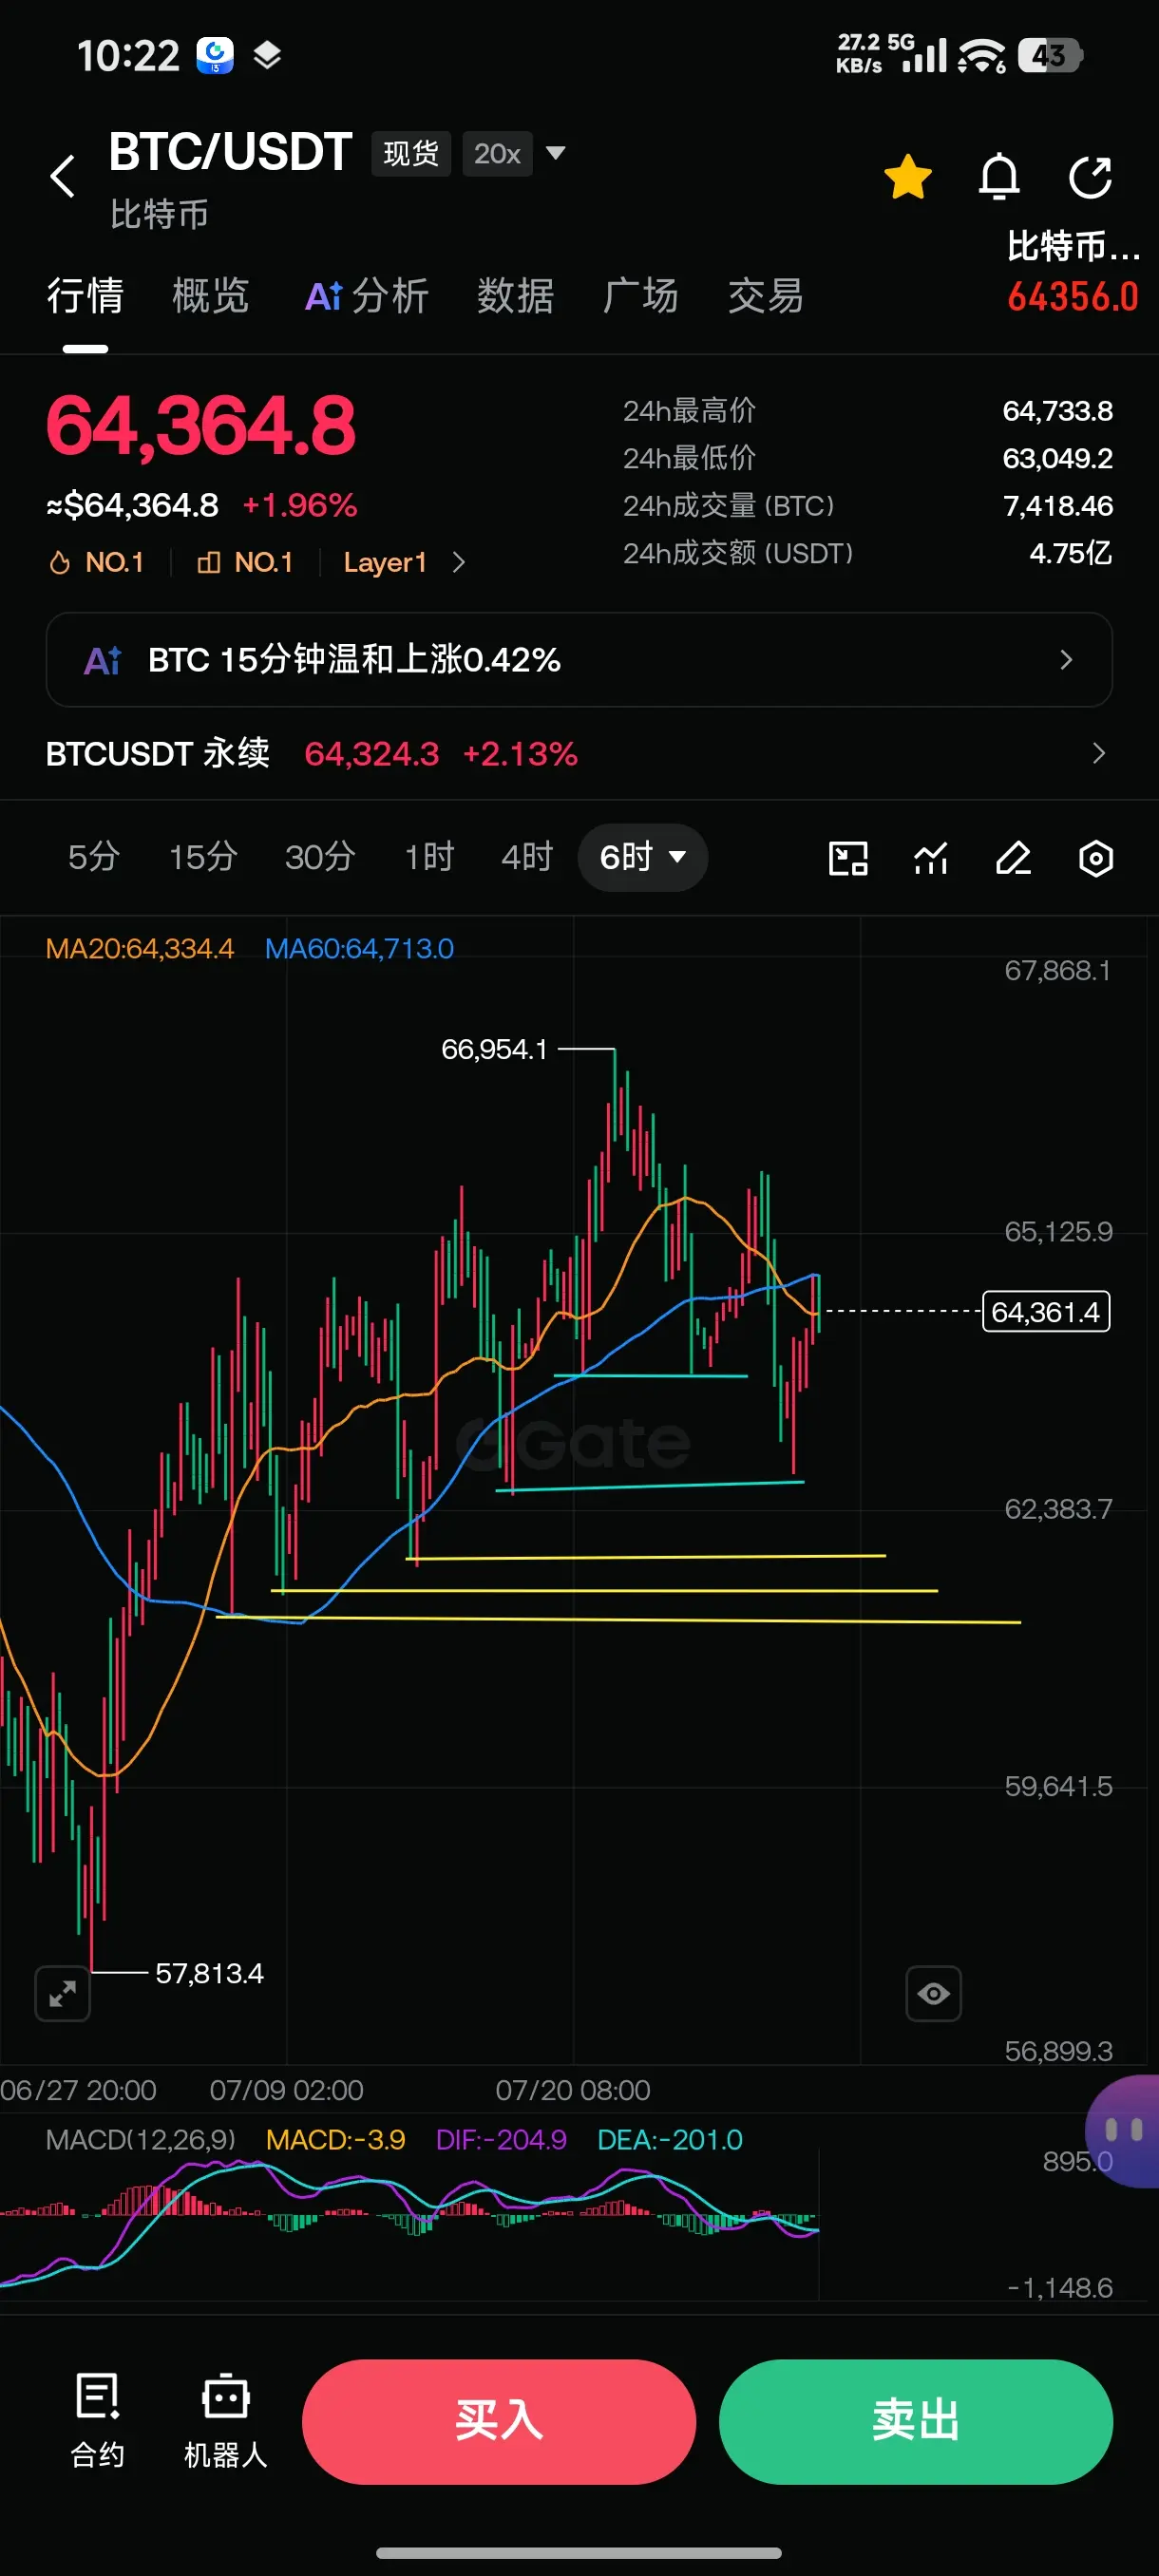
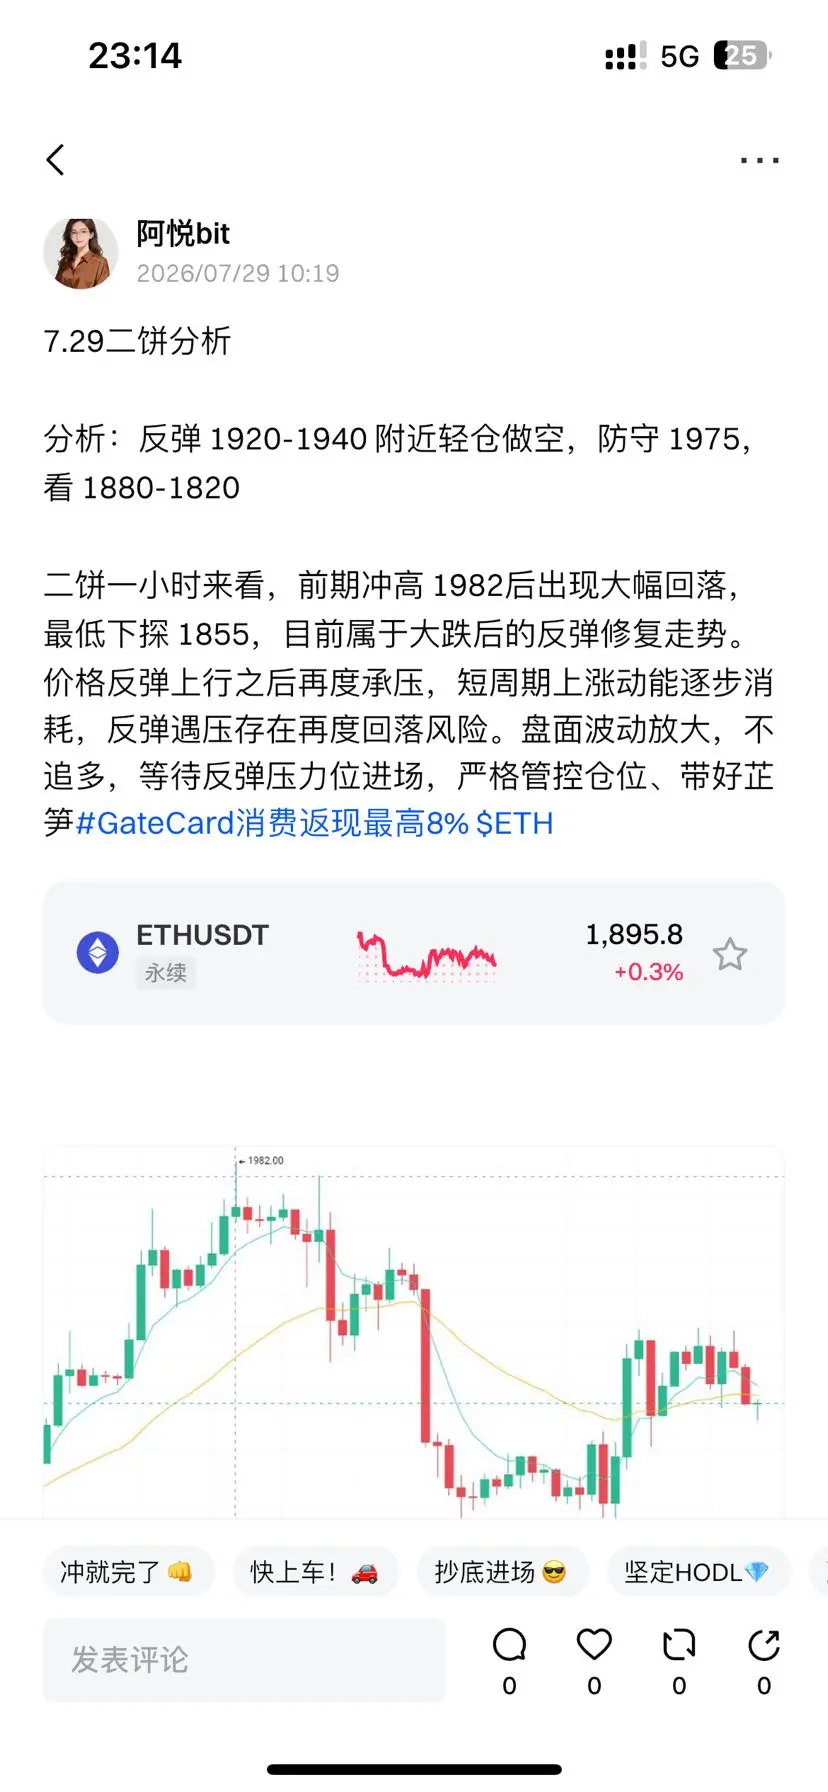
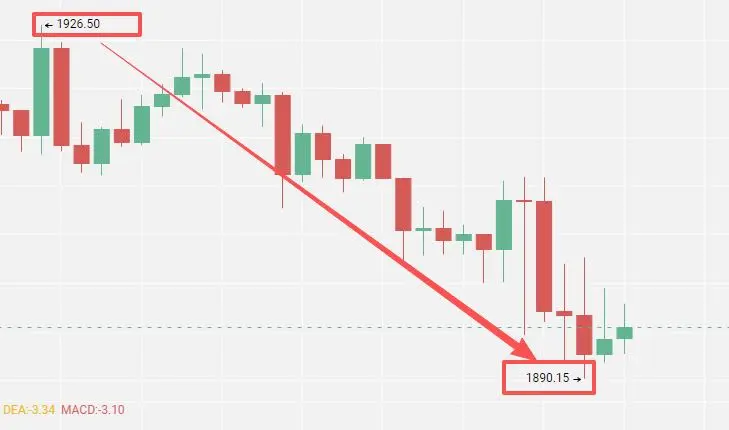
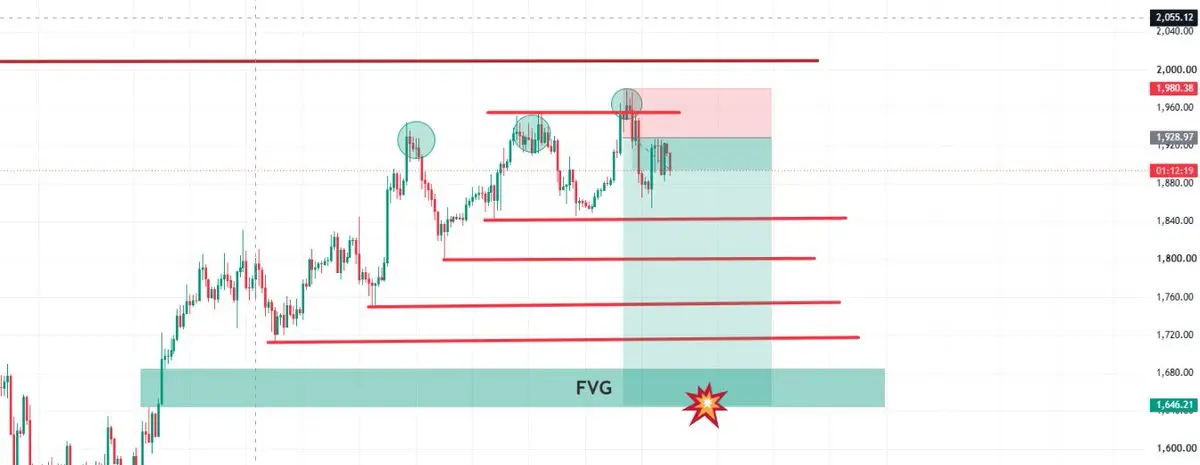
BTC’s daily chart is still in a choppy range without a breakout, with clear resistance overhead; the 4-hour timeframe has formed a pullback structure. A MACD dead cross keeps bearish momentum going. Although short-term indicators are oversold and may see a relief bounce and repair, the bounce is likely a chance for a second round of selling pressure—suitable for playing a short at higher levels.
You can place an entry around 66,000🈳, add around 66,600, and watch for downside to 64,800 and 63,000.
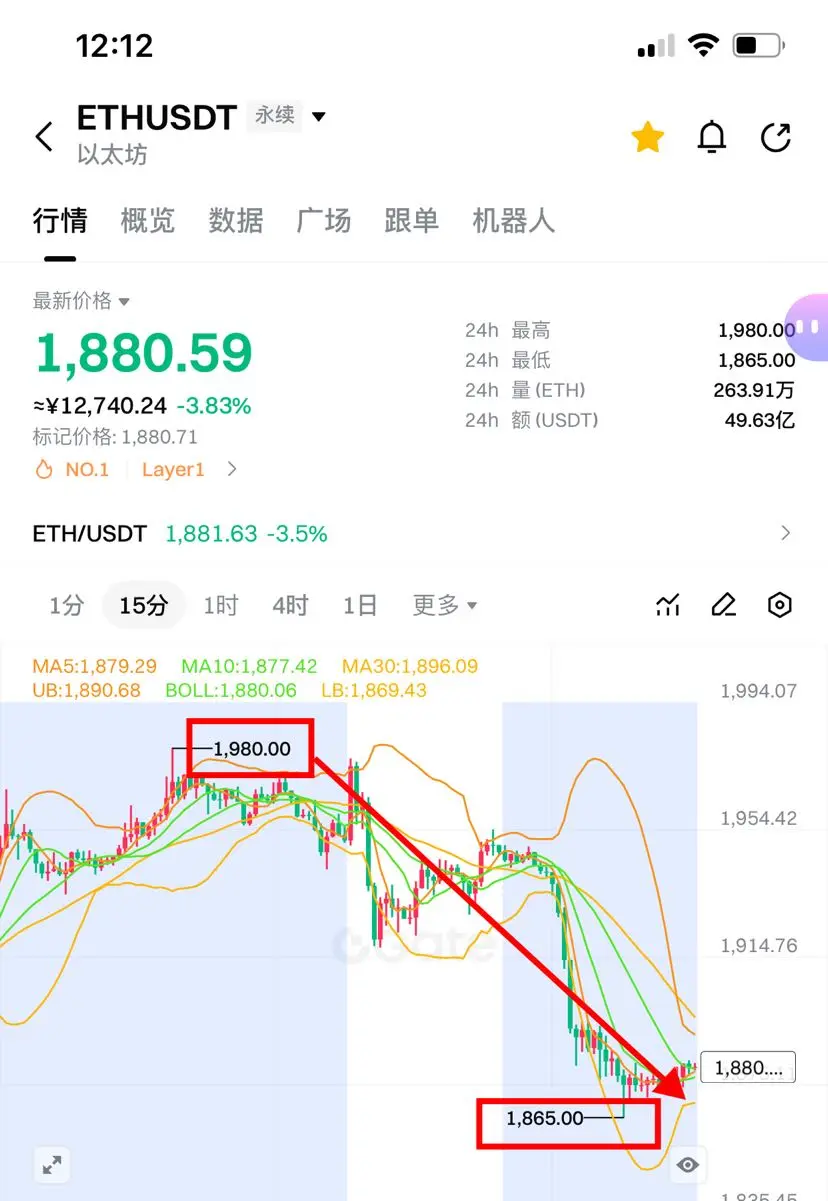
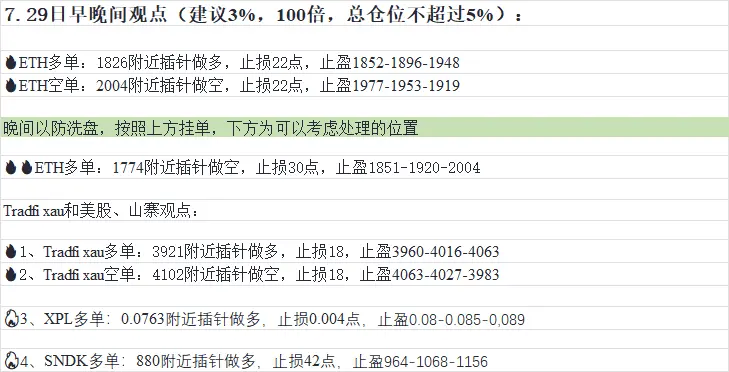
ETH🉑 around 1,940🈳, add around 1,970, and watch for downside to 1,880 and 1,820.
$BTC ‌#
BTC-0.45%
View Original
post-image
  • Reward
  • Comment
  • Repost
  • Share
#MoonshotAIReportedlyInPreIPOAt50Billion
𝗠𝗼𝗼𝗻𝘀𝗵𝗼𝘁 𝗔𝗜 𝗜𝘀 𝗥𝗮𝗰𝗶𝗻𝗴 𝗧𝗼𝘄𝗮𝗿𝗱 𝗮 $𝟱𝟬 𝗕𝗶𝗹𝗹𝗶𝗼𝗻 𝗩𝗮𝗹𝘂𝗮𝘁𝗶𝗼𝗻—𝗔𝗻𝗱 𝗜𝘁'𝘀 𝗡𝗼𝘁 𝗝𝘂𝘀𝘁 𝗕𝗲𝗰𝗮𝘂𝘀𝗲 𝗼𝗳 𝗛𝘆𝗽𝗲
Artificial intelligence is no longer rewarding companies for ambitious ideas alone. Today's market values 𝗲𝘅𝗲𝗰𝘂𝘁𝗶𝗼𝗻, 𝗽𝗿𝗼𝗱𝘂𝗰𝘁 𝗽𝗲𝗿𝗳𝗼𝗿𝗺𝗮𝗻𝗰𝗲, and 𝗿𝗲𝗮𝗹 𝗿𝗲𝘃𝗲𝗻𝘂𝗲 𝗴𝗿𝗼𝘄𝘁𝗵. Moonshot AI's latest funding plans suggest it is delivering on all three.
According to reports, 𝗠𝗼𝗼𝗻𝘀𝗵𝗼𝘁 𝗔𝗜 is preparing to begin 𝗣𝗿𝗲-𝗜𝗣𝗢 𝗳𝘂𝗻𝗱𝗶𝗻𝗴 𝘁𝗮𝗹𝗸𝘀 in 𝗔𝘂𝗴𝘂𝘀𝘁
post-image
post-image
  • Reward
  • 6
  • Repost
  • Share
BlackoutHawkCryptoBoy:
2026 GOGOGO 👊
View More
BTC MARKET UPDATES
gate liveLIVE
1,820
  • Reward
  • Comment
  • Repost
  • Share
To be honest, the domestic model I’m most looking forward to right now is DeepSeek.
View Original
post-image
  • Reward
  • Comment
  • Repost
  • Share
According to SoSoValue data, as of July 23 in U.S. Eastern Time, total net inflows into Bitcoin spot ETFs were $68.99M. The Bitcoin spot ETF with the highest net inflow yesterday was Blackrock’s ETF IBIT, with a net inflow of $38.7795 million. Total net inflows into Ethereum spot ETFs were $72.6422 million, and the Ethereum spot ETF with the highest net inflow yesterday was Blackrock’s ETF ETHA, with a net inflow of $53.4667 million.
BTC-0.48%
ETH0.18%
View Original
post-image
  • Reward
  • Comment
  • Repost
  • Share
Bitcoin needs to hold above 68k, and ETFs must continue seeing inflows to confirm a trend reversal. If tomorrow the ETF turns back into outflows again, the price could instantly drop back to 65k. 70k is stronger resistance above, while 65k–66k is support below. #GOOGL财报亮眼但盘后跌超3%
BTC-0.80%
GOOGL-1.45%
View Original
post-image
post-image
  • Reward
  • Comment
  • Repost
  • Share
July 23 Afternoon Quick Analysis
On the chart, resistance is clearly visible around 1950. Downside, 1909 is the key support in the recent period. The overall market is in a range-bound, gradual bottoming phase. In terms of execution, look more and act less. Focus on the breakout direction in the 1900–1950 range. Support at 1909, resistance at 1950.
Suggestion: Buy around 1910, target 1940–1960#特朗普警告9月政府停摆
View Original
post-image
  • Reward
  • Comment
  • Repost
  • Share
The Xishiku Church ⛪️ is truly beautiful.
A clean, neat Gothic style.
The original site was to the west of Ziguang Pavilion on the west bank of the Zhonghai. It was dismantled once during the Daoguang era, then rebuilt during the Tongzhi era. Cixi dismantled it again, and during the Guangxu era it was moved to this place.
In 58, it was turned over to the state. In 85, it was returned again to the Catholic Church in Beijing—the long-standing flow of history.
This place is not far from Guangji Temple. It closes one hour later than Guangji Temple—so you can head out from Guangji Temple fi
View Original
post-image
post-image
post-image
post-image
  • Reward
  • Comment
  • Repost
  • Share
Gm Fam
Today is another day to grind harder than yesterday!
post-image
  • Reward
  • Comment
  • Repost
  • Share
#TrumpWarnsSeptemberShutdown
Reports surrounding warnings of a possible United States government shutdown in September have once again placed fiscal policy and political negotiations at the center of public discussion. Statements associated with former President Donald Trump have increased attention on the possibility that disagreements over federal spending and budget legislation could result in a temporary shutdown if lawmakers are unable to reach an agreement before funding deadlines.
A government shutdown occurs when Congress does not approve appropriations or a continuing funding measure
post-image
post-image
  • Reward
  • 1
  • Repost
  • Share
HighAmbition:
2026 GOGOGO 👊
market update
gate liveLIVE
1,737
live-coin
  • Reward
  • Comment
  • Repost
  • Share
$BTC the battle of liquidity
BTC-0.48%
  • Reward
  • Comment
  • Repost
  • Share
July 23, Wanxin’s midday share
The current rebound force is gradually weakening; the upward pattern has basically come to an end, so in the short term you shouldn’t blindly chase.
From the current market view, last night BTC stopped falling after 655 but showed little rebound strength and still failed to break above 665; ETH’s attempt to pressure the 1950 level also lacked enough momentum, and it failed to hold above effectively. In the four-hour chart, BTC has repeatedly tested the 655 support with bearish candles. The current pullback-and-retest confirmation hasn’t finished yet, so
BTC-0.48%
ETH0.18%
View Original
post-image
  • Reward
  • Comment
  • Repost
  • Share
Most traders spend all their time watching RSI 30 and RSI 70...
But one of the most powerful RSI levels is sitting right in the middle.
RSI 50.
Professional traders don't see it as just another number.
They see it as the line that separates bullish momentum from bearish momentum.
🔹️ What Does RSI 50 Represent?
RSI measures momentum.
The 50 level acts as the balance point between buyers and sellers.
When RSI is above 50, buyers are generally controlling momentum.
When RSI is below 50, sellers usually have the advantage.
It's one of the quickest ways to understand who is winning the battle.
🟢
BTC-0.48%
post-image
CryptoSat
One of the most powerful uses of RSI isn't finding overbought or oversold conditions.
It's identifying potential reversals.
But here's the catch:
RSI alone doesn't reverse the market.
Price does.
RSI simply gives us clues that momentum may be changing.
🔴 Oversold Bounce
When RSI falls below 30, selling pressure has become extremely aggressive.
Fear usually takes over.
You'll see traders on social media calling for lower and lower prices.
Then suddenly…
$BTC stops falling.
A bullish candle appears.
Volume starts increasing.
Momentum begins to recover.
This is where oversold bounces often begin.
But remember:
RSI below 30 is not a buy signal.
It's an alert to start paying attention.
🟢 Overbought Rejection
The opposite happens when RSI moves above 70.
Buying momentum becomes extremely strong.
FOMO spreads.
Everyone becomes bullish.
Then momentum starts slowing down.
A rejection candle appears.
Volume weakens.
Price struggles to make new highs.
This is often the first sign that buyers may be losing control.
Again…
RSI above 70 is not an automatic sell signal.
It's simply a warning that conditions may be changing.
🎯 Confirmation Methods
Professional traders never trade RSI in isolation.
They look for confirmation:
▪️ Support and resistance levels
▪️ Bullish or bearish candlestick patterns
▪️ Market structure shifts
▪️ Moving Average reactions
▪️ Divergence signals
The more confirmations present, the higher the quality of the setup.
📈 Why Volume Matters
Volume often reveals whether a reversal has real conviction.
For example:
▫️ RSI below 30 + strong buying volume
= Higher probability of a meaningful bounce.
▫️ RSI above 70 + increasing selling volume
= Greater chance of a deeper correction.
Without volume, many reversals simply become temporary pauses.
📌 RSI reversal signals are not predictions.
They are early warnings that momentum may be shifting.
The best traders don't blindly buy oversold conditions or short overbought markets.
They wait for the market to confirm the story first.
Because in trading…
Patience often pays better than prediction.
repost-content-media
  • Reward
  • Comment
  • Repost
  • Share
$DEXE Short-sell idea validation. The key levels I previously emphasized really have worked; it has now smoothly hit TP3—this profit is already locked in. Congratulations to friends who got in early. If you didn’t catch the ride at the front, don’t force a chase from here—going short from here may face significantly higher risk. Keep watching the market and patiently wait for the next entry opportunity.
DEXE-26.97%
View Original
post-image
  • Reward
  • Comment
  • Repost
  • Share
A couple goes to the civil affairs bureau to file for divorce.
The staff ask: “Why do you want to get divorced?”
The man says: “Because you think I spend too much money.”
The woman says: “I earn some money, but it all gets squandered by him.”
The staff ask: “Where did the money all go?”
The wife says:
“A small path leads to the mountaintop
Carrying boxes, we go up
Only by the combined efforts of three people can we lift it
Once it’s lit, it scatters into a puff of smoke.”
After hearing this, the staff member is instantly stunned:
“What does that mean?”
So, what does that mean?
View Original
post-image
  • Reward
  • Comment
  • Repost
  • Share
#SummerCreationCamp
ALPHABET POSTS ONE OF ITS STRONGEST QUARTERS EVER
Alphabet's Q2 2026 earnings looked almost flawless on paper, yet the market responded with a sharp selloff. On July 22, the company reported revenue of $119.8 billion, up 24% year over year, comfortably beating the $117 billion consensus. Google Cloud once again became the engine of growth, generating $24.8 billion in revenue compared with the $22.3 billion analysts expected. Cloud operating margin also expanded dramatically from 17.8% last year to a record 32.9%, highlighting improving efficiency while demand for AI infras
post-image
post-image
  • Reward
  • 4
  • Repost
  • Share
BlackoutHawkCryptoBoy:
To The Moon 🌕
View More
$BSB Look for short opportunities. Right now, everyone online is shouting “buy the dip,” and at times like this I actually prefer to go the other way. The current 4-hour short structure is still intact; on the daily chart, price is basically ranging between 0.13672 and 0.13748. Take a look at the 15-minute chart: the RSI has already reached 28. Downward momentum may continue, and the volume/energy data has also confirmed real sell pressure.
I’ve already entered around 0.13672 to 0.13748. To the downside, you can watch supports at 0.13434 and even 0.12973. When trading against the trend, mind t
BSB0.50%
View Original
post-image
  • Reward
  • Comment
  • Repost
  • Share
This time it wasn’t me guessing too much—it’s the chart itself that wrote the answer on its face. When the sell-off hit during the early session, $HBAR looked like it might stop falling, but those rebounds never really held. The buy-side was weak and the sell pressure was heavy; the higher you tried to push, the more forced it looked.

I opened a long position around 0.08855. At that time, I wasn’t watching just a single K-line—I was watching that the rebound consistently lacked follow-through. After it spiked, it was quickly pushed back down. Now the price has returned to 0.07259, and the re
HBAR5.31%
BTC-0.45%
ETH0.25%
View Original
post-image
  • Reward
  • Comment
  • Repost
  • Share
Who in the Chinese community has written about this?
View Original
post-image
  • Reward
  • Comment
  • Repost
  • Share
Load More

Join 40 M users in our growing community

⚡️ Join 40 M users in the crypto craze discussion
💬 Engage with your favorite top creators
👍 See what interests you
  • Pinned