
Square
Following
Hot
News
Notifications
Profile
Share your thoughts
placeholder
Article
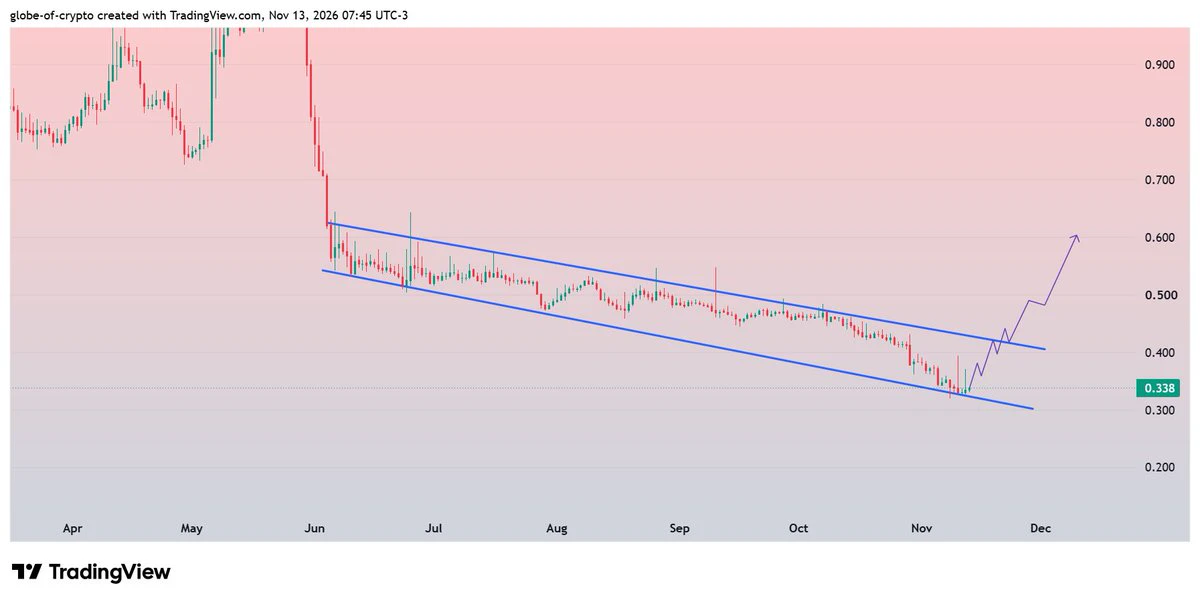
$PSG #PSG
Consolidating on the support of Descending Broadening Wedge.
Bounce could follow our projection for breakout & a solid rise during coming days ✍️
post-image
PSG-1.57%
MARKET UPDATES ABOUT EVERY COIN....
live-cover
LIVE2,483
Trenches
mihao
m
bade
b
mihao
4Cxj...pump
Market Cap
$.
Change
.
24h Vol
$.
Holders
.
AGT
A
bade
b
AGT
0x5d...e274
Market Cap
$.
Change
.
24h Vol
$.
Holders
.
FOOD
F
bade
b
FOOD
FTu5...pump
Market Cap
$.
Change
.
24h Vol
$.
Holders
.
IDOL
I
bade
b
IDOL
0x3b...ab07
Market Cap
$.
Change
.
24h Vol
$.
Holders
.
AI
A
bade
b
AI
2T56...pump
Market Cap
$.
Change
.
24h Vol
$.
Holders
.
$AGT Down 29.6% in a day, crashing from 0.0868 to 0.0461 and now at 0.0505—I've seen this kind of crash too many times. The opportunities that can really make money are often hidden in the second wave of panic.
First, my position: I bought a tiny 5% starter position around 0.052 this morning. I'm currently down about 3%, with a stop-loss at 0.0458 (below today's low). I'll hold as long as it stays above that level. This small loss barely registers against my overall position because I entered in stages instead of going all in.
Full trading plan:
Entry rationale: 24-hour trading volume is 324 m
  • 1
How should you read on-chain data? How can large transfers reveal market trends?

In the cryptocurrency market, many people watch candlestick charts and trading volume every day, but overlook a very important source of information: on-chain data.

Especially when Bitcoin sees a large transfer, many traders immediately speculate: Is a whale preparing to sell? Are institutions buying in large amounts?

But do large transfers really mean that prices are about to change?

First, distinguish between funds flowing into and out of exchanges. A large amount of BTC transferred to an exchange may mean h
post-image
BTC-0.67%
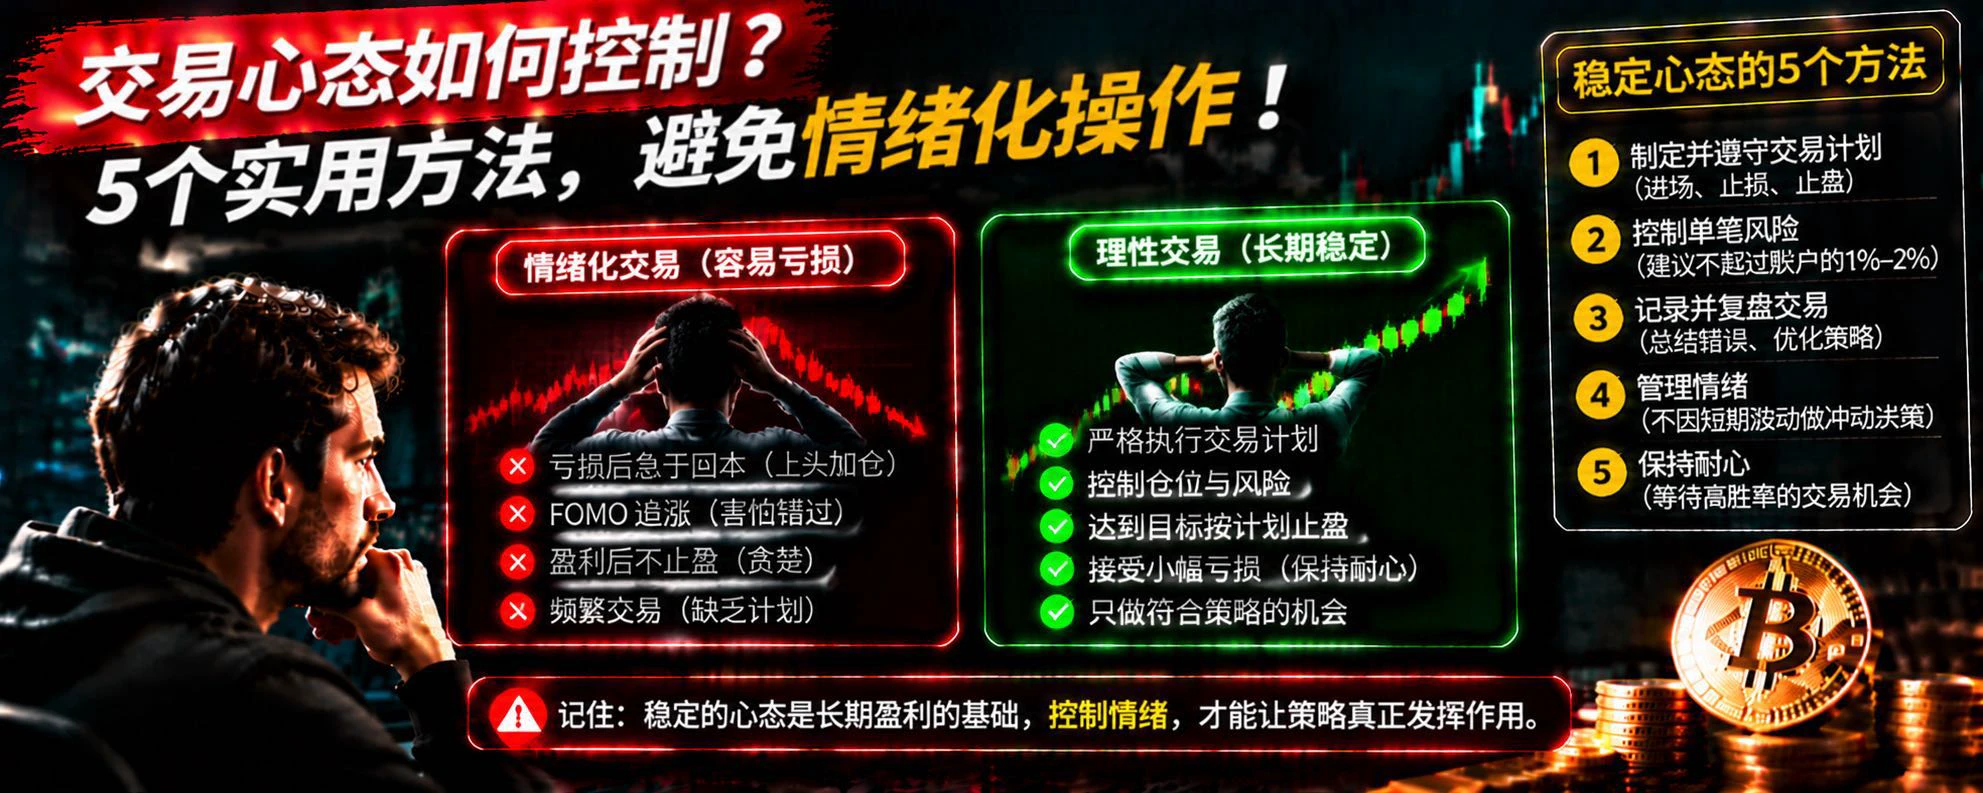
How Can You Control Your Trading Psychology? 5 Practical Methods to Avoid Emotional Trading!

In cryptocurrency trading, one phenomenon is very common: many people have studied technical analysis and made trading plans, but once they actually enter the market, they often make decisions that completely contradict their plans.

After a loss, they rush to win it back; when they see BTC rise rapidly, they fear missing out; after making a small profit, they worry it will disappear. In the end, they keep buying high and selling low.

Why is trading psychology so important?

First, revenge trading af
post-image
$AKE Fuck, what the hell, why are the top two on the leaderboard pulling so hard today? I only went short with 2,000u, thinking I’d make enough for dinner tonight, and I still lost 1,000u. $AKE
post-image
AKE+6.07%
  • 1
Weekend loading, but internet gossip shows no sign of taking a break 🍿

My biggest takeaway these past few days: no matter how capable you are, never take someone else's trust for granted. Your career deserves your attention, and so do the people around you.

Wishing all the VIPs a weekend with lovely weather, great meals, and someone willing to waste time with you 🥂

Life can switch channels. If you need anything, reach out—I'm always here to help~

‍#GateVIP
post-image
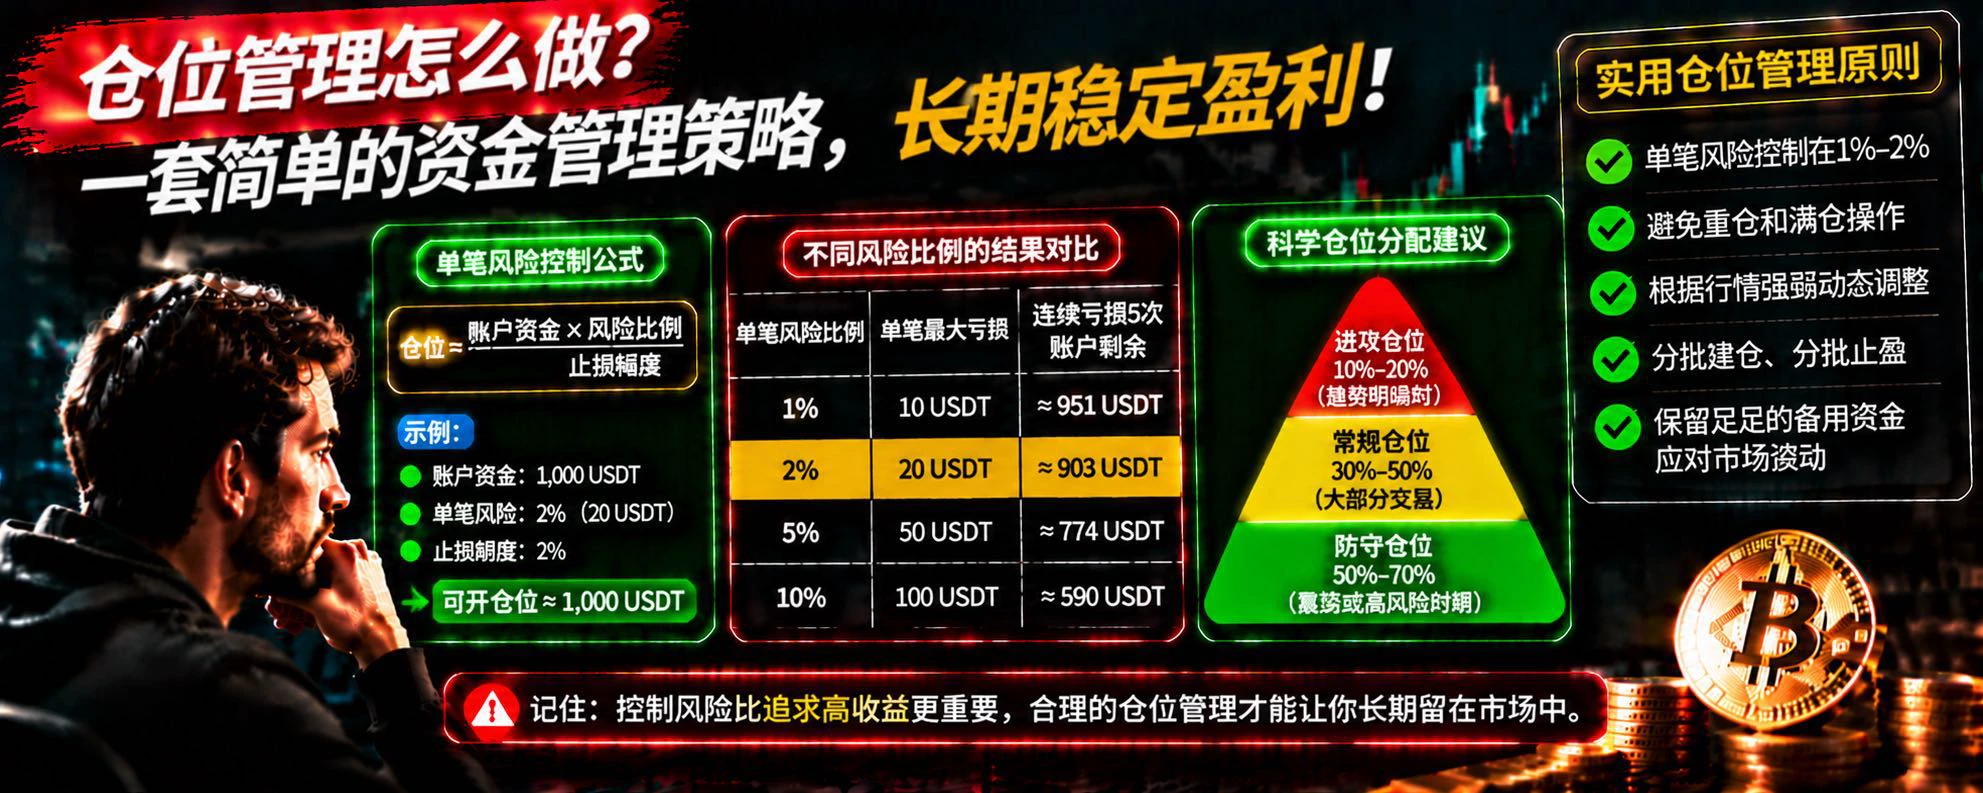
How Should You Manage Position Size? How Can Scientific Position Sizing Control Risk and Generate Steady Profits?

In cryptocurrency trading, many people analyze BTC’s price movements every day, but rarely seriously consider one question: Even if you’re right, how much capital should you put in?

In fact, many traders don’t lose because they get the direction wrong, but because they mismanage their position size.

Suppose your trading account has 1000 USDT. If you put all your funds into every trade, a sudden market move could cause serious losses. Even if the market later moves as you expecte
BTC-0.65%
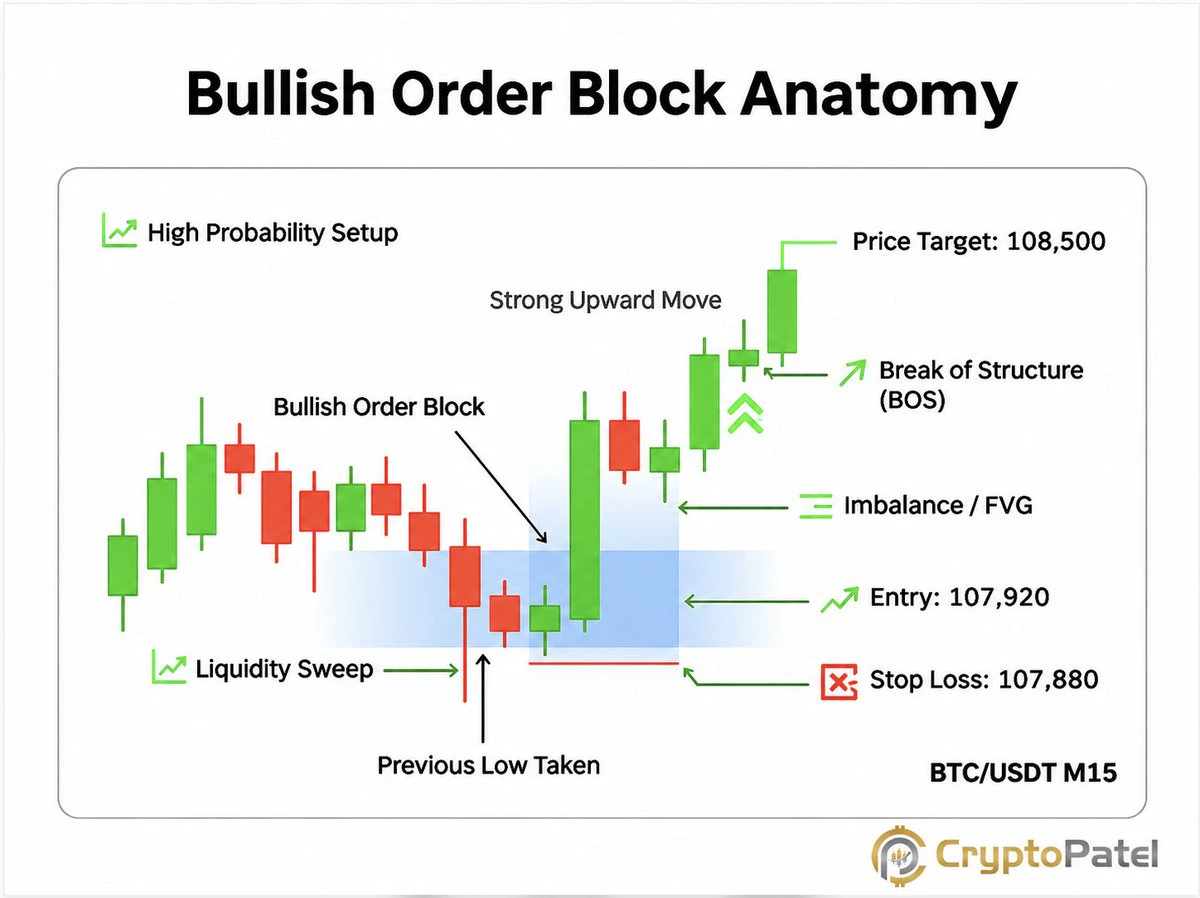
NOT EVERY RED CANDLE IS A BULLISH ORDER BLOCK.
In SMC, a bullish Order Block is commonly identified as the last bearish candle before a strong bullish displacement.
But there's a catch.
I want to see:
➡️ Strong displacement.
➡️ A meaningful break of structure.
➡️ Ideally, an FVG left behind.
Without these confirmations, it's just another candle on the chart.
#Bitcoin #SMC #OrderBlock
post-image
BTC-0.67%
crypto market update
live-cover
LIVE1,999
Nvidia loses its soul overnight? After Jensen Huang resigns, which stock is most at risk, and who might be laughing all the way?

Jensen Huang's resignation may worry not only Nvidia shareholders, but the entire AI supply chain.
Why? Because Nvidia is no longer just an ordinary chip company; it is the core engine of the AI supply chain.
Upstream are TSMC, HBM memory, and semiconductor equipment; downstream are AI servers, data centers, cloud computing, and various tech companies dependent on computing infrastructure. If Nvidia sneezes, the entire AI supply chain could catch a cold.
But market
NVDA-4.49%
  • 14
Why Do Larger Losses Make It Harder to Break Even? Understanding the True Cost of Account Drawdowns

In cryptocurrency trading, many people focus especially on how much a trade can earn, but rarely take the time to calculate how much their account needs to rise to return to its original level after a loss.

This is one of the risks most easily overlooked in trading.

Suppose your account originally has 1000 USDT. After a 10% loss, you have 900 USDT left. To get back to 1000 USDT, you need a gain of 11.1%, not 10%.

If the loss reaches 20%, your account is left with 800 USDT, and you need a 25%
post-image
$SOPH The bullish signal has been triggered. Enter a long position decisively at the current price of $0.001705. The token distribution at this price level looks favorable, and short-term momentum is building. The +27.82% gain is just the beginning. Go long $SOPH 👇
Risk warning: The above is solely a personal opinion and does not constitute investment advice. Contract trading involves extremely high risk. Please manage your position size carefully.
post-image
SOPH-3.83%
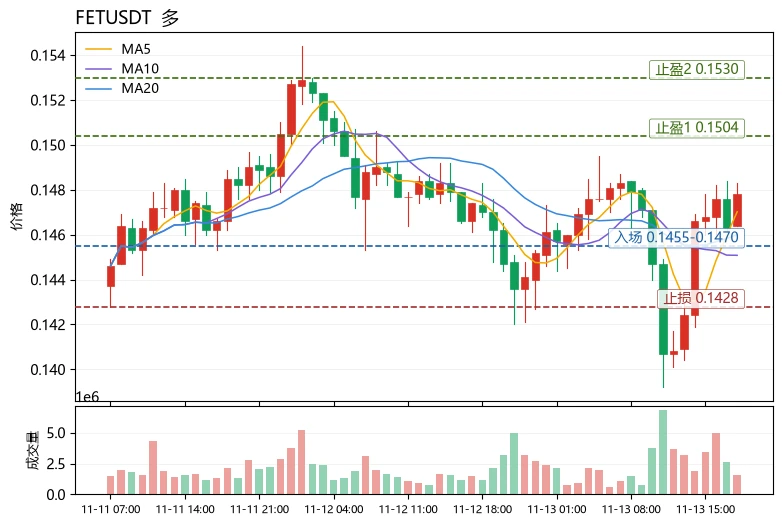
The extreme fear index is only 20, yet FET posted a positive gain and moved above MA5 and MA20. This divergence of “sentiment at rock bottom, structure holding firm” is the most unusual detail in today’s market. Compared with peers in the same sector: POL rose 1.70%, but its MACD histogram has turned bearish and its +0.0036% funding rate signals crowded longs; PEPE rose 2.96% on $82.8M in volume, with an RSI of just 47.6 and an 8.85% range, making it a high-volatility sentiment-driven trade. $FET had the smallest gain (+0.48%), but MA5=0.14702 is above MA20=0.14601, the MACD histogram remains
post-image
FET-1.52%
PEPE+0.97%
How Should You Adjust Your Trading Mindset After Consecutive Losses?

In cryptocurrency trading, consecutive losses are when many traders are most likely to lose confidence.

After the first loss, you may think you simply misread the market; after the second, you start doubting your strategy; when the losses reach three, five, or even more in a row, some people start rushing to win back what they lost.

And this is often where the real danger begins.

Why do consecutive losses easily trap traders in a vicious cycle?

First, losses affect your judgment. When you are eager to recover your losses
post-image
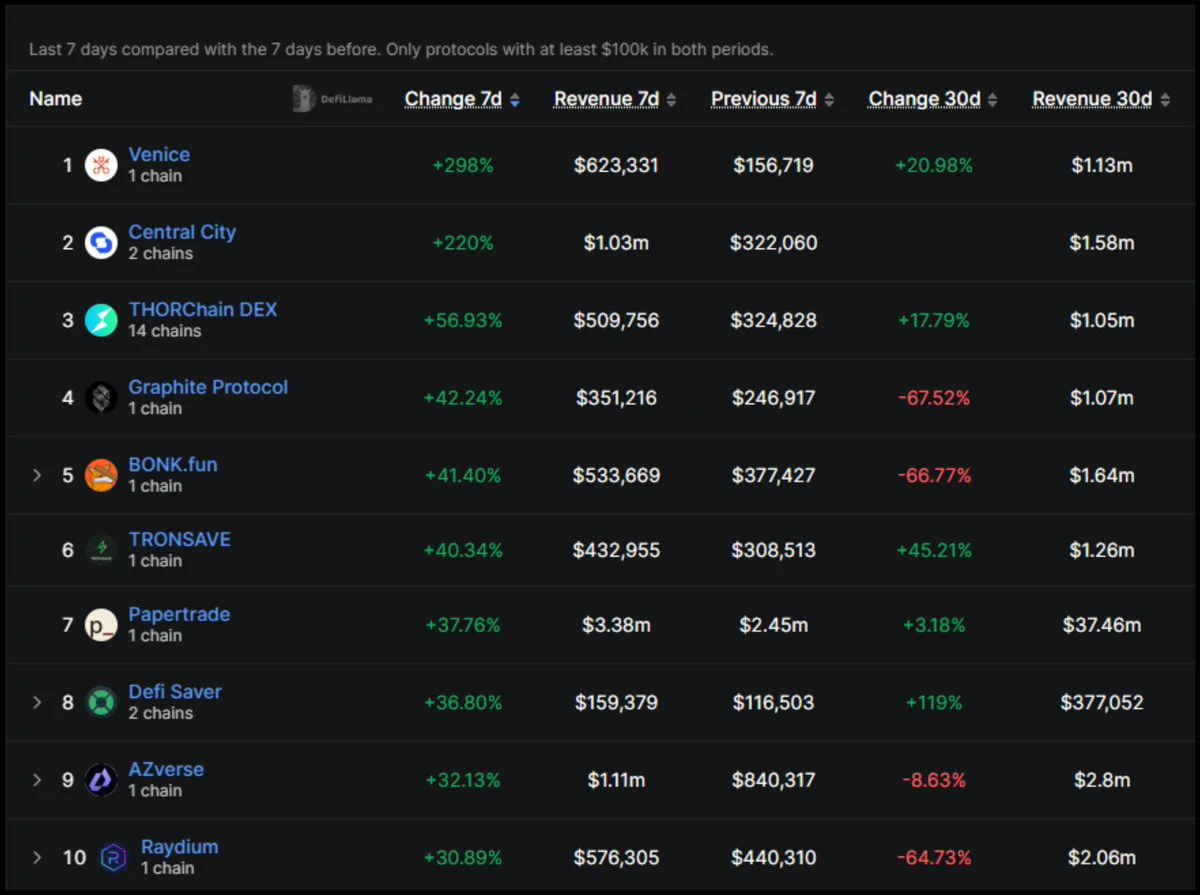
Revenue growth is picking up across several corners of DeFi, from DEXs and launchpads to AI agents and derivatives.
According to @DefiLlama, these are the top 10 revenue gainers over the past 7 days, compared with the previous week:
@AskVenice $VVV : +298% | $623K
Central City: +220% | $1.03M
@THORChain $RUNE : +56.93% | $510K
@GraphiteProto $GP: +42.24% | $351K
@bonkfun $BONK : +41.40% | $534K
TRONSAVE: +40.34% | $433K
@papertrade_xyz $PAPER: +37.76% | $3.38M
@DeFiSaver: +36.80% | $159K
AZverse: +32.13% | $1.11M
@Raydium $RAY : +30.89% | $576K
Source: @DefiLlama Revenue Gainers (Nov 13 snapshot)
post-image
VVV+0.37%
RUNE-0.11%
BONK-2.29%
RAY-0.66%
Boom! $SOPH surges 26%... 0.0018, the next target. SOPH breaks out decisively, clearing the 0.0015–0.0016 resistance zone and climbing to 0.001646! The price rebounded strongly from 0.001226, with buyers back in control. Despite weakness across the broader market, bullish momentum continues to accelerate. Next target: 0.00170. Extended target: 0.00180. Key support: 0.00150. As long as SOPH holds above the breakout zone, further gains remain possible. A drop below 0.00150 would weaken the bullish setup. The bulls are stepping up. Could 0.0018 be the next target? $SOPH
post-image
SOPH-3.83%
gm,
is a good day to have a good day and do something ridiculous.
🐸
post-image
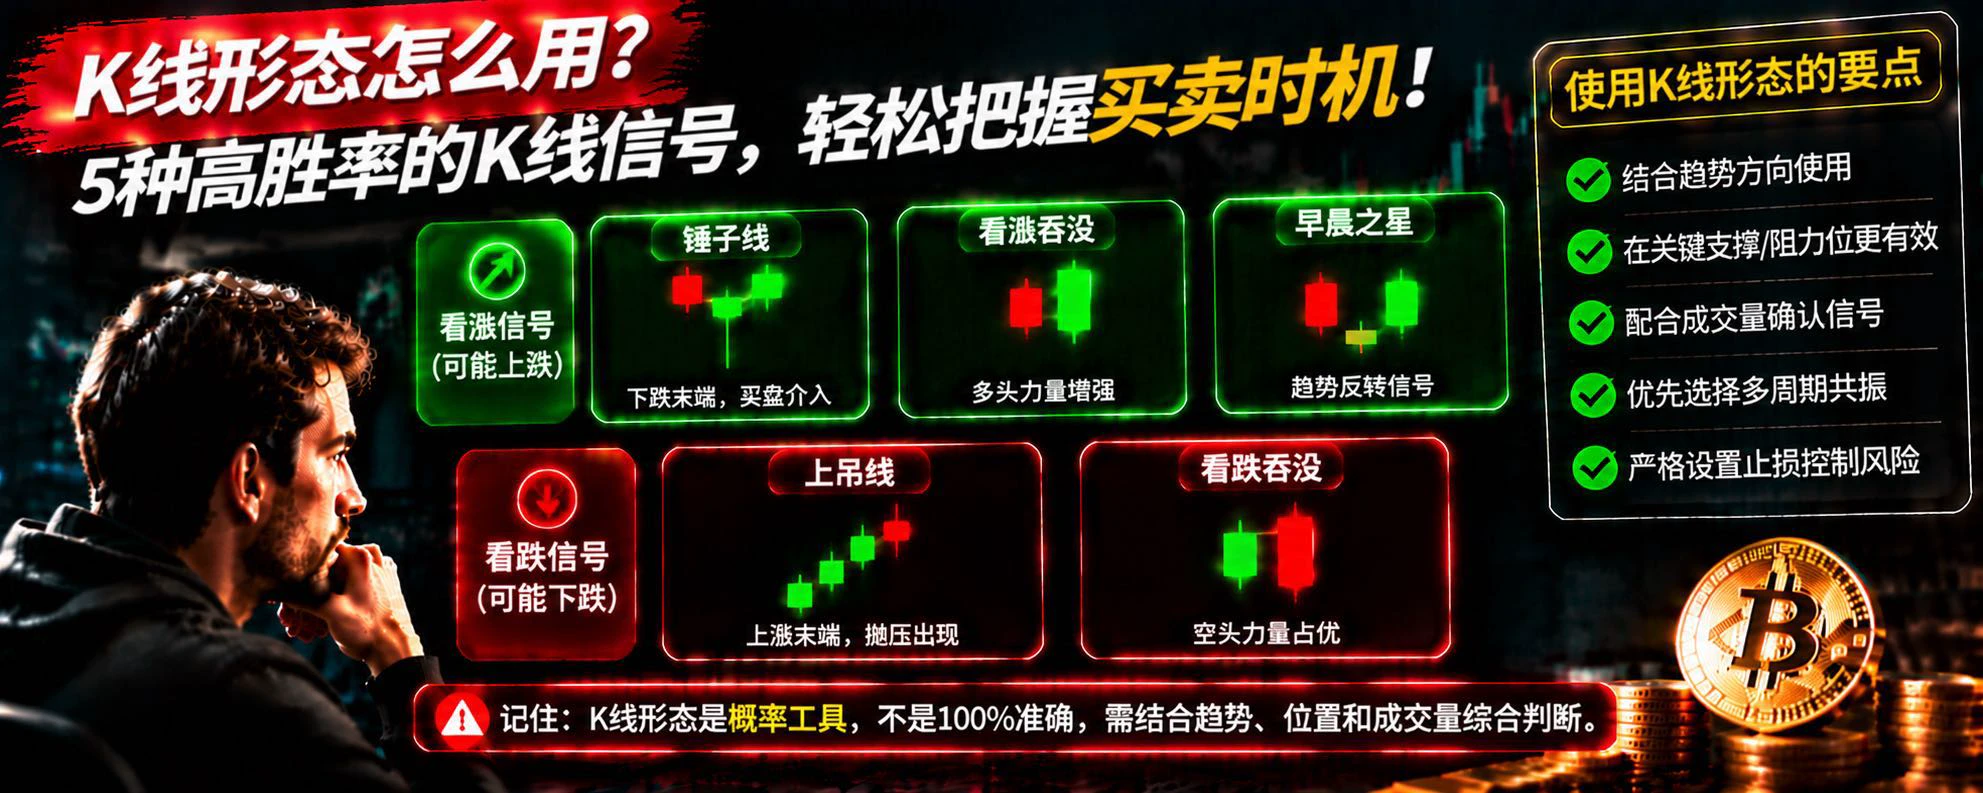
How to Use Candlestick Patterns? 5 Common Signals to Help Determine When to Buy or Sell BTC

In cryptocurrency trading, many people look at candlestick charts every day, but few truly understand the market sentiment behind them.

Why does BTC rise rapidly after some candlestick patterns appear? Why does the price continue to fall after other patterns appear?

Today, we’ll introduce 5 common candlestick patterns.

First, the hammer. It usually appears in a downtrend, with a long lower wick and a relatively small body, indicating that some buying support emerged after the price fell and potentia
post-image
BTC-0.67%
Load More

Join 40 M users in our growing community

⚡️ Join 40 M users in the crypto craze discussion

💬 Engage with your favorite top creators

👍 See what interests you

Trending Topics

JensenHuangResigns

516.7K Views8.2K Discussing

Jensen Huang has resigned as NVIDIA CEO and stepped down from the board. CFO Colette Kress will serve as interim CEO while NVIDIA considers internal and external successors. $NVDA fell more than 10% in premarket trading following the announcement. With one of AI’s most influential leaders stepping aside, markets are now reassessing NVIDIA’s leadership stability, AI strategy, and long-term valuation.

GateIPOAccessAnthropic

280.8K Views2.6K Discussing

Dr.HanOxfordUnionSpeech

144.6K Views473 Discussing

View More