
Square
Following
Hot
News
Notifications
Profile
Share your thoughts
placeholder
Article
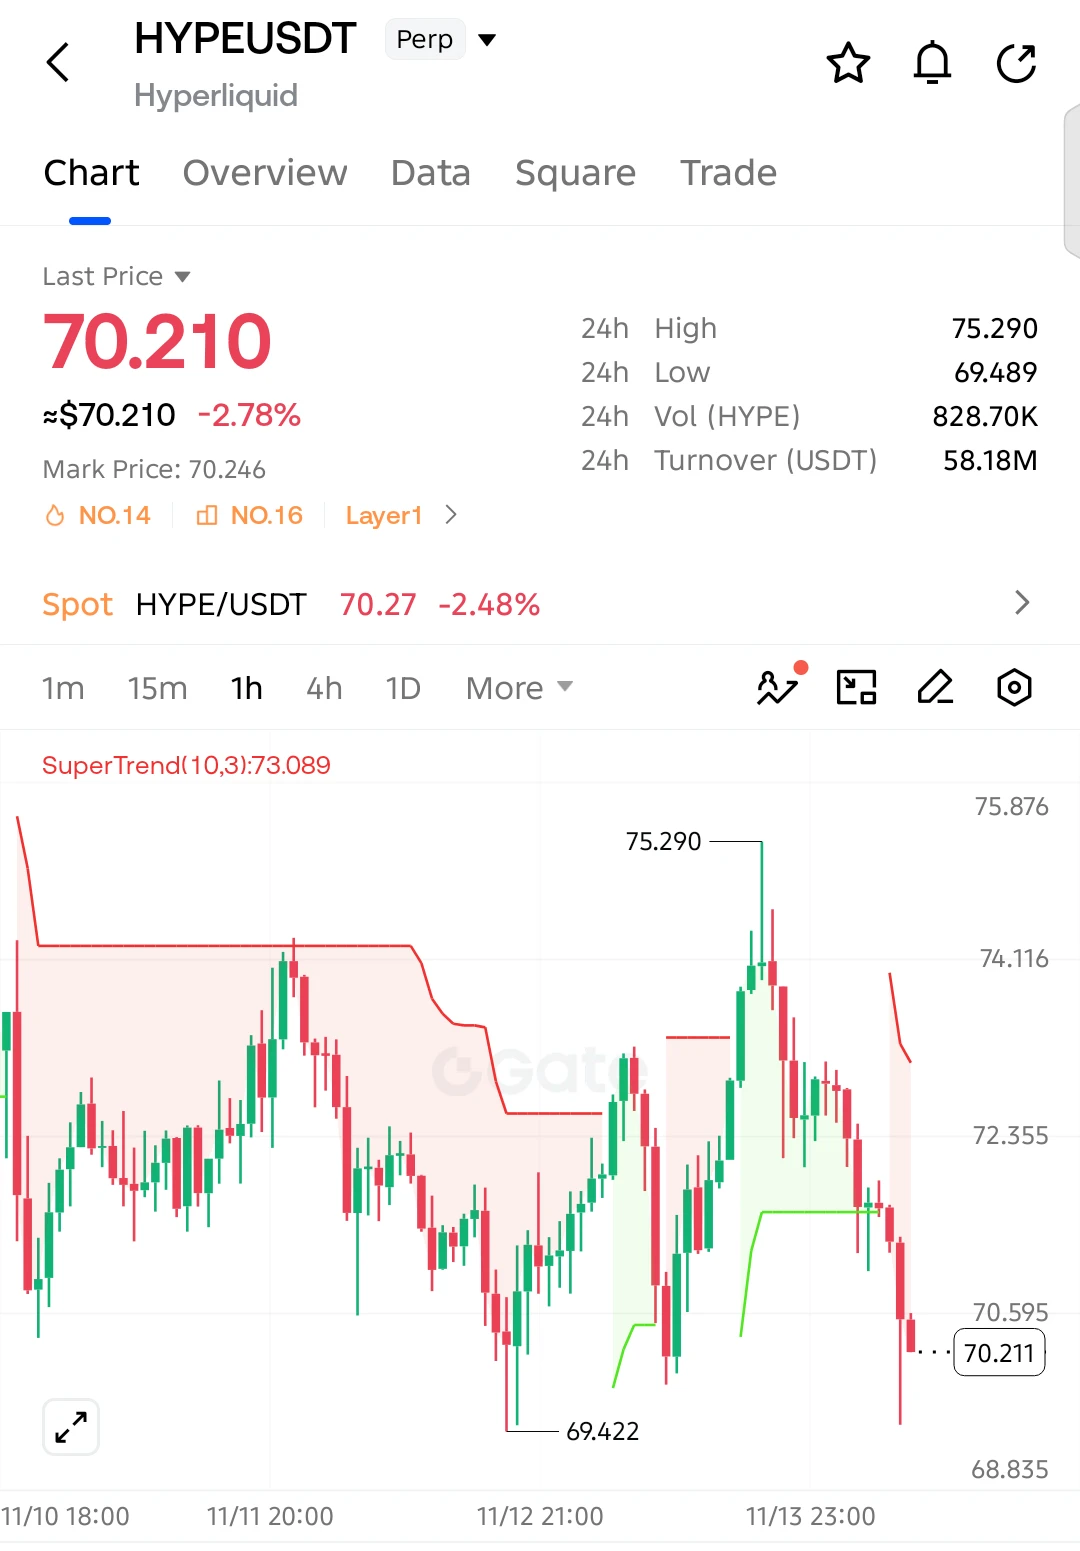
$HYPE BREAKDOWN ALERT — 69.42 NEXT, BEARS TAKING CONTROL!

SHORT SETUP

Entry: 70.210
SL: 71.65

TP1: 69.489
TP2: 69.422
TP3: 68.835

$HYPE is down 2.78%, with sellers pushing price below recent support after rejection from 75.290. Lower highs and renewed selling pressure suggest further downside. If 69.42 breaks decisively, the decline could accelerate toward 68.83.

A sustained recovery above 71.65 would weaken this bearish setup.
post-image
HYPE+0.24%
  • 3
  • 1
$btc pivot daily
post-image
BTC-0.67%
Trenches
FOOD
F
bade
b
FOOD
FTu5...pump
Market Cap
$.
Change
.
24h Vol
$.
Holders
.
mihao
m
bade
b
mihao
4Cxj...pump
Market Cap
$.
Change
.
24h Vol
$.
Holders
.
IDOL
I
bade
b
IDOL
0x3b...ab07
Market Cap
$.
Change
.
24h Vol
$.
Holders
.
AGT
A
bade
b
AGT
0x5d...e274
Market Cap
$.
Change
.
24h Vol
$.
Holders
.
NIO
N
bade
b
NIO
7SL2...pump
Market Cap
$.
Change
.
24h Vol
$.
Holders
.
Earnings season is winding down, and I'm reasonably satisfied with my performance this year.
Here's an interesting change: quite a few friends have gotten into the habit of coming to Square to watch my live earnings predictions during earnings season.
Going forward, this will become a regular feature—I'll always be here during earnings season.
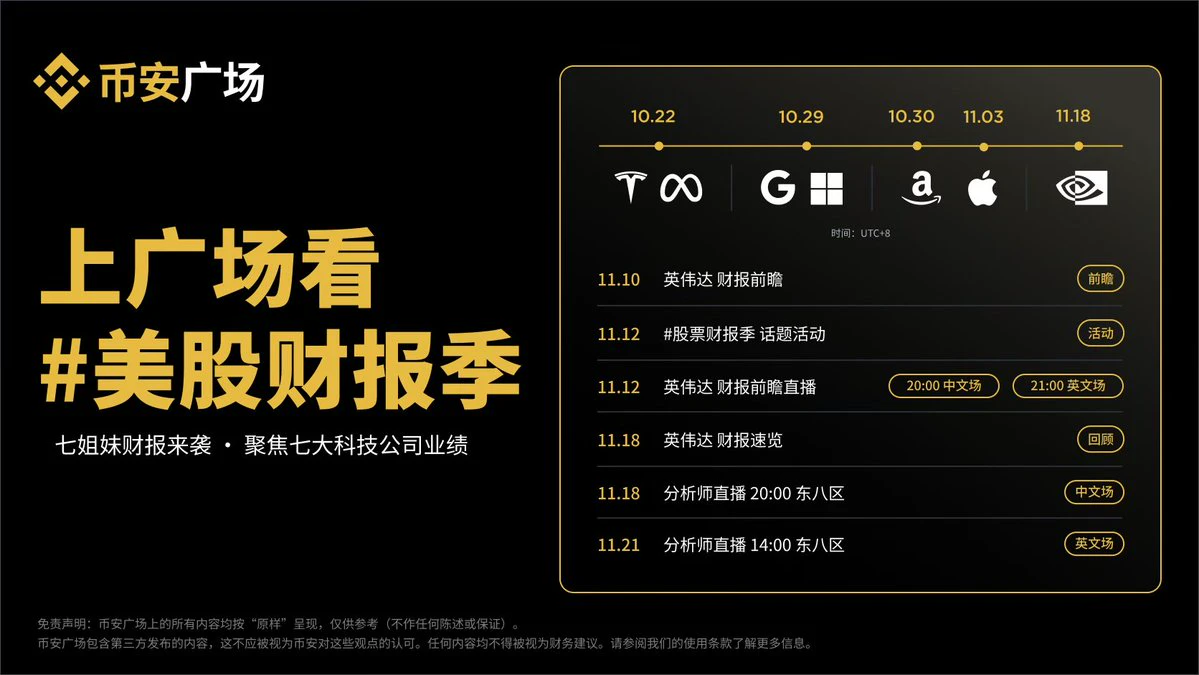
But next week's report is the toughest one of the year: NVDA reports earnings early on 11/18 Beijing time, Anthropic prices its IPO the same day, and APEC will also be held in Shenzhen on 11/18–19. Three major events colliding in one week is unprecedente
post-image
NVDA-1.92%
TSLA-1.86%
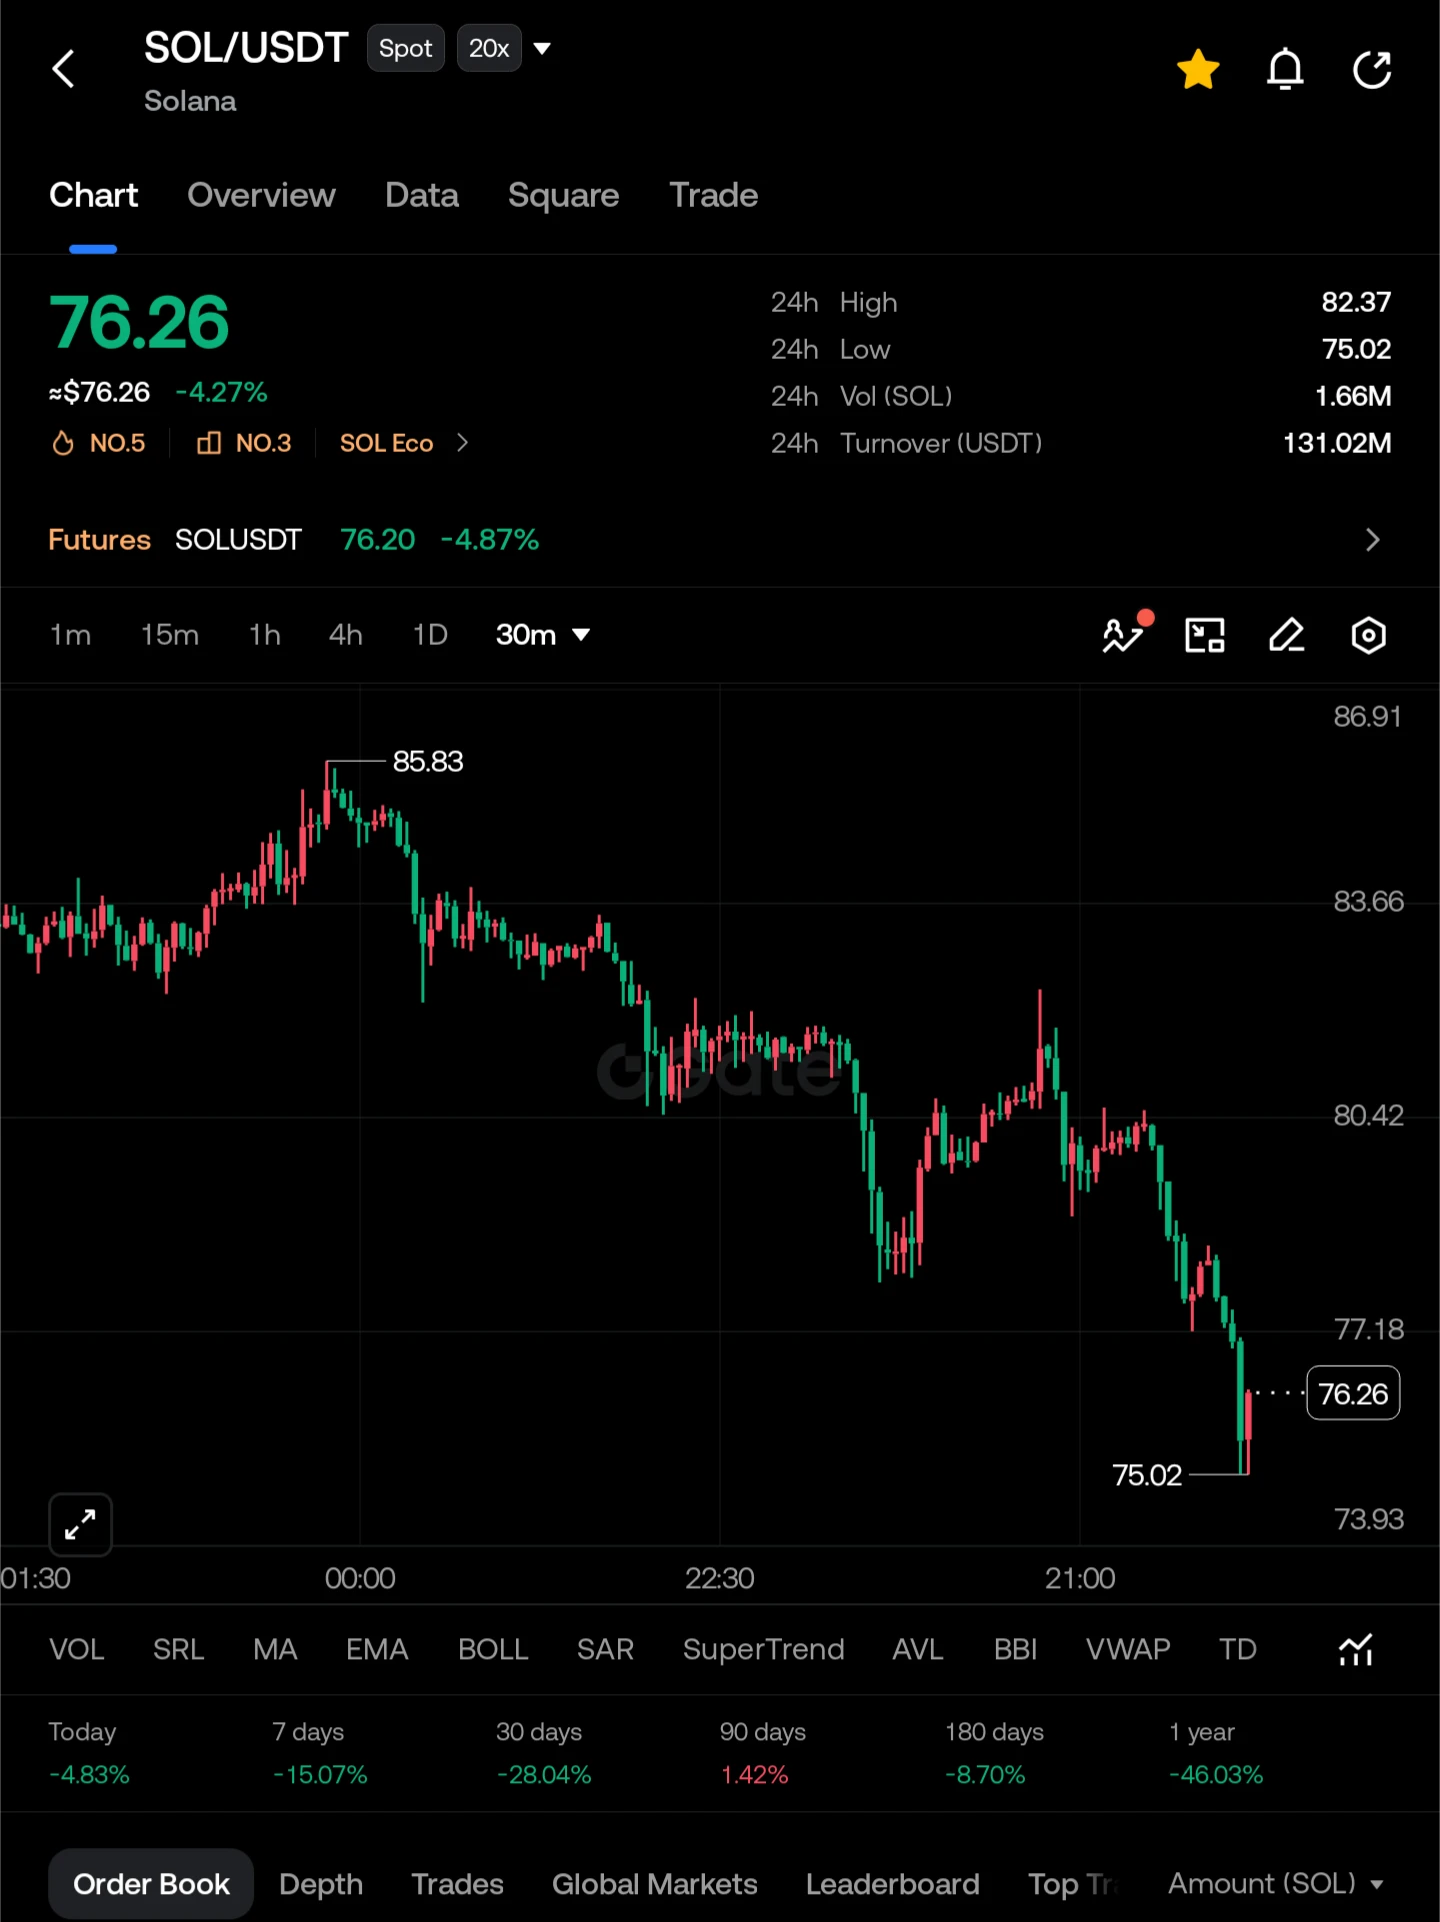
🚨 $SOL – BEARS ARE STILL IN CONTROL! ⚠️

I'm watching Solana closely because the 30-minute chart is showing serious selling pressure. SOL has dropped from the $85.83 region and recently swept down to $75.02 before attempting a small bounce.

What catches my attention is the weak recovery after such a sharp decline. Sellers still have the advantage unless bulls reclaim key resistance levels.

I'm looking for a possible SHORT opportunity on a relief bounce rather than chasing the current price.

🔴 Entry Level: $76.80 – $77.50

🎯 TP1: $75.20
🎯 TP2: $74.30
🎯 TP3: $73.50

🛑 STOP LOSS: $78.30
post-image
SOL-0.77%
It keeps sliding lower every day. When will it end?..................................................
post-image
GM Champ!
Happy Weekend Everyone...
post-image
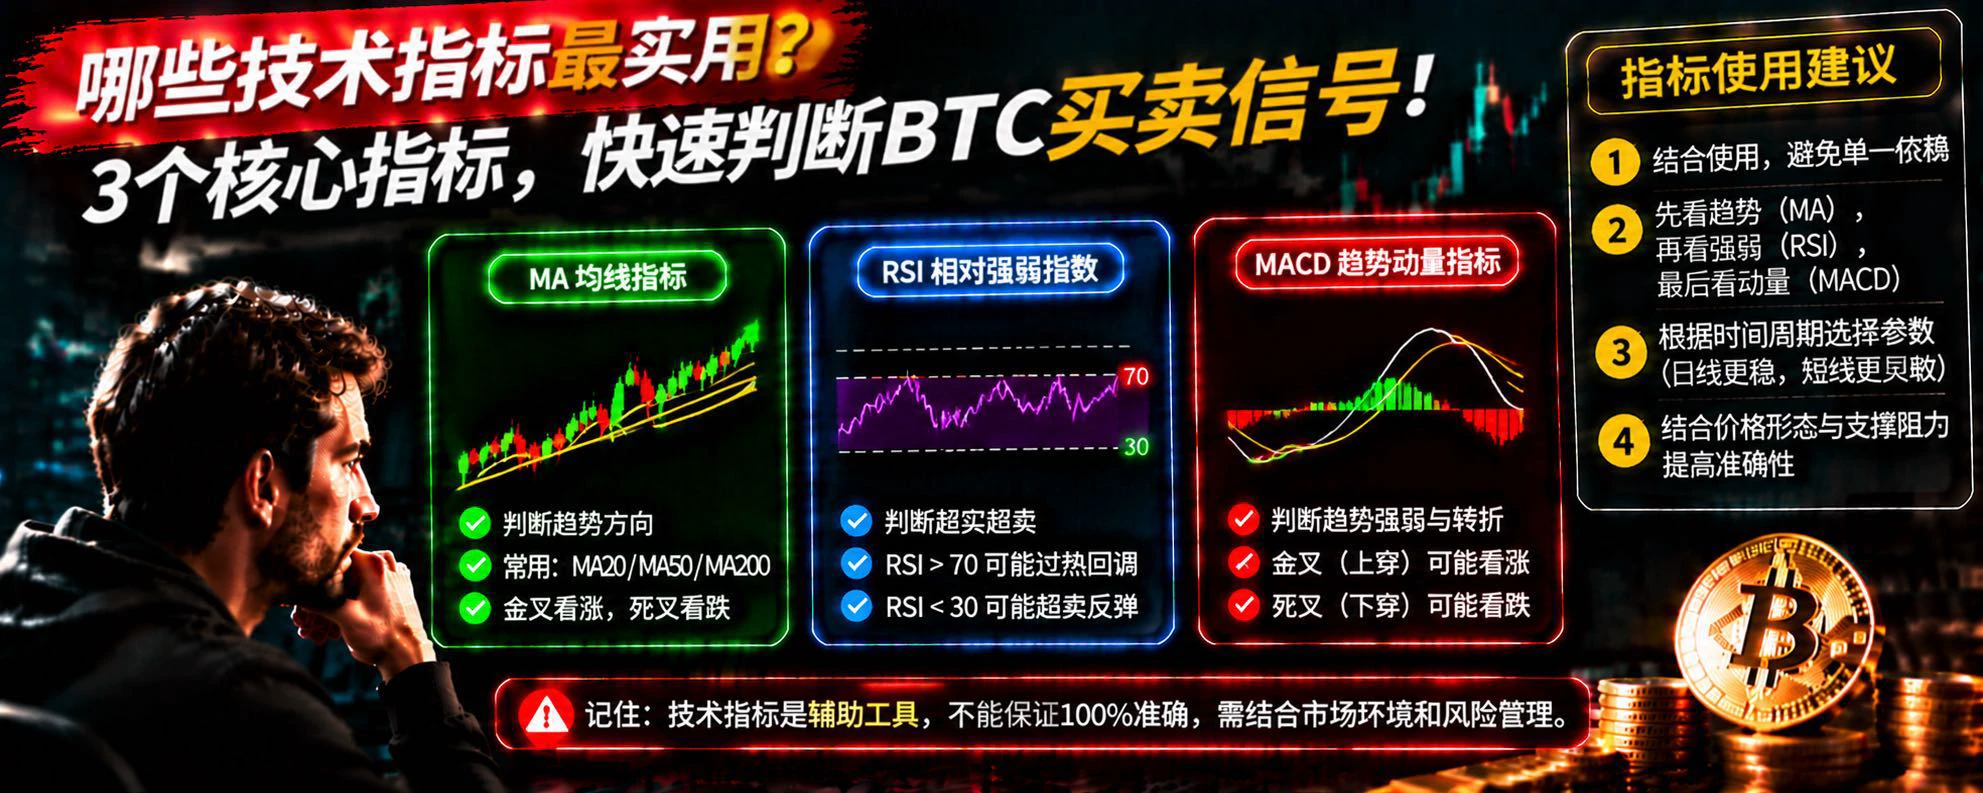
Which technical indicators are most useful? 3 core indicators to quickly identify BTC buy and sell signals

In cryptocurrency trading, many beginners like to add all kinds of technical indicators to their candlestick charts, hardly wanting to miss any of RSI, MACD, moving averages, or Bollinger Bands. But do more indicators really make it easier to earn money?

In fact, the most important thing in technical analysis is not how many indicators you use, but understanding what problem each indicator can solve.

The first is the moving average (MA). It mainly helps identify market trends. For exam
post-image
BTC-0.67%
How should you read on-chain data? How can large transfers help you gauge market trends?

In the cryptocurrency market, many people watch candlestick charts and trading volume every day, but overlook a very important source of information: on-chain data.

Especially when large Bitcoin transfers occur, many traders immediately speculate: Is a whale preparing to sell? Is an institution buying in large quantities?

But do large transfers really mean that prices are about to change?

First, distinguish between funds flowing into and out of exchanges. A large amount of BTC moving to an exchange may
post-image
BTC-0.67%
261114
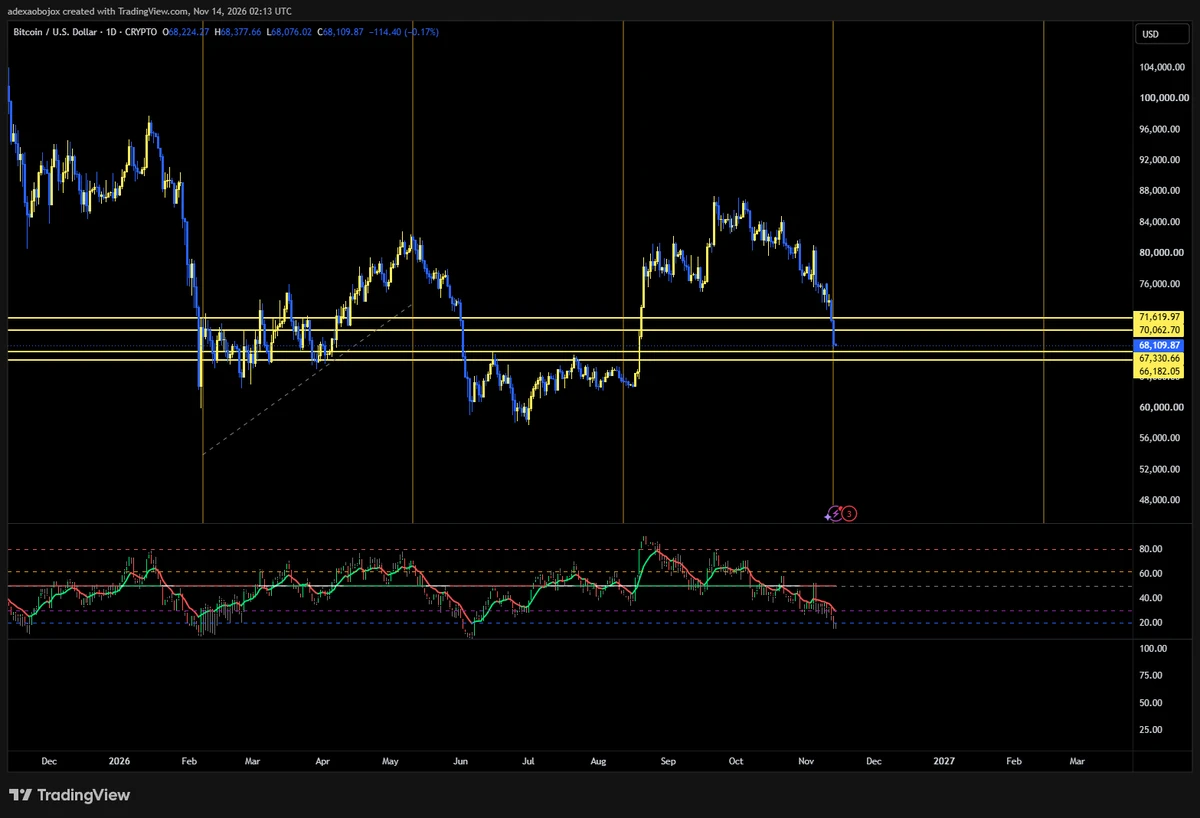
Bitcoin is trading on the weekly timeframe. Those who have exited their long-term positions should wait and see; until the weekly chart enters oversold territory, it will keep making new lows. Long and short-term trades should include stop-losses!
BTC resistance levels
69544/70773/71730
BTC support levels
67084/65855/64898
ETH resistance levels
1964/1998/2025
ETH support levels
1894/1860/1833
Place the stop-loss slightly beyond the third price level.
Keep intraday positions below 5% of your position.
Livestreams are held in the afternoon and evening. Follow my profile to find me. #10月PP
post-image
BTC-0.67%
ETH-1.26%
ETH, October 30: Precise prediction! Primarily shorting at highs! The chart proves it! Today, November 14, half a month later, the large-cycle correction is complete! For the subsequent market, focus mainly on buying dips! Pay close attention to the 1730–1850 range! The major bottom is at 1500! Build spot positions in batches for the medium to long term! If 1500 breaks, it will enter a deep bear cycle! $ETH ‌
ETH-1.26%
  • 1
  • 1
Everyone in the group is shouting bullish, but I’m keeping my eye on cash flow in the earnings reports. NVIDIA alone accounts for about 6% of the S&P 500, so index funds and target-date retirement funds can’t avoid it. The S&P was up 2.9% this week; excluding NVIDIA, it might have been closer to 3.8%. One stock held the index back by nearly a percentage point. In other words, a lot of people think they’ve bought a “diversified” broad-market fund, when in reality, the top 10 holdings already determine a large part of the index’s volatility. NVIDIA is the most obvious variable.

Here’s why I foc
post-image
NVDA-1.92%
SPYX+0.01%
SPX+0.33%
  • 2
  • 1
market prices updates
live-cover
LIVE1,903
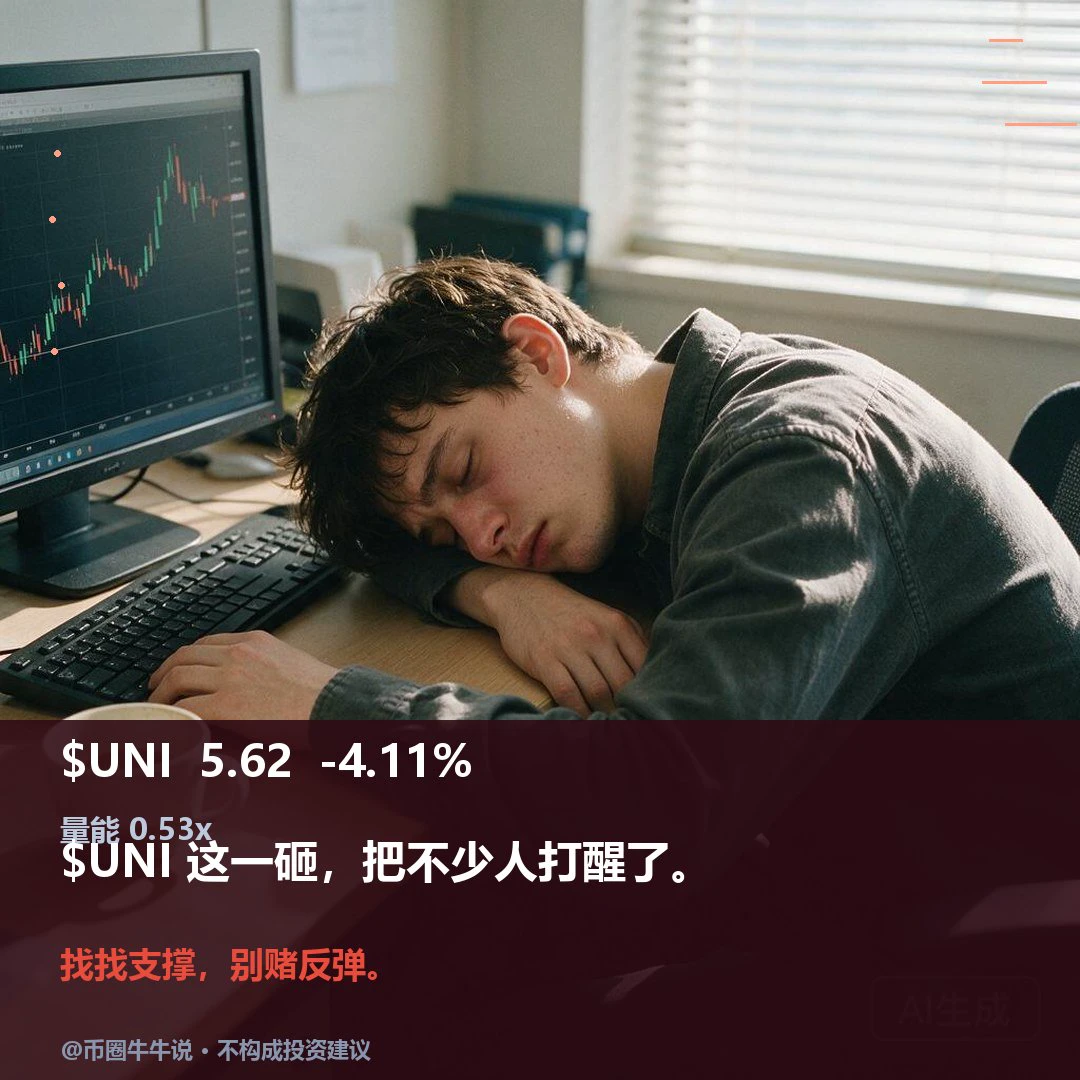
$UNI is currently at 5.624, down 4.11% over 24H (5.514–6.026). The 1H and 4H outlooks are weak, with RSI at 23.94 and 11.96, respectively. The direction may become clearer if price holds above the 6.026 resistance or breaks below the 5.514 support. Going forward, watch whether price can hold above resistance; volume is only 0.53x, so a single break needs confirmation from participation. Markets are volatile; for observation only.
post-image
UNI+3.05%
Listen up, guys! $BTC and $ETH are about to plunge again‼️ Bears are firmly in control! BTC has fallen to around $67,400, while ETH is struggling around $1,905. Both charts remain bearish, with selling pressure dominating every rebound attempt. Guys, are you still holding short positions? Stay alert, protect your profits, and don't chase entries at higher prices. The market could still fall further!
post-image
BTC-0.67%
ETH-1.26%
How should you manage position sizes? How can scientific position sizing control risk and generate steady profits?

In cryptocurrency trading, many people study BTC price movements every day, but rarely give serious thought to one question: Even if your prediction is correct, how much capital should you invest?

In fact, many traders don't lose because they get the direction wrong, but because they mismanage their position sizes.

Suppose your trading account has 1000 USDT. If you invest all your funds in every trade, a sudden market move could cause serious losses. Even if the market later mo
BTC-0.65%
New streamer bts market
live-cover
LIVE1,379
$ONDO Short: On the 4-hour chart, 0.332 is the level sellers must defend 👀Price is at 0.331, below the EMA50. I'm watching whether sellers can hold 0.332 or let price reclaim it. A close above 0.340 would invalidate this short setup. Short 0.3304–0.3319 Take profit 0.3259 / 0.3225 / 0.3172 Stop loss 0.3399 On the chart: - The 4-hour price is 0.331, below the EMA50 at 0.362, so the structure favors sellers - The daily price is below the EMA200 at 0.374, and the daily trend also supports this view - The stop-loss distance is 2.6%, and the third take-profit target is 4.2% away; if the full move
post-image
ONDO-0.29%
24-hour high 1988, low 1876—a $112 drop in one day, and 1900 lost twice. $ETH The futures market is bearish. It just hit 1876 shortly after 10 a.m., then rebounded to a high of only 1915.76 before turning back down. Now around 1890, it’s back below 1900—the bulls no longer have the strength to defend this level. 1915.76 above is today’s rebound high; if it gets back above that, I’m wrong, so I’ll set my stop-loss at 1915.76. Below, I’m watching the 24-hour low of 1876 first; if that breaks, I’ll take profit at 1872.2. The whole market is down today, with BTC and SOL both falling, while ETH’s t
ETH-1.23%
#白宫提交CFTC与SEC两党委员提名
SEC vs. CFTC: Who Will Control America’s Next Generation of Crypto Markets?
As of November 14, 2026, the tug-of-war over who regulates America’s digital-asset economy has entered a decisive new chapter following the White House’s bipartisan nominations to the Securities and Exchange Commission (SEC) and the Commodity Futures Trading Commission (CFTC). With Nathan Anonick and Matthew Rowland nominated to the CFTC alongside Kristin N. Johnson and Steven Levine nominated to the SEC, Washington is attempting to build balanced, fully staffed commissions at both agencies. Yet fo
BTC-0.67%
ETH-1.26%
Load More

Join 40 M users in our growing community

⚡️ Join 40 M users in the crypto craze discussion

💬 Engage with your favorite top creators

👍 See what interests you

Trending Topics

GateIPOAccessAnthropic

299.3K Views2.8K Discussing

Gate IPO Access Phase 3 features Anthropic (ANT), with USDT subscription interest starting from 100 USDT. Successful allocations will be delivered as real shares to Gate Stock Accounts. Indicative price: $70–$78/share Subscription: Nov 12–17 (UTC+8) Allocation is not guaranteed. Please manage risk accordingly.

Dr.HanOxfordUnionSpeech

146.6K Views546 Discussing

USOctoberPPIBelowExpectations

458.8K Views1.4K Discussing

View More