




Share your thoughts
placeholder
Article
First signs of weakness on this massive PONS move. I think it would be good if it consolidated/pulled back here, that money flows into other tokens on RH chain and then we repeat with another leg up later.
Same as the BTC stalls > alts run loop we usually do, but RH specific.
post-image
PONS+25.75%
BTC+0.25%
Pretty happy—I got to eat #晒出我的持仓收益 after sleeping.
post-image
Gold’s 4h chart is screaming short at 4438—but the daily range says don’t trust it yet.

$XAU /USDT - SHORT

Trade Plan:
Entry: 4436.95 – 4439.87
SL: 4452.40
TP1: 4427.92
TP2: 4420.92
TP3: 4410.43

Why this setup?
- RSI 15m at 52.4 = no momentum fuel, just a lazy drift into resistance.
- ATR 1h at 5.83 means a 10 move is nothing—our TP1 at 4427 is a 0.24% scalp, not a trend.
- Daily range kills the conviction: 55% confidence is a coin flip, so we’re selling the 4h rejection, not the macro.
- Why now? Entry zone 4436.95–4439.87 is a tight 0.07% box—wait for a 15m close below 4438 to tr
XAU+0.09%
This move in $SKHYNIX has been steadier than I expected. When the overnight session pulled back to around 1165.42, it did not break through the key level I was watching, so I chose to open a long position, with a stop-loss that was not set too tight. In futures, the biggest fear is that the direction has not changed but you get stopped out first, so I was fairly patient with that trade.

After it rallied into the 1277.62 range, I first closed 70% of the position and locked in the floating profit; for the remaining 30%, I moved the protection level higher—exit if it breaks down, and keep watch
post-image
SKHYNIX+0.12%
SNDK+1.80%
DOGE+5.99%
I originally just wanted to mooch a breakfast, but the market ended up making dumplings out of me for half a year. I opened the charts this morning, and before my eyes were even fully open, I saw the price bubbling up on its own. A few days ago, while watching the market in the early hours, $TAC had been moving sideways at the bottom. Everyone was waiting and watching. I stared at the order book for a while and saw funds entering slowly but steadily, with small orders constantly providing support at the bottom. In situations like this, I don't hesitate—I reached in and bought some around 0.002
post-image
TAC-6.25%
ZEC+0.15%
LAB+0.31%
Crypto Signals and Trding Insights
live-cover
LIVE1,366
JUST IN: No fact pattern available from the provided link. Please paste the key alert or summarize the alert you want transformed.
post-image
Is this even a rebound, or CPR for my empty account? But now is definitely not the time to act impulsively. When I checked the chart after lunch, $XAUT surged to the highs on no volume, with clearly insufficient buying support. I tried shorting around 4486.7: volume didn’t follow, and with no one taking the other side, it naturally had to come back down.
The current price of 4427.9 has already given the answer—+121.82% secured. It dragged its feet earlier, but the result is truly satisfying.
Don’t mess with your position either: take 80% off the table first, move the stop-loss on the remainin
post-image
XAUT+0.01%
LAB+0.31%
XRP+1.17%
$907,000 A certain trader made two FOMO trades i, resulting in a total loss of $907,000
live-cover
LIVE1,256
FORCED LIQUIDATION
$NIKE
post-image
NKE-0.24%
  • 4
#美国8月非农超预期 #美国8月非农超预期
August NFP Beats Expectations — Is Another Market Drop Coming?
The latest U.S. Nonfarm Payrolls data has given the market another reason to reassess its expectations for the Federal Reserve.
August nonfarm payrolls increased by 162,000, coming in significantly above market expectations. The stronger-than-expected employment data immediately changed market sentiment.
BTC briefly slipped below $80,000, gold retreated, and traders started repricing expectations around the Fed's next moves.
Now the key question is:
Has the market already priced in the negative impact of st
NVDA+0.87%
$BTC Signal】Long + 1H squeeze buildup
$BTC Hourly volume shrank to 267 coins, the 1H Bollinger Bands have squeezed to an extreme, and the MACD histogram has turned positive. The 4H MACD bearish histogram has continued to contract, with dense orders around 79630 and clear signs of buying support.
🎯Direction: Long
⚡Entry/orders: 79630.12 - 79853.00
🛑Stop loss: 79054.47
🚀Target 1: 81050.79
🚀Target 2: 81649.69
🛡️Trade management:
- Execution strategy: After reaching Target 1, reduce the position by 50% and move the stop loss up to breakeven. If the price falls back to the entry level, exit a
post-image
BTC+0.25%
Nobody’s watching ADA while it quietly sets up a trap at 0.2191—are you the exit liquidity?

ADA/USDT - SHORT

Trade Plan:
Entry: 0.2185 – 0.2197
SL: 0.2245
TP1: 0.2150
TP2: 0.2123
TP3: 0.2083

Why this setup?
Why now?
- 4h bias is SHORT with 55% conviction, but the 1D trend is *range*, meaning this isn’t a breakout—it’s a rejection play.
- RSI 15m at 49.56 = zero momentum, so price is drifting into the kill zone (0.2185–0.2197) without buyers.
- ATR 1h (0.0023) is thin—low volatility means stop hunts are cheap. Target TP1 at 0.2150 before the real move.
- Invalid only if we lose 0.
ADA+3.63%
CRYPTO THINGS YOU MAY HAVE MISSED — LAST 24 HOURS | 5 SEPTEMBER 2026
The market looked weak—but institutions quietly poured more than $1.2B into bitcoin:native and $ETH funds last week.
The price and capital flows are telling different stories.
🧵👇
1/2 — ETF DEMAND SURVIVED THE MACRO SHOCK
US spot ETFs recorded approximately:
🟢 bitcoin:native: $986.7M weekly net inflow
🟢 $ETH: $215.3M weekly net inflow
🟢 Combined: $1.20B
Friday alone added $174.6M to Bitcoin funds and $25.9M to Ethereum funds—even after the stronger payroll report increased Fed-hike risk.
Investor takeaway: institutions co
post-image
BTC-2.35%
ETH-2.49%
HBAR+2.53%
XLM+2.68%
XDC+1.30%
Everyone’s staring at ADA’s range—but the 4H just whispered a secret that most will ignore.

$ADA /USDT - SHORT

Trade Plan:
Entry: 0.2187 – 0.2199
SL: 0.2249
TP1: 0.2151
TP2: 0.2122
TP3: 0.2080

Why this setup?
- ADA/USDT is coiling at 0.2193 with a 55% short bias, but the 1D is still "range"—not a breakout.
- RSI 15m at 51.19 = zero momentum; ATR 1H shows a tight 0.0023 squeeze—volatility is loading.
- Why now? The 4H structure says the path of least resistance is down to TP1 0.2151, yet the invalidation at 0.2110 is a trap door for late shorts.
- If price rejects 0.2199 (entry high
ADA+3.65%
HYPE breaks above $88 to hit a new all-time high! Is this takeoff, or is the market starting to get overexcited?
HYPE really has “something going on” this time—the price broke above $88, directly setting a new all-time high. For holders, this is more than just a number; it is the result of market sentiment, capital attention, and ecosystem expectations coming together.
What deserves the most attention is that HYPE’s market narrative has clearly heated up after breaking its previous high. Usually, when an asset breaks through its all-time high, it means less overhead selling pressure from trapp
HYPE+1.20%
  • 46
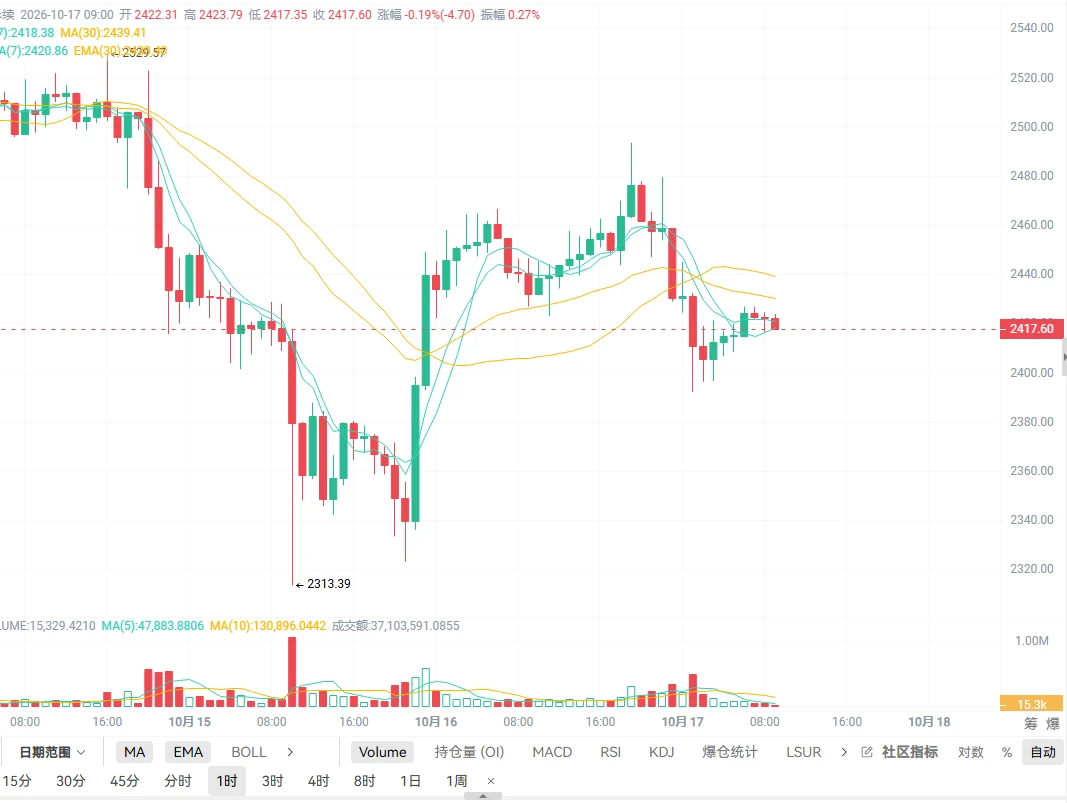
I don’t chase after a volume-backed surge; that’s a rule I set for myself. When $ETH surged to 2485.57, volume did indeed pick up, but such a sudden expansion often means short-term divergence is intensifying, and chasing in makes it easy to get stuck at the top.

I entered my long position earlier, when the price repeatedly tested the key level around 2394.32. The key level held each time, and the rebounds after each pullback kept getting faster. I got the feeling that someone was accumulating at lower levels, so I followed and went long.

After the move played out, I still took profit on
post-image
ETH+1.14%
ZEC+0.15%
ADA+3.65%
Profits are worth showing off, but losses are even more worth reviewing! The Gate event contract challenge is here
I used to love posting profit screenshots from my trades—sharing them on social media when I made money, and wishing I could just turn off my phone when I lost.
But what I find interesting about Gate’s event contract screenshot-sharing challenge this time is that it not only asks everyone to share the results, but also encourages them to share their trade direction, basis for their judgment, and review process.
That is actually closer to real trading.
For example, if I predict tha
BTC+0.25%
  • 14
BREAKING: Algorand has signed over 1,000,000 post-quantum transactions on mainnet, more than any leading Layer 1.
post-image
ALGO+4.22%
Why is everyone long MU/USDT while the 4h timeframe is screaming SHORT with 84% confidence?

MU/USDT - SHORT

Trade Plan:
Entry: 1015.27 – 1016.89
SL: 1026.20
TP1: 1008.49
TP2: 1003.43
TP3: 995.84

Why this setup?
- The 1D trend is bullish, but the 4h setup just armed a SHORT at 1016.08 — that’s a classic higher-timeframe pullback trap.
- RSI on 15m is at 47.64, showing zero momentum for a bounce — sellers are in control of the micro-move.
- ATR 1h at 3.24 means the expected move is tight, but TP1 at 1008.49 is only 0.75% away — low risk, high probability.
- Why now? The entry zone (1
MU+0.11%
Load More

Join 40 M users in our growing community

⚡️ Join 40 M users in the crypto craze discussion

💬 Engage with your favorite top creators

👍 See what interests you

View More