Share your thoughts
placeholder
Article
Hold onto the whale
There will be surprises
Surprise
The whales will come
post-image
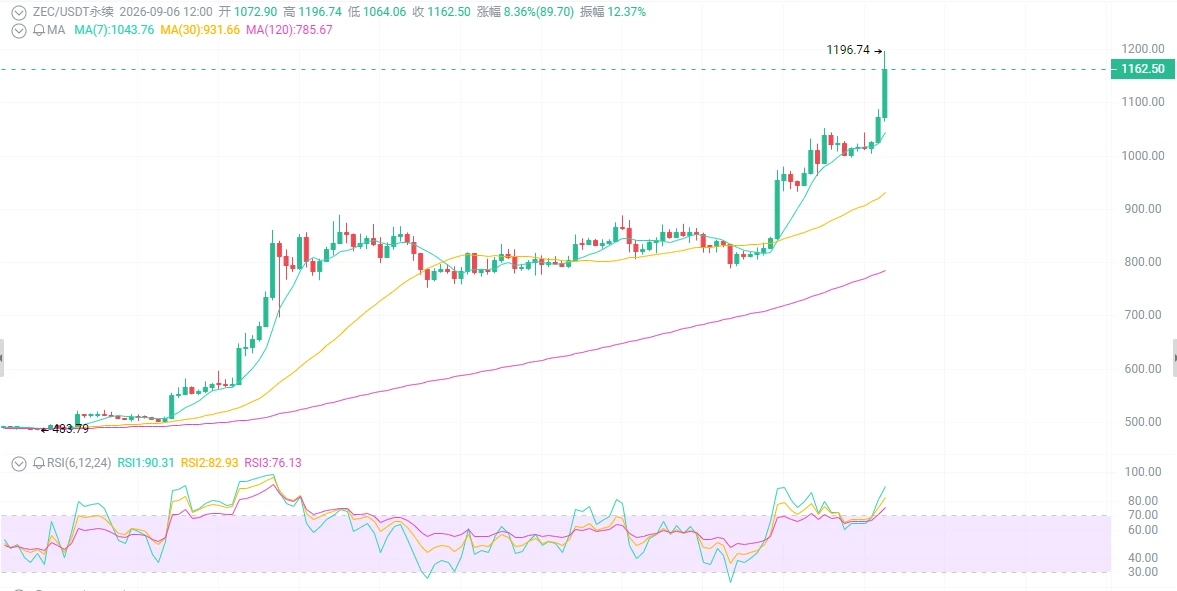
ZEC at $1,160—are you chasing it?
Look past the surface first: it has gone crazy, but do you dare get in?
It rose 13-16% in 24 hours, touching an intraday high of 1,195, with its market cap nearing $20 billion and breaking into the market's top ten. From the August low, this rally has nearly doubled. The EMAs are in a bullish alignment, ADX has reached 50, and trend strength is maxed out—a strong trend, but already scorching hot.
First: Grayscale's ETF has been live for two weeks, and institutions are buying with real money.
On August 25, the first U.S. spot ETF for a privacy coin—the Grayscal
post-image
ETH+1.56%
BTC+0.21%
ZEC+16.74%
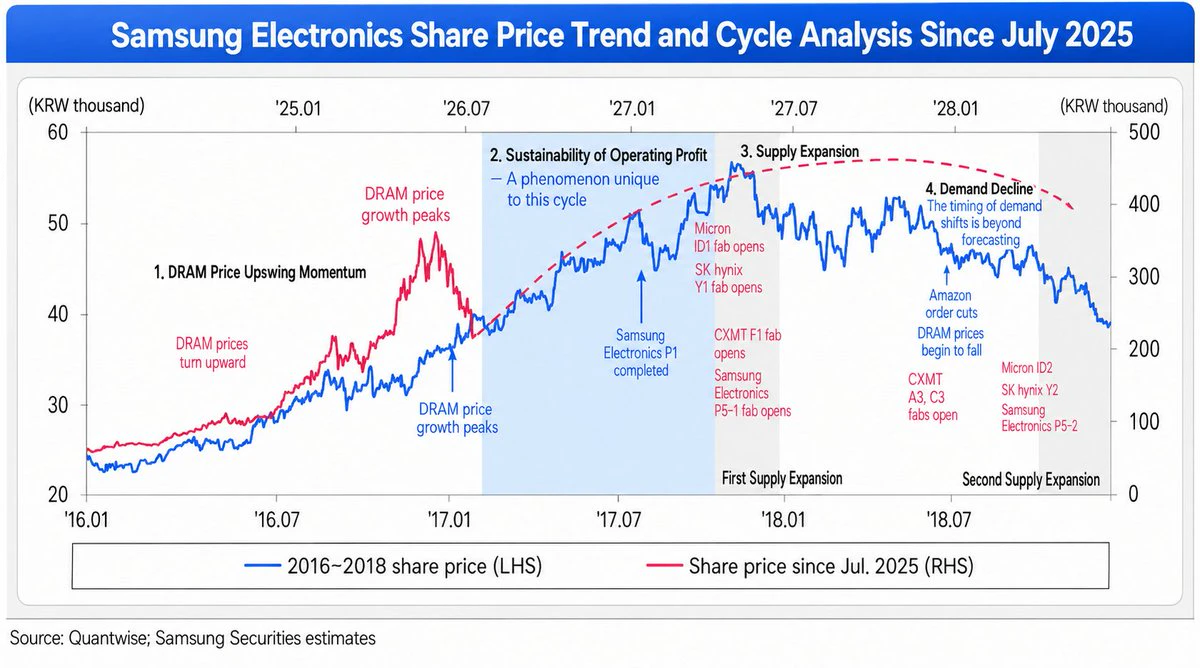
Samsung Securities’ Quantitative View of the Memory Market
post-image
Apple shares fell 2.35%: 7 iPhone 18 sales
Ahead of the iPhone 18 launch, Apple has encountered a new problem related to rising memory costs, raising concerns about pricing and consumer demand for upgrades.
Here are the key figures:
- Apple shares fell 2.35 percent during the day
The AAPL share price on the exchange is $320.51.
10-20% — the potential estimated price increase for the iPhone 18
Memory costs rose 400% year over year
Analysis of the Pro model’s storage capacity: 256 GB.
2026 — the expected iPhone 18 release cycle
Key issue: upgrade demand.
According to TrendForce, on September 4,
AAPL-2.51%
Everyone’s watching gold, but XAG/USDT just flashed a trap signal most retail will ignore.

XAG/USDT - SHORT

Trade Plan:
Entry: 66.23 – 66.27
SL: 66.46
TP1: 66.09
TP2: 65.98
TP3: 65.83

Why this setup?
- 4H bias is SHORT with 55.4% confidence, yet the 1D trend is *range*—not a breakout.
- Price is parked at 66.25, hugging the entry zone while RSI (15m: 42.3) lacks momentum to push lower fast.
- ATR (1H: 0.088) is thin—this isn’t a crash; it’s a slow bleed toward TP1 (66.09) and TP2 (65.98).
- Why now? The clock is ticking: if 66.46 (SL) breaks, the short thesis dies, but until then,
XAG+0.02%
Everyone’s long on $SKHYNIX /USDT while the 4h tape quietly flips—are you holding the wrong side?

$SKHYNIX /USDT - SHORT

Trade Plan:
Entry: 1285.21 – 1287.47
SL: 1300.40
TP1: 1275.80
TP2: 1268.77
TP3: 1258.23

Why this setup?
Why now? The 77.4 confidence short isn’t noise—it’s a range-bound 1D refusing to break higher. Entry sits at 1286.34, but the real tell is TP2 at 1268.77: a 1.36% drop before the 15m RSI (57) even cools off. With ATR at 4.5, momentum is tight, not explosive—this is a grind down, not a dump. The alt long scenario (TP1 1294.45) exists only if 1287.47 fails as resistanc
SKHYNIX+0.83%
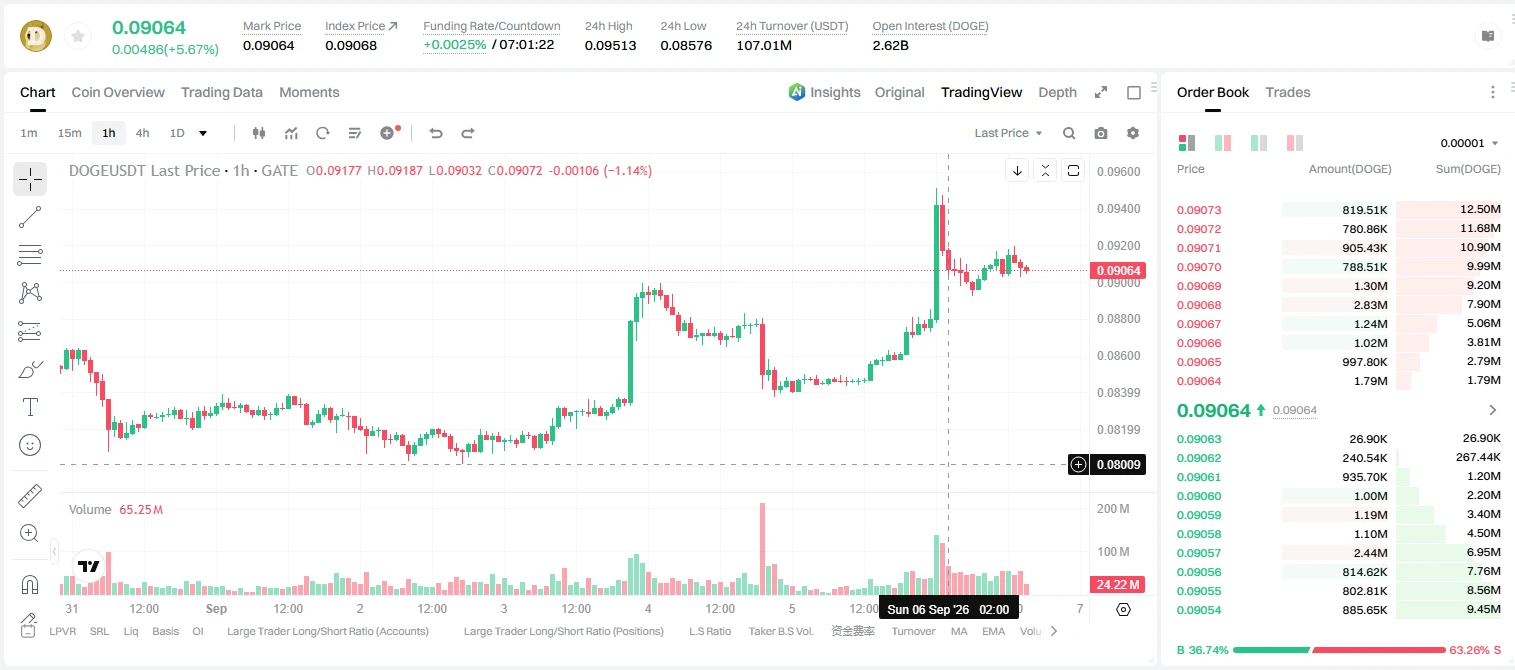
Everyone’s staring at the 0.09 handle—but the 4h chart just whispered a secret about DOGE that nobody’s tweeting yet.

$DOGE /USDT - SHORT

Trade Plan:
Entry: 0.09033 – 0.09091
SL: 0.09338
TP1: 0.08855
TP2: 0.08717
TP3: 0.08510

Why this setup?
- Price is pinned at 0.09062, but the 1D range means this is a coiled spring, not a trend.
- RSI (15m) at 47.39 is neutral—no panic, no euphoria—perfect for a fade.
- ATR (1h) at 0.001149 shows volatility is shrinking; the breakout will be violent.
- Why now? We’re sitting at the exact mid-point of your entry zone (0.09033–0.09091). The short t
post-image
DOGE+5.72%
MARKET ALERT - DOT (POLKADOT)
DOTUSDT is showing a very strong bullish trend on both the 1-hour and 5-minute timeframes. The current price is around 0.941, with the Exponential Moving Averages (EMA 20, 50, and 200) neatly aligned upward, indicating that buying momentum remains dominant.
​1-Hour Timeframe Analysis
The medium-term trend structure is very positive, with the price positioned above EMA 20 (0.920). The nearest resistance level is at 0.942. If this level is successfully broken with high volume, the price could continue rising further.
​5-Minute Timeframe Analysis
The short-term move
DOT+4.00%
THETA+1.01%
SENT-0.15%
  • 6
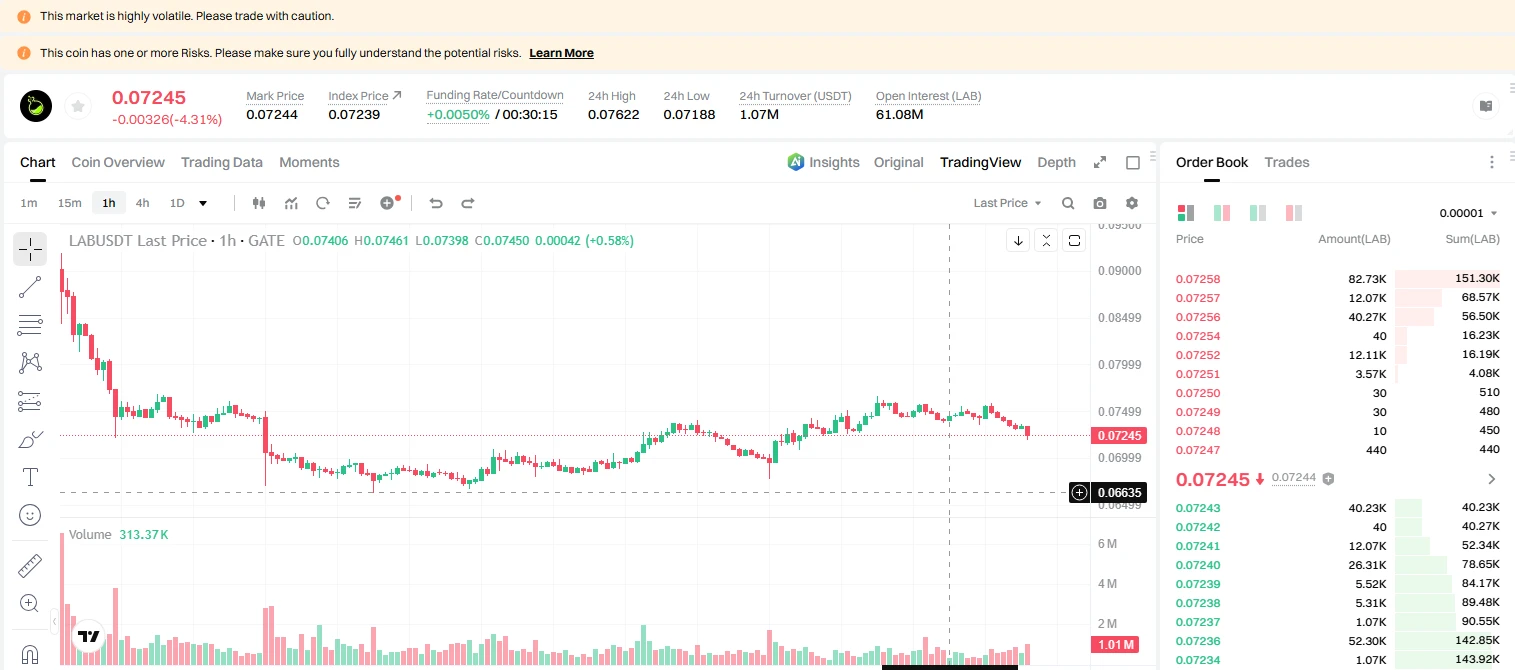
Everyone’s chasing LAB/USDT longs—but the 4h tape is screaming something else.

LAB/USDT - SHORT

Trade Plan:
Entry: 0.0722 – 0.0726
SL: 0.0746
TP1: 0.0707
TP2: 0.0696
TP3: 0.0680

Why this setup?
- RSI on 15m is crushed at 23.14—momentum is exhausted, not reversing.
- 1D trend is bearish, and price is hugging 0.0724 with TP1 at 0.0707.
- ATR (1h: 0.000918) shows room to slide, not bounce.
- Why now? The “Armed” status at 95% confidence means the setup is loaded—waiting for the breakdown, not the breakout.

Debate:
Are you fading this dip to 0.0680, or buying the 0.0707 support like
post-image
LAB-3.71%
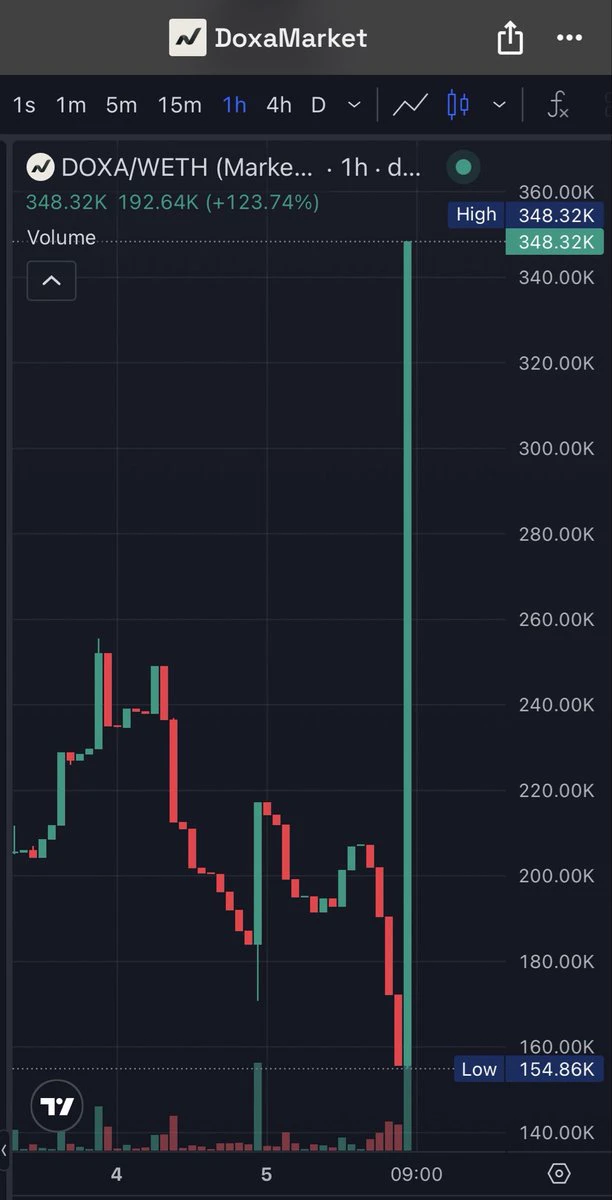
GM, who woke $DOXA up? 📈
post-image
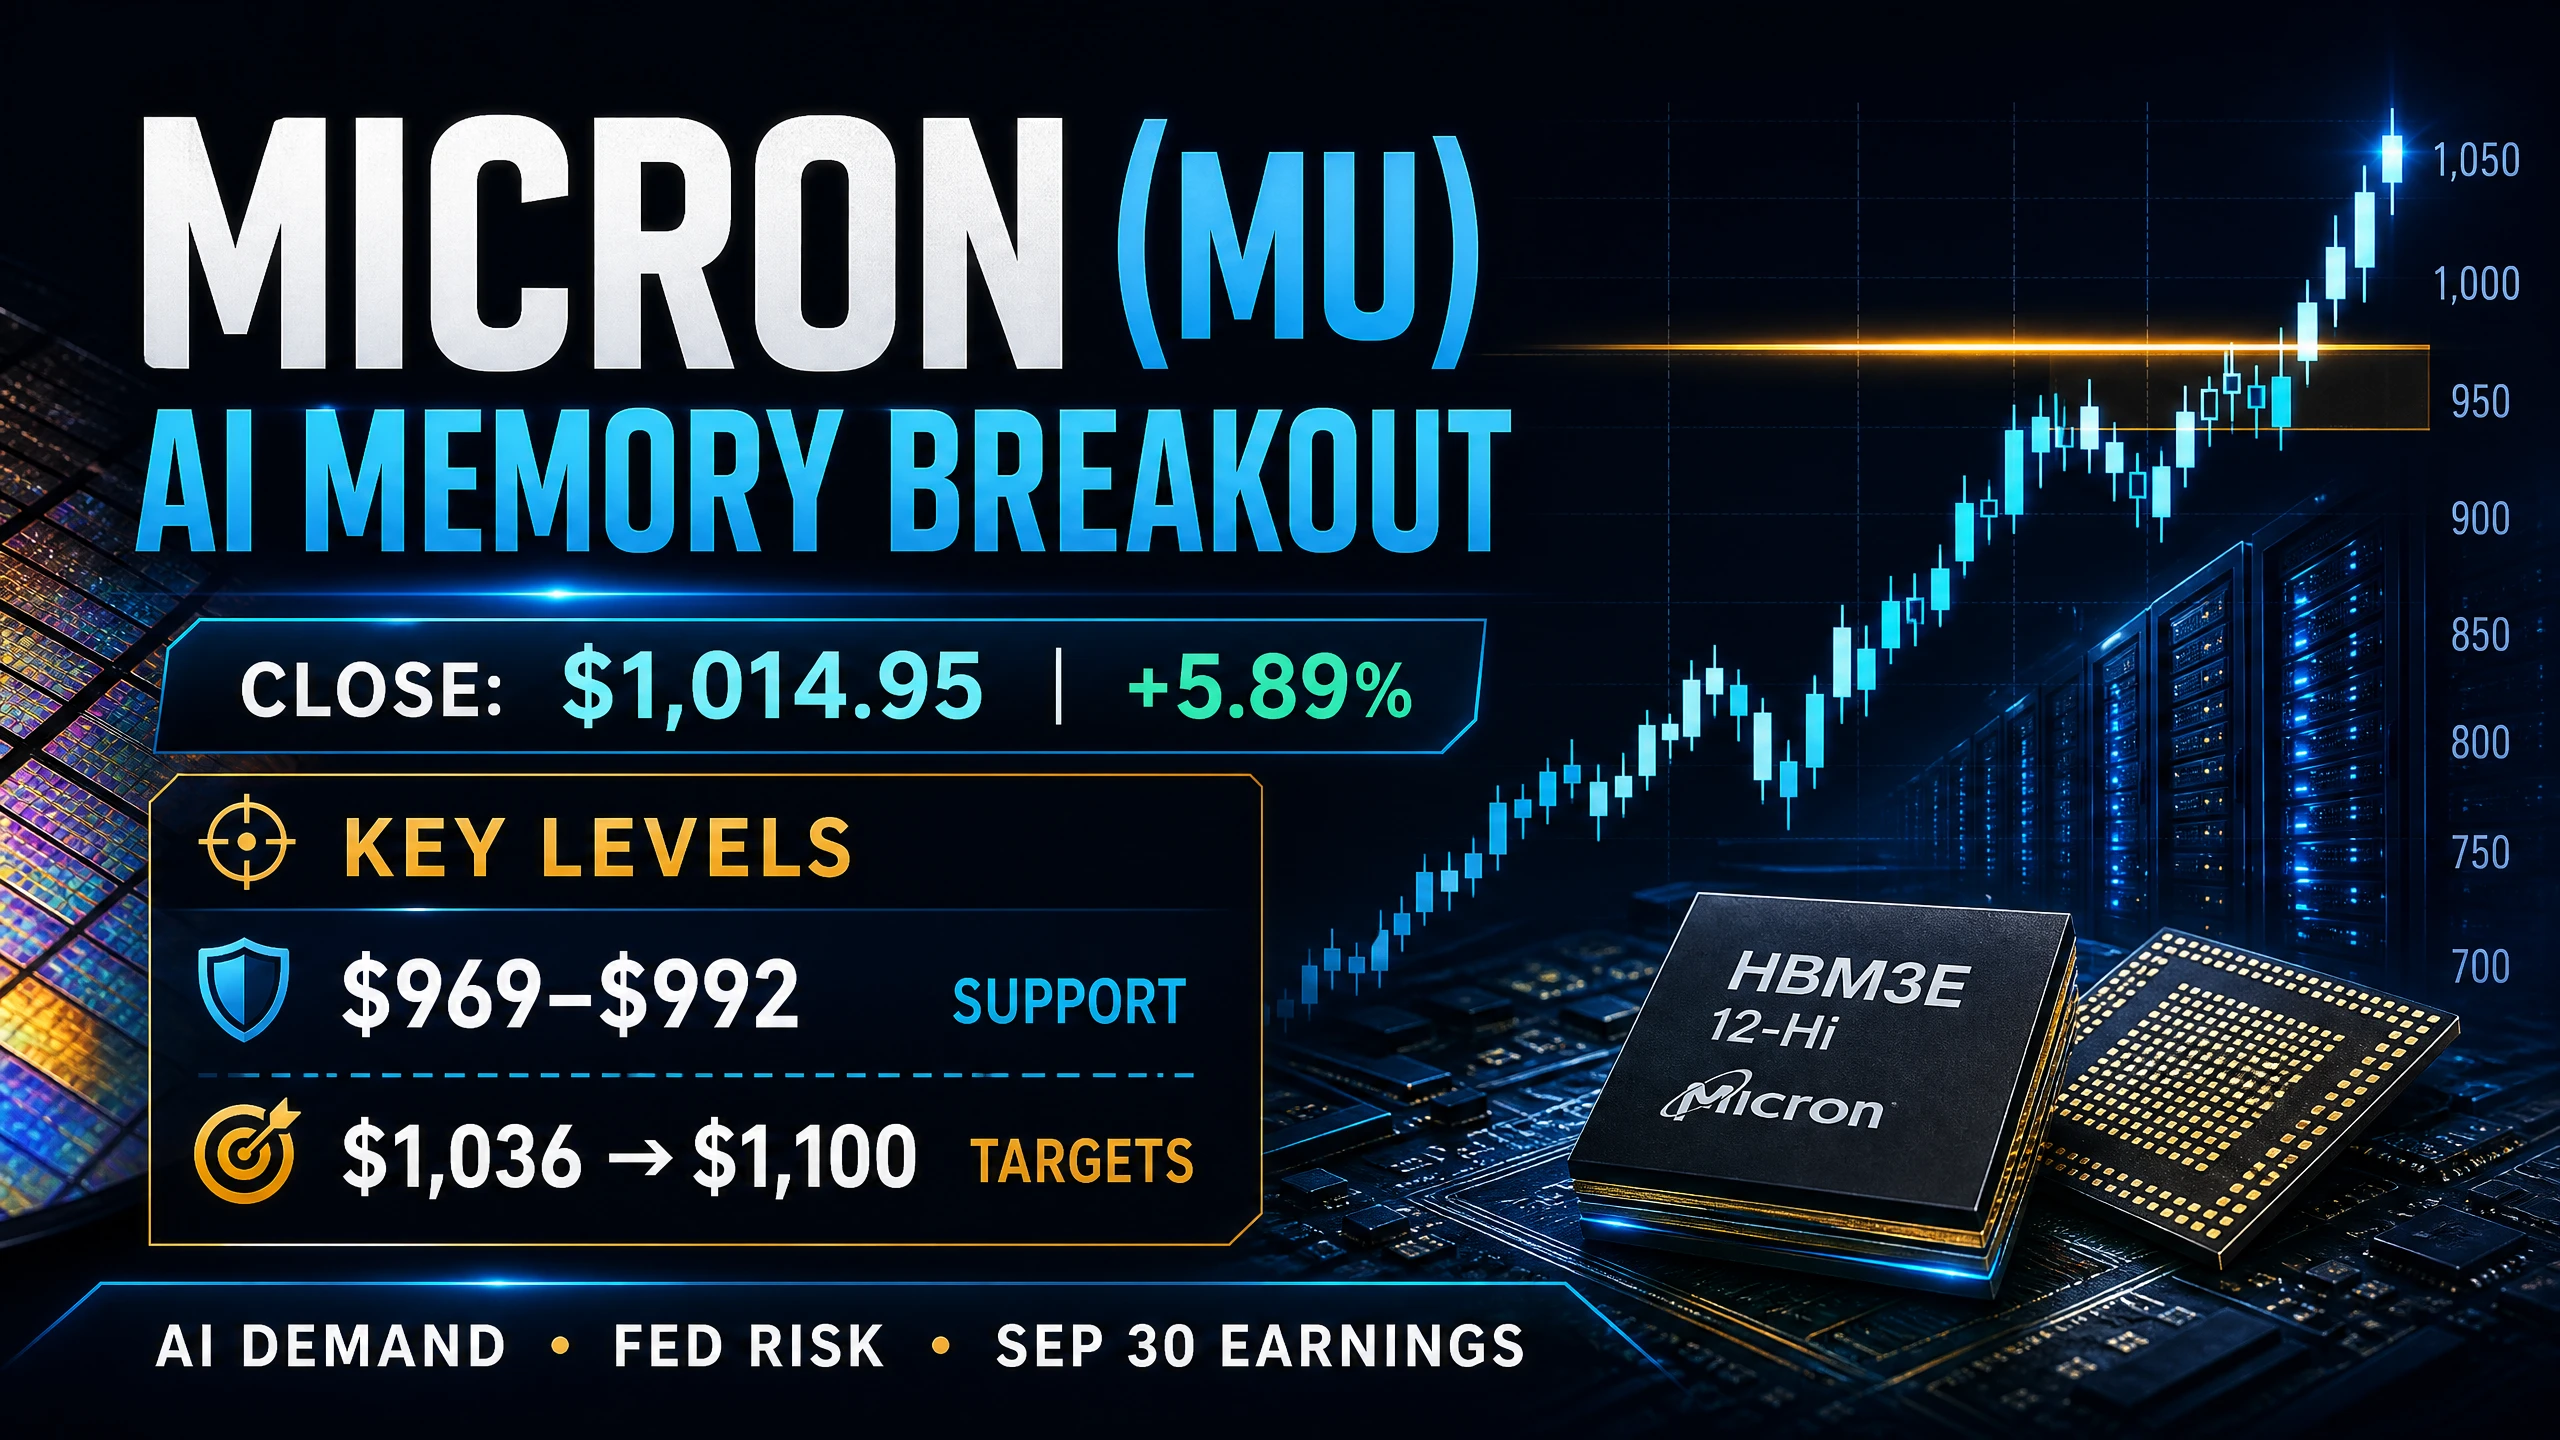
#​MU Micron Technology (MU) – Market Analysis (Data as of September 6, 2026, based on the September 4 regular session)
Micron closed its last completed trading session on Friday, September 4, 2026, at USD 1,014.95, up USD 56.46 or approximately 5.89 percent from the prior close of 958.49. The session ranged from 969.00 to 1,017.77 on roughly 30.7 million shares, the heaviest volume in twenty sessions at about 2.3 times its average, and the stock finished near its session high. US equities do not carry a rolling 24-hour change figure, so the latest full trading day is used here. That single-day
post-image
MU+5.89%
  • 4
  • 1
A U.S. court sentenced Meta-1 Coin operator Robert Dunlap to 23 years in prison for a scheme involving more than $20 million, defrauding approximately 1,000 investors. He claimed the token was backed by gold reserves and valuable paintings and promised high returns, providing forged audit materials; the assets did not actually exist, the funds were used for luxury spending, and the token was never issued on-chain. The SEC brought a civil fraud case in 2020, but Dunlap was not criminally charged until 2024. The FBI said the case destroyed the wealth and trust of many victims.
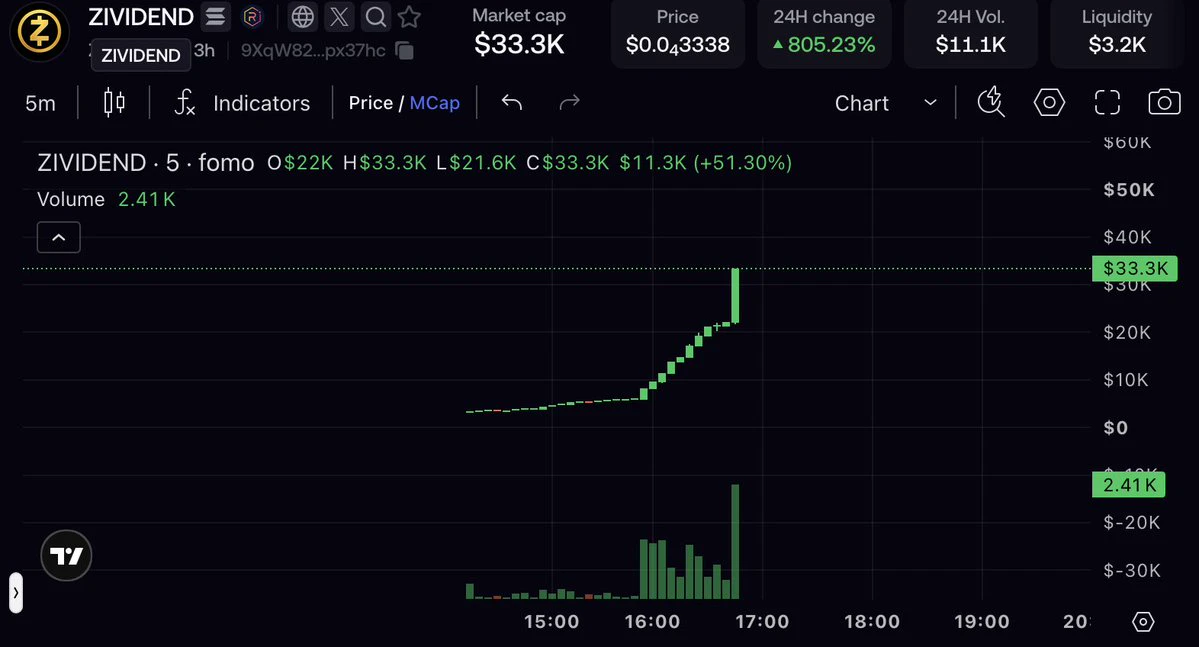
$ZIVIDEND!!!
33.3K$ MC
HIGHER WE GO
Free zcash:native dropping in your wallet!
post-image
ZEC+16.74%
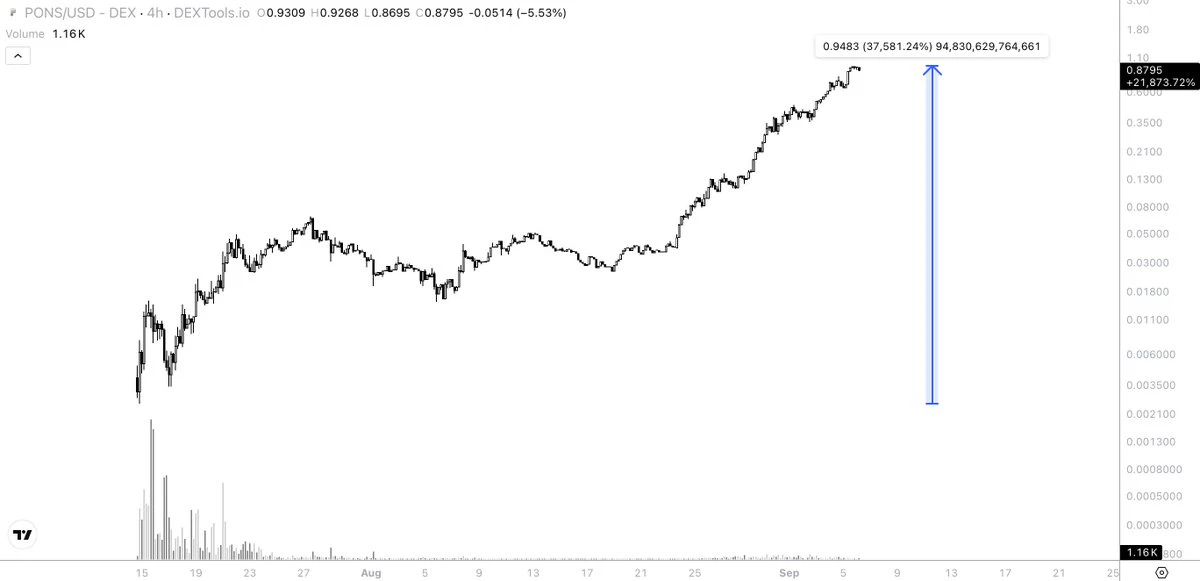
$PONS is now up 375x from its lows just 1.5 months ago.
it ran from a 250k mcap to nearly hitting unicorn status today.
it was fairly distributed and available onchain from the start. everyone had the exact same chance, and more than enough time to add it to their portfolios.
thanks to bear market ptsd, most people stayed completely sidelined (myself included). and even most of those who caught it early sold way too soon, locking in solid profit but still missing a generational run.
it took a runner like this for people to wake up and start believing in something again. the bear market is over
post-image
PONS+11.19%
Live trading - Analysis Crypto market
live-cover
LIVE2,160
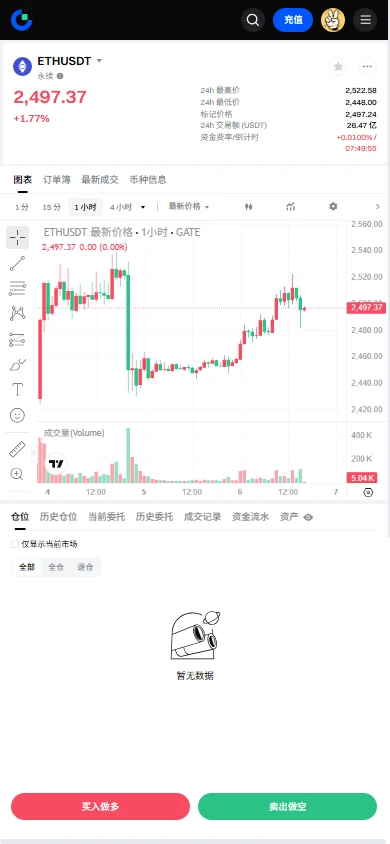
$ETH Signal】Long + 4x order book depth skew
$ETH Depth imbalance 60.19%, with buy-side orders 4.02 times the sell-side depth, fully exposing the intent to provide downside support.
The 4H MACD histogram is expanding, and bullish momentum remains intact. The 1H MACD histogram is narrowing, indicating that after the short-term surge, price has entered a consolidation phase. Price has pulled back near the 1H EMA20, with the 2488-2495 area forming a short-term support zone. The 1H RSI is 57.49, not yet overbought, leaving room for further upside. The funding rate is 0.0069%, within the normal ran
post-image
ETH+1.59%
Most traders ignore the 4h candle that just armed a trap on $ETH /USDT—here's the catch.

$ETH /USDT - SHORT

Trade Plan:
Entry: 2489.09 – 2495.53
SL: 2523.25
TP1: 2469.11
TP2: 2453.64
TP3: 2430.44

Why this setup?
- Bias is SHORT with 55.4 confidence, but the 1D range says we're not in a breakout—yet.
- Entry at 2492.31 sits right at the 1h pivot; RSI 15m at 44.86 shows no oversold bounce fuel.
- ATR 12.89 on 1h means TP2 at 2453.64 is ~3 ATRs away—realistic if momentum follows.
- Why now? The range's lower bound is being probed, and a 4h close below 2466.79 invalidates the short—so
ETH+1.59%
Most traders are watching XLM upside while the 4h chart quietly whispers otherwise.

XLM/USDT - SHORT

Trade Plan:
Entry: 0.18518 – 0.18592
SL: 0.18914
TP1: 0.18286
TP2: 0.18107
TP3: 0.17838

Why this setup?
Why now? The 1D trend is range, not breakout—so the 55% SHORT bias isn't fighting momentum, it's fading it.
• RSI 15m at 48.9 = zero bullish fuel left for a push above 0.18592.
• ATR 1h (0.0015) shows volatility is tight—perfect for a grind to TP1 (0.18286) before the trap zone at 0.18266.
• Entry sits mid-range at 0.18555, but the alt (long) setup is invalid below 0.18196—meaning
XLM+1.42%
Honestly, $ARB ’s move this time won simply on the word “wait.”
While others crowded into the fishing ponds of popular coins, I chose to lie in wait in a corner of the market that few paid attention to. ARB had been moving sideways for a while, wearing down everyone who lacked patience. But in Wyckoff theory, this is called “selling pressure exhaustion and smart-money accumulation.”
The line of least resistance turned upward, so I opened a 60x long on Gate’s ARBUSDT perpetual at 0.13570 and held it to 0.19474, sending the unrealized return straight to a terrifying +2498.05%!
But despite the ex
ARB+49.28%
BTC+0.25%
ETH+1.59%
BTC AND ETH MARKET
live-cover
LIVE1,897
Load More

Join 40 M users in our growing community

⚡️ Join 40 M users in the crypto craze discussion

💬 Engage with your favorite top creators

👍 See what interests you

View More