Share your thoughts
placeholder
Article
Everyone’s staring at WLD’s 0.397—but the real trap is the 0.387 invalidation line.

WLD/USDT - SHORT

Trade Plan:
Entry: 0.396 – 0.398
SL: 0.408
TP1: 0.389
TP2: 0.383
TP3: 0.375

Why this setup?
Why now? The 4h frame is armed for a short, yet confidence is only 55—that’s hesitation, not conviction. RSI(15m) at 48.57 is dead neutral, so no momentum push. ATR(1h) at 0.0046 means volatility is thin; this range could snap violently. Entry at 0.397 with TP1 at 0.389 is a 2% scalp, but TP3 at 0.375 is 5.5%—that’s the real prize if the daily range breaks down.

Debate:
Will WLD respect the 0.387
WLD+4.35%
$ZEC #ZCASH #ZECUSD
ZEC Pullback Setup 📉
After hitting a new All-Time High (ATH),
ZEC is
showing signs of a potential pullback.
🔴 Resistance: $1,040–$1,050
🎯 Target: $830 or Down
🟢 Support: $770–$820
Expecting a retracement from
the $1,050 area toward $830 or lower.
The $1,040–$1,050 zone is
now a fresh resistance
area to watch closely.
Not Financial Advice.
$BTCUSD $ETHUSD $XRP
post-image
ZEC-1.34%
XRP+1.24%
  • 1
Nonfarm payrolls beat expectations—should BTC be cautious? The real pressure comes from here
U.S. nonfarm payrolls increased by 162,000 in August, far exceeding market expectations, while the unemployment rate held at 4.1%. After this data was released, the market's first reaction was very direct: expectations for Fed rate cuts cooled, and interest rates once again became the “sword of Damocles” hanging over risk assets.
For BTC, this logic is particularly important.
Over the past period, one of the core narratives driving the crypto market higher has been improving liquidity. If the U.S. econ
NVDA+0.87%
  • 45
U.S. August nonfarm payrolls “blockbuster”! Rate-cut expectations suddenly cooled?
The U.S. August nonfarm payrolls were indeed a bit “strong.” New jobs came in at 162k, directly blowing past market expectations of just over 50k, while the previous two months’ figures were revised up by a combined 55k. The unemployment rate held steady at 4.1%. On the headline figure alone, this is not a cooling labor market, but one that suddenly stepped on the gas.
The market’s most direct reaction was that the Federal Reserve’s rate-cut logic began conflicting again. Investors had previously bet on an econo
BTC+0.07%
NAS100+0.50%
  • 40
Financial News, Crypto Updates, Real-World Strategies
live-cover
LIVE1,345
Why is HYPE's 1D trend screaming bullish while its 15m RSI is frozen at 47.58?

HYPE/USDT - LONG

Trade Plan:
Entry: 85.18 – 85.46
SL: 83.93
TP1: 86.36
TP2: 87.06
TP3: 88.10

Why this setup?
The market is coiling, not reversing.
- 4h setup: LONG with 95% confidence—this isn't a guess.
- Pullback to 85.32 sits right on the 1h reference, with ATR (0.58) signaling low volatility = compressed spring.
- TP1 at 86.36 is only 1.2% away; TP2 at 87.06 and TP3 at 88.10 are within a single 4h candle's range on a bullish day.
- The 15m RSI is neutral, not overbought—meaning buyers haven't exhau
HYPE+1.63%
I just came across a post on Facebook made by the FCT Police Command.
​The parents abandoned the child, so I don't see any reason for them to ask for information about the parents just to give the child back to them.
​If they had the mind to abandon the child in the first place, why assume they would take the child back and care for him or her?
​Unless they are just using this as a tactic to track down, arrest, and prosecute the person who abandoned the child.
post-image
Everyone’s chasing the next 100x, but ZEC just printed a 95% confidence LONG signal while retail is asleep.

$ZEC /USDT - LONG

Trade Plan:
Entry: 1002.66 – 1010.92
SL: 967.12
TP1: 1036.55
TP2: 1056.38
TP3: 1086.14

Why this setup?
- 4h structure aligns with the daily bullish trend, but the 15m RSI (36.18) is oversold—this is the classic "pullback in an uptrend" setup.
- Entry zone is tight (1002–1010), giving us a low-risk trigger right at the 1h pivot (1006.79).
- Why now? The ATR (16.53) suggests volatility is compressing—breakout fuel is building. Target 1 is 3% away, but TP2 (1056)
ZEC-1.17%
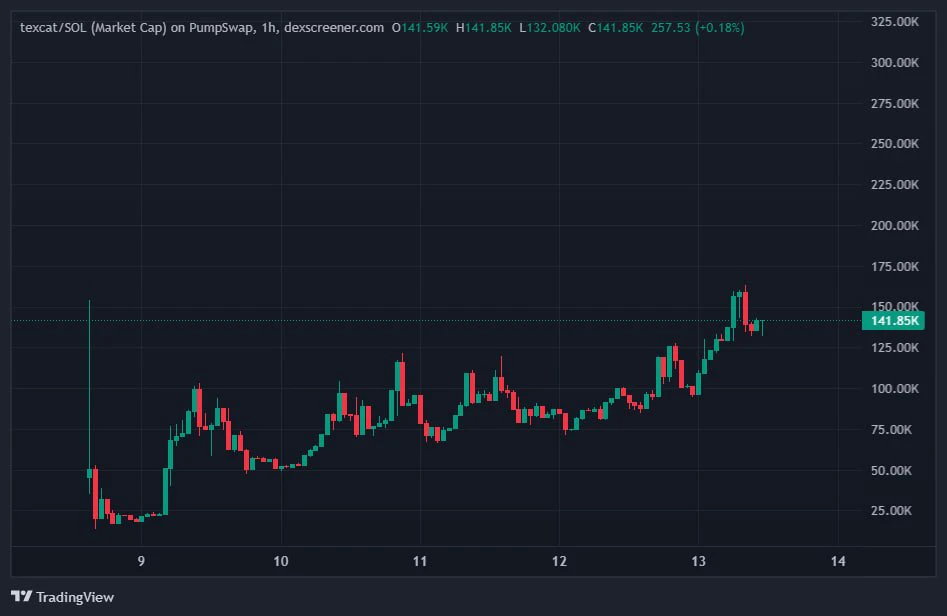
okay hot take guys
if you do not have insider info or (info) and you are trading memes
you are going to lose 99%
also if your fomo account is not an advert board for memecoins you will not make it
do not be fooled
Nobody’s watching LTC’s 4h chart—but the range is about to snap like a dry twig.

$LTC /USDT - SHORT

Trade Plan:
Entry: 53.73 – 54.03
SL: 55.28
TP1: 52.83
TP2: 52.13
TP3: 51.09

Why this setup?
Why now?
- Price is glued to 53.88, but 1D trend = **range**, not momentum. Ranges don’t last forever.
- RSI 15m at 42.08—already rolling over *before* a retest of range lows. That’s early weakness.
- ATR 1h = 0.58—volatility is compressed. When it expands, the move is violent.
- Short plan: entry 53.88, TP1 52.83, TP2 52.13. That’s a 1.7R to first target with SL 55.28.
- If 53.73 breaks,
LTC+6.45%
Web3 and crypto continue to evolve at an incredible pace new ideas, protocols and use cases are emerging every day. But in a market where innovation is constant novelty alone won’t create lasting value.
The projects that truly stand out will be those that go beyond speculation solve meaningful real-world problems, simplify adoption and bring more people into the digital economy.
The future of Web3 won’t be defined by whom makes the most noise.
It will be defined by whom builds what people actually need.
#Web3
post-image
BTC MARKET UPDATES
live-cover
LIVE23
A few days ago, my hand trembled slightly while setting the stop-loss; this morning, I realized that was unnecessary filial piety.
During the repeated intraday swings, $BEAT was pushed back every time it rebounded to around 0.1339, increasingly looking like the bulls were running out of steam. Support above was too weak, and volume failed to follow, so I went short with the trend, set the stop-loss, and went to sleep.
When I opened the chart this morning, it had dropped straight to 0.1233, +152.93%. That sleep was worth it—I didn’t stay up for nothing. The short position had exactly the tempe
post-image
BEAT-0.32%
DOGE+7.32%
BTC+0.11%
#ALTSEASON 2026 💸
SEPTEMBER, OCTOBER, NOVEMBER ALTCOINS and MEMECOINS WILL GO PARABOLIC 🔥 🚀
WHAT PROJECT DO YOU STILL BELIEVE IN RIGHT NOW, DESPITE EVERYTHING? 👇
post-image
$SOL Signal】Long, 1H buy-side support
$SOL Buy-side support is clear: 1H MACD histogram at 0.135, depth ratio at 1.05, and funding rate at 0.0083%. At 12:00, increased volume pushed the price to 103.19, with buyers accounting for 0.63 of transactions; at 13:00, a long upper wick led to a pullback, followed by a rapid recovery to 102.8 at 14:00. The 4H MACD golden cross is continuing, and OI is stable. The price is approaching the 1H Bollinger upper band at 102.99, with dense orders around 102.5 below, while selling pressure has been continuously absorbed. The risk-reward ratio is within an ac
SOL+1.93%
Everyone’s staring at LTC’s range—but the 77% short signal says the exit door is already open.

LTC/USDT - SHORT

Trade Plan:
Entry: 53.89 – 54.17
SL: 55.80
TP1: 52.70
TP2: 51.82
TP3: 50.49

Why this setup?
- Price is pinned at 54.03 while 4h momentum rolls over; RSI 15m at 47 shows no buying spark.
- ATR 1h (0.57) is tight—this coil snaps fast, and TP1 at 52.70 is only 2.5% away.
- 1D trend is *range*, not bull—so this isn’t a dip-buy, it’s a mean-reversion gift.
- Why now? Entry zone 53.89–54.17 is the last polite area before the slide to 51.82.

Debate:
If LTC breaks 53.80, do you
LTC+6.45%
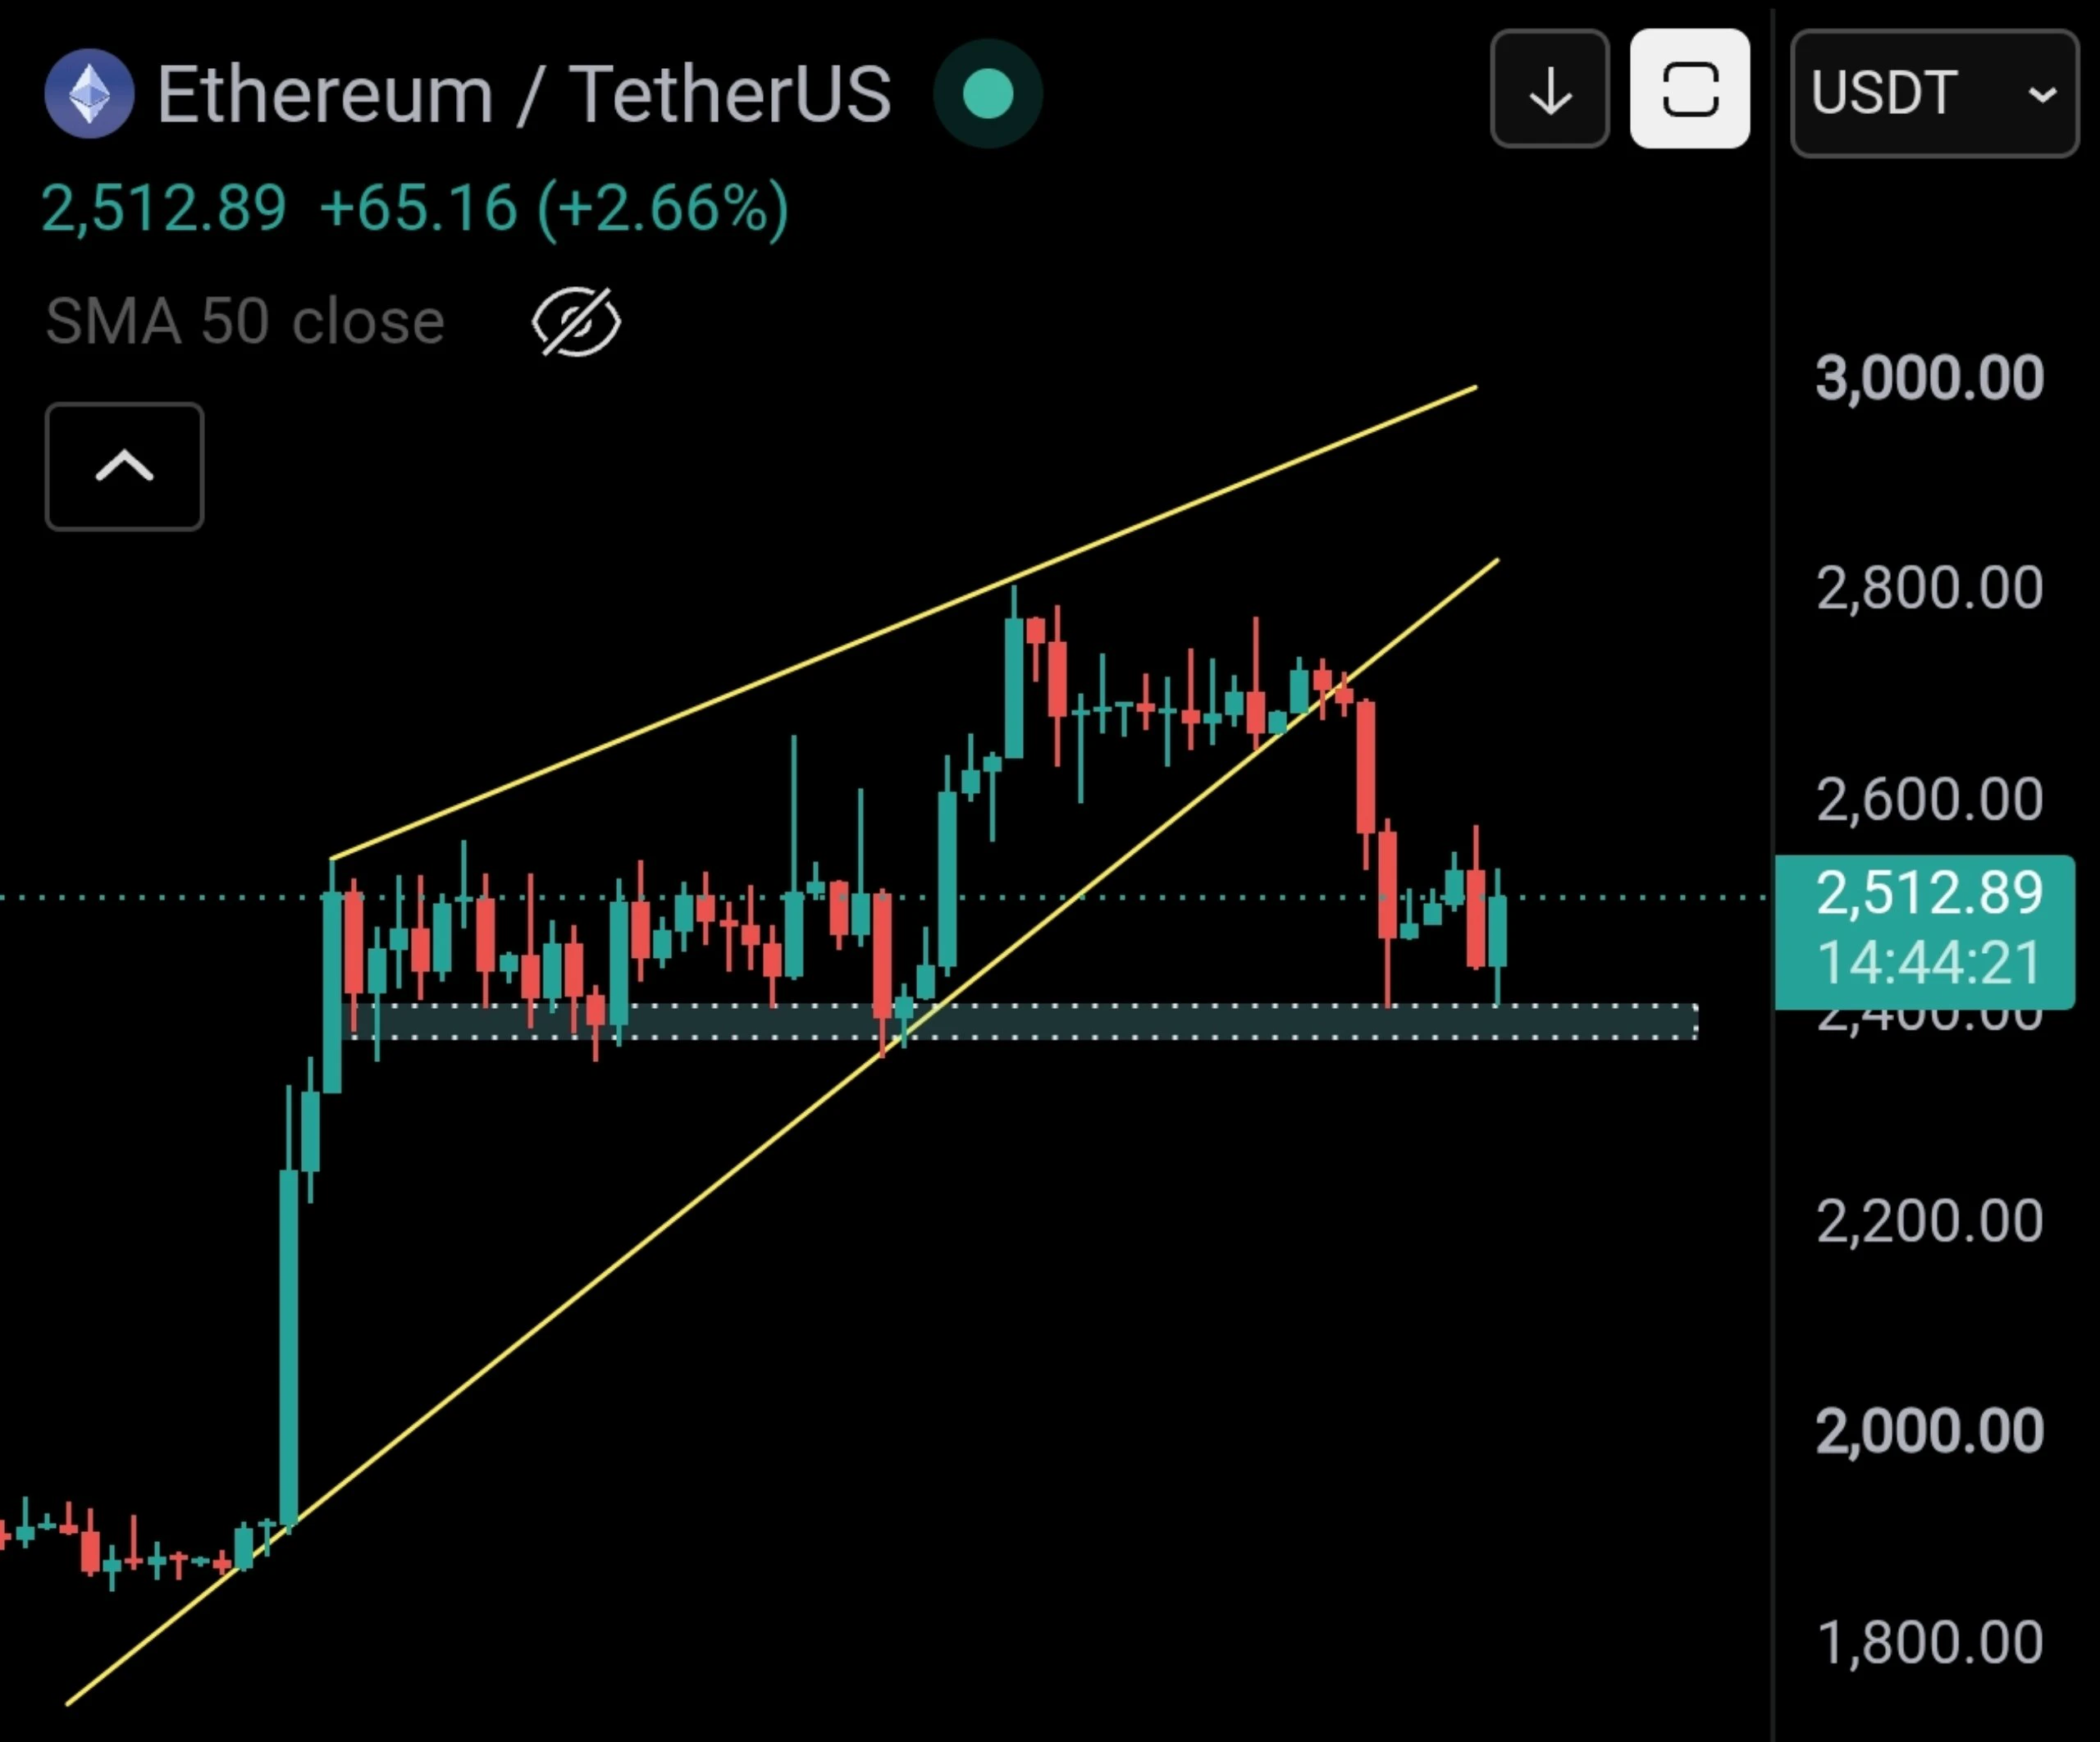
Feels good, brothers. But the position management is still the same: take profit on 80% first—don’t be greedy for the last bite. Move the stop-loss on the remaining 20% closer to the entry price and let it run; however much profit it makes is pure profit. Don’t turn unrealized gains into losses.

$ETH $LAB
post-image
ETH+1.09%
LAB+2.80%
$TUT Signal】Long + negative funding rate short-squeeze buying dominates
$TUT Depth ratio 1.22, bid depth exceeds ask depth by 20%, and the 4H MACD histogram at 0.0010 remains above the zero line. The funding rate is -0.0172%, with shorts continuing to pay. The 1H RSI is 58.92 and the 4H RSI is 53.93, not yet in an extreme zone. The current price of 0.02808 is near the upper bound of the entry range, while the stop loss at 0.0277992 is about 1% away below, and intraday volatility is sufficient to trigger an exit.
🎯Direction: Long
⚡Entry/orders: 0.0279958 - 0.0280800
🛑Stop loss: 0.0277992
🚀T
post-image
TUT+21.47%
BTC+0.07%
ETH+1.07%
SOL+1.85%
Most traders will fade this $SLX /USDT short before the 4h close—here’s why that’s a mistake.

$SLX /USDT - SHORT

Trade Plan:
Entry: 0.06997 – 0.07029
SL: 0.07167
TP1: 0.06898
TP2: 0.06821
TP3: 0.06705

Why this setup?
- RSI 15m at 48.34 = zero momentum to push higher, just dead air.
- ATR 1h (0.000641) shows shrinking volatility—breakouts fail fast in range.
- Entry ref 0.07013 sits below 1D range mid; TP1 0.06898 is only 1.6% away.
- Why now? The “Armed” status means the trap is set before the weekend liquidity hunt.

Debate:
Are you shorting the breakdown to TP2 or waiting for a
SLX+1.46%
$MU ‌Micron Technology (MU), a leading player in the semiconductor and memory technologies sector, continues to attract attention in the stock market with the strong demand generated by its artificial intelligence infrastructure investments. The stock gained 5.89% during intraday trading, rising to $1,014.95 for a strong session close.
Corporate Financial Data and Market Indicators
The current market values and trading data for Micron Technology are as follows:
Current Share Price: $1,014.95 (Daily change: +$56.46 / +5.89%)
Market Cap: $1.146 trillion
Intraday Trading Range: Lowest $969.00,
MU+5.89%
NAS100+0.06%
  • 5
  • 1
Load More

Join 40 M users in our growing community

⚡️ Join 40 M users in the crypto craze discussion

💬 Engage with your favorite top creators

👍 See what interests you

View More