


Square
Following
Hot
News
Notifications
Profile
Share your thoughts
placeholder
Article
Some traders say that when it’s fallen this far, there’s no point watching macro anymore. It sounds convincing, but I don’t quite agree. $KERNEL is now at 0.0411, down 16.53% in 24 hours, with $45.1M in trading volume—moves like this are exactly where macro transmission can amplify sentiment most easily.
The chain isn’t complicated. When expectations for dollar liquidity tighten, large players cut peripheral assets first, not major coins. Once peripheral assets fall, market makers’ order books thin out, and even a little selling pressure can open a hole in the order book. Assets like $KERNEL ,
KERNEL-7.76%
  • 1
  • 1
#pi Buy when the price is low if you have liquid funds. Absolutely do not take out online loans to buy in. Even if the DEX launches in Q1 2027, it may not be available in many regions. Anyone familiar with the team knows trading won’t launch in regions without licenses. Don’t expect to make a quick profit; keep accumulating gradually for the long term.
PI-0.60%
  • 3
Trenches
IDOL
I
bade
b
IDOL
0x3b...ab07
Market Cap
$.
Change
.
24h Vol
$.
Holders
.
PIEVERSE
P
bade
b
PIEVERSE
0x0e...25a9
Market Cap
$.
Change
.
24h Vol
$.
Holders
.
FIONA
F
bade
b
FIONA
B34n...pump
Market Cap
$.
Change
.
24h Vol
$.
Holders
.
Singularity
S
bade
b
Singularity
7R4M...pump
Market Cap
$.
Change
.
24h Vol
$.
Holders
.
CLAUDIA
C
bade
b
CLAUDIA
2j5S...W2ZM
Market Cap
$.
Change
.
24h Vol
$.
Holders
.
Nov 22 morning session: ETH resumed moving sideways after a rebound. Watch the 1674–1692 range first.

There is support at 1674–1676, where you can wait for a brief long opportunity after the price stabilizes. If it fails to break through 1689–1692, watch for a pullback. If it later holds above 1692 on increased volume, look next at 1697–1705; if it breaks below 1672, watch 1663 and 1653.

My approach is to stay mostly inactive in the middle and wait for confirmation at key levels. Don’t let a sharp rally or sell-off throw off your rhythm. The key now is which of these two levels gives a direc
post-image
ETH-1.23%
  • 3
Crypto Trade Today
live-cover
LIVE1,094
AAPL-1.83%
AMD-13.27%
PLTR-6.45%
NVDA-13.84%
MU-13.88%
$TRX The real logic behind TRON fees in one sentence:
USDT transfers burn energy → someone stakes TRX in advance and “rents out” the energy → high-frequency users rent it to save 5x → stakers collect rent while sitting back.
A closed loop that sustains an entire ecosystem niche. Once you understand this, you’ll understand why some people keep buying TRX.
post-image
TRX+0.42%
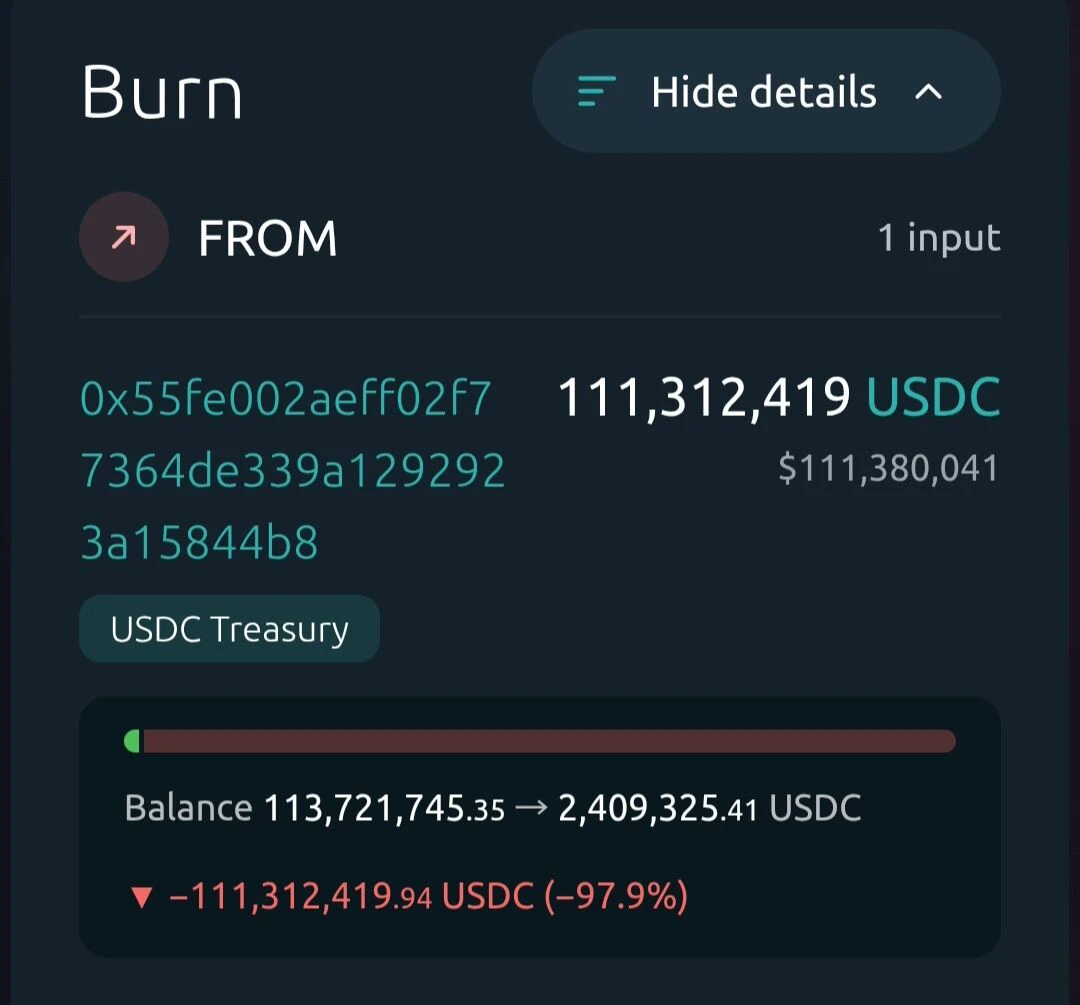
111.3 Million USDC Burned

A large USDC burn has caught attention after 111,312,419 USDC, worth approximately $111.3 million, was removed from circulation.

Token burns are part of stablecoin supply management and can happen for several reasons, including redemptions and liquidity adjustments.

However, a large burn does not automatically indicate bullish market sentiment. The bigger picture depends on overall supply, demand, and stablecoin activity.

An interesting on-chain development worth watching.
#BTCBreaksBelow60K #GateDirectIPOPhase3ANTAllocates92100Shares
post-image
USDC+0.01%
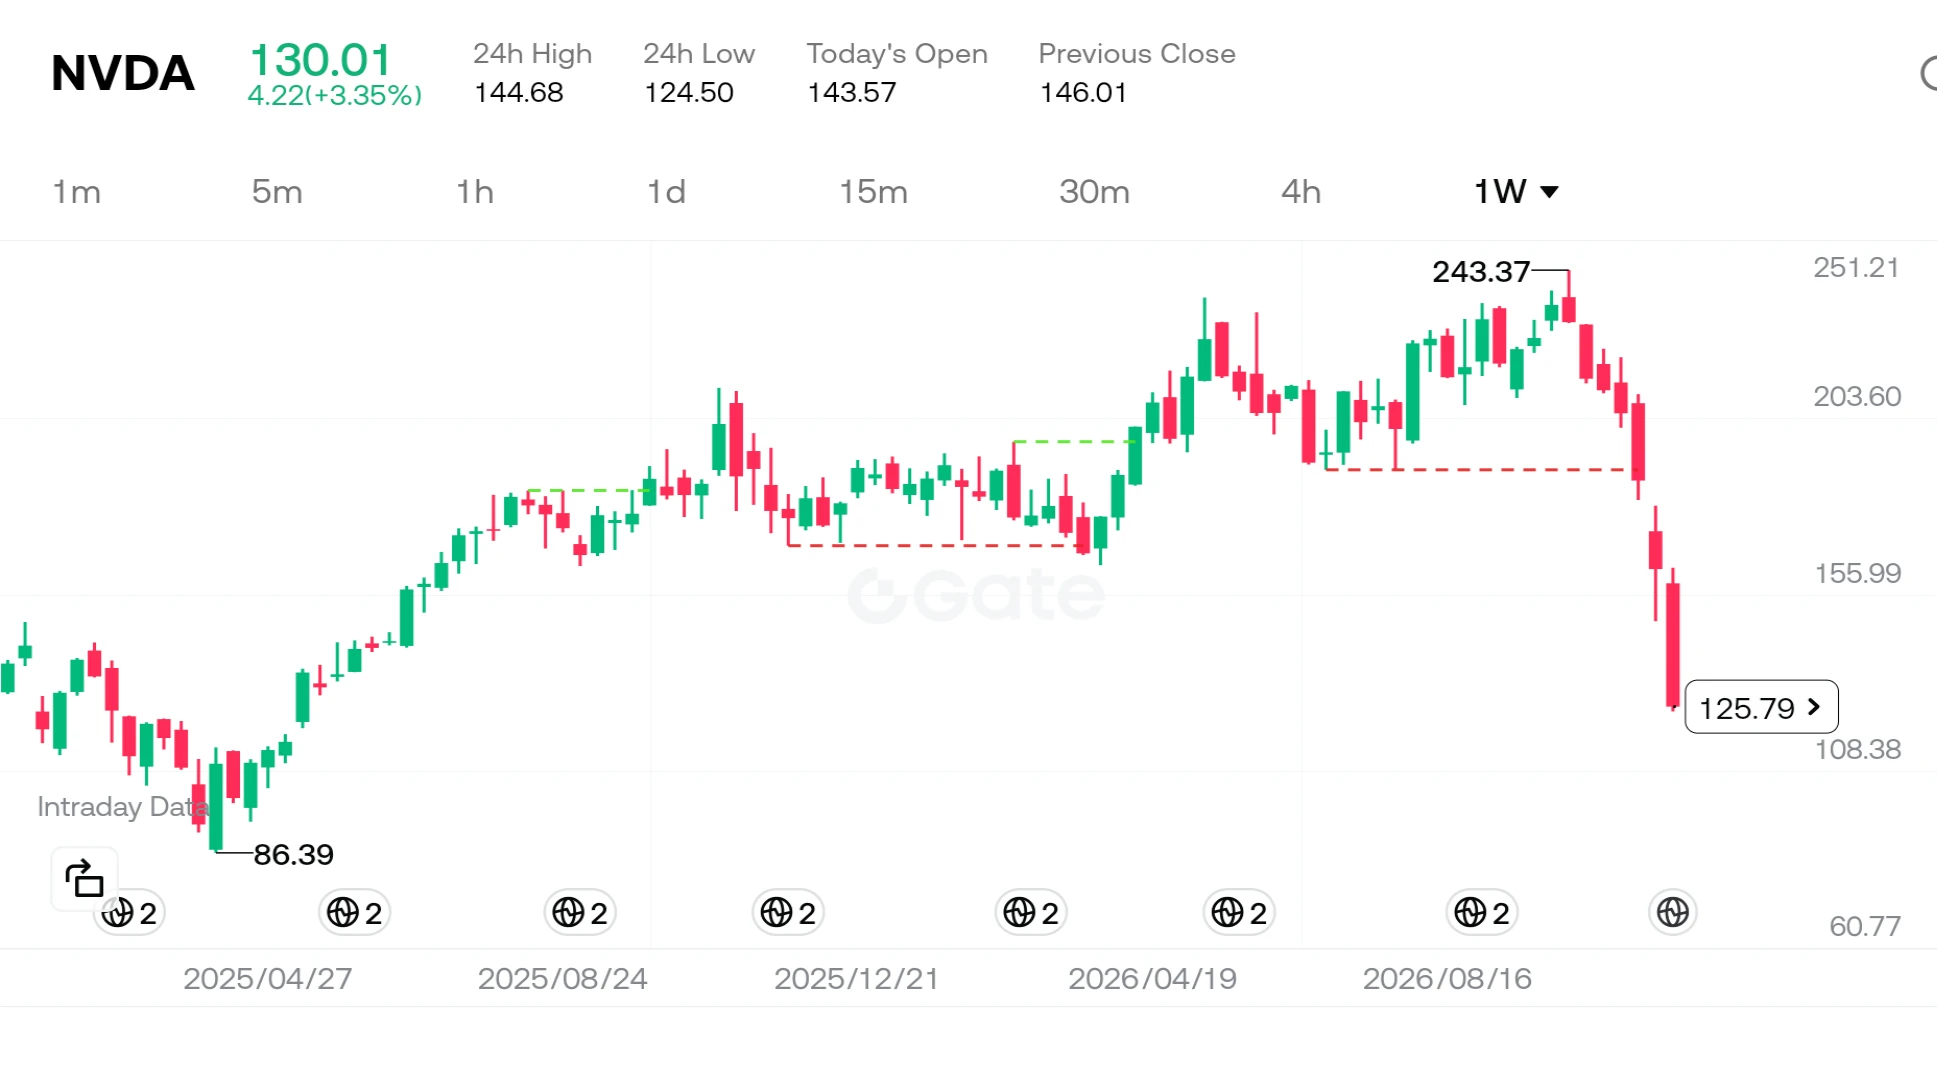
Nvidia shares failed to bring any cheer to investors, slipping to the $130 level in weekend trading. The sharp decline from the stock's peak of $243 can no longer be dismissed as a mere "market correction." The formal investigation launched by the U.S. Securities and Exchange Commission (SEC) into the company’s accounting practices has served as the primary catalyst for this downturn.

So, what does this investigation signify, and why has it shaken the stock price so profoundly?

Looking first at the company itself: as the driving force behind the artificial intelligence revolution, Nvidia has
post-image
User_any
$NVDA ‌
Nvidia has been losing ground for seven consecutive weeks—a trend not seen since 2008. The stock plummeted 14% last Friday alone, bringing its total decline over this seven-week period to approximately 46%. As clearly illustrated on the chart, the price has retreated from a peak of $243 to the $125 range. So, what is the story behind how this once-most-valuable company reached this point?
In reality, this is not merely a stock market correction; it is the result of three major, intersecting storms hitting the same vessel.
First, let’s look at the company’s internal dynamics. Uncertainty within management following a CEO transition, combined with the SEC’s decision to investigate the company’s accounting practices, has severely shaken market confidence. But that is not the whole story. The massive scale of spending on artificial intelligence has led investors to ask: "So much money is being spent—but when will we see a return?"
Meanwhile, macroeconomic headwinds have also shifted. Minutes from the Federal Reserve’s meetings indicate that nearly all officials expect interest rate hikes to continue. A high-interest-rate environment exerts significant pressure on growth stocks, which are valued based on their projected future cash flows. This situation has impacted not only Nvidia but the S&P 500 as well; the index fell 8.6%, marking its worst week since April 2025 and pushing it into correction territory.
Even the major Anthropic IPO that took place last week was not enough to halt this wave of selling. For many analysts, this situation serves as proof that the market is no longer focused on "new narratives," but rather exclusively on "cash flow and profitability." The fact that gold and silver have fallen to their lowest levels in over a year, combined with oil’s decline for the third consecutive week, highlights just how fragile risk appetite has become. Investors have effectively "retreated to their corners."
The most important lesson for individual investors here is that, regardless of how strong a company’s operational performance may be, macroeconomic headwinds and management uncertainties can fundamentally shake its valuation. Nvidia’s core business model remains robust, yet the market is currently pricing in risks rather than the company’s growth story. In times like these, the wisest approach is to avoid leverage and—instead of attempting to call the "bottom"—wait for prices to stabilize.
Do you believe this decline in Nvidia presents a long-term investment opportunity, or are we witnessing the deflation of an artificial intelligence bubble?
#Nvidia #Macro #TechStocks
#ShareWeekly #WCTCS9
Not investment advice.
repost-content-media
NVDA-13.84%
  • 2
  • 2
Bullish signals have been triggered; consider entering around the current price of 0.03950.
The target is 0.04366, with a stop-loss at 0.03600, offering a favorable risk-reward ratio.
DODOX is already up 15.99% in this move, and momentum continues. Consider riding the trend.
Risk warning: Contract trading carries extremely high risk. Please strictly control your position size and manage your funds carefully. (The above is solely a personal opinion and does not constitute investment advice. Please assess market risks rationally.)
post-image
DODOX
DODOXDODOX
Pump.Fun
MC:$2.22KHolders:87
32.76%
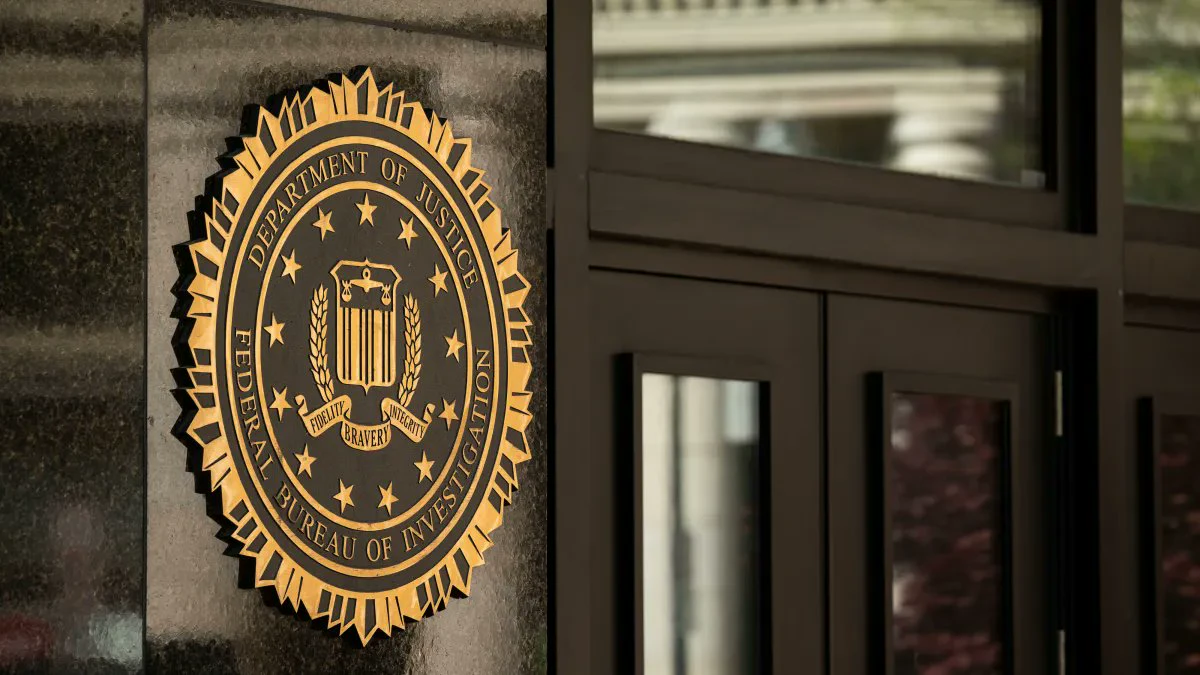
The FBI’s own criminal database may have been hacked—talk about irony!
The NCIC, used by law enforcement agencies across the U.S., has also reportedly been breached. It contains fugitives, missing persons, criminal records, and stolen property—if that data leaked, who would take responsibility?
Both AP and NBC got word from people familiar with the matter that the FBI is investigating, but on Saturday the FBI flat-out declined to comment, not even bothering to give the public a “we’re investigating”
Axios said the scope remains unclear and there’s no proof the attackers took the entire databas
post-image
3372.56@开户以来, that's a huge loss
Watching $BARD hold these moving averages so calmly, honestly, I'm getting a little impatient. It clearly has strong momentum, so why does it feel like it's just pacing in place instead of actually speeding up? Is everyone waiting for a specific signal, or are we just admiring the view here? TP: 0.100SL: 0.092
Market dynamics:
$VVV : Current price 25.152 - 24-hour gain: +20.49%
$ETH : Current price 1,682.61 - 24-hour gain: +3.96%
post-image
BARD-1.24%
VVV+0.37%
  • 1
Examples of things bought after waking up at 3 a.m.:
😅😅😅
post-image
BTC has reclaimed 60,000. Yesterday, the price briefly wicked down to around 55,100 before launching a strong rebound.

It is worth noting that the first rebound lacked sufficient volume, but as the move progressed, clear volume increases gradually appeared on the 1H and 4H timeframes. This makes me think this rebound is not entirely unsupported, and there is still room to move higher in the short term.

I currently lean toward the view that from the end of this month to early next year, BTC may enter a broad daily-chart consolidation phase, possibly with an increasingly widening range. The sw
post-image
ETH-1.26%
BTC-0.67%
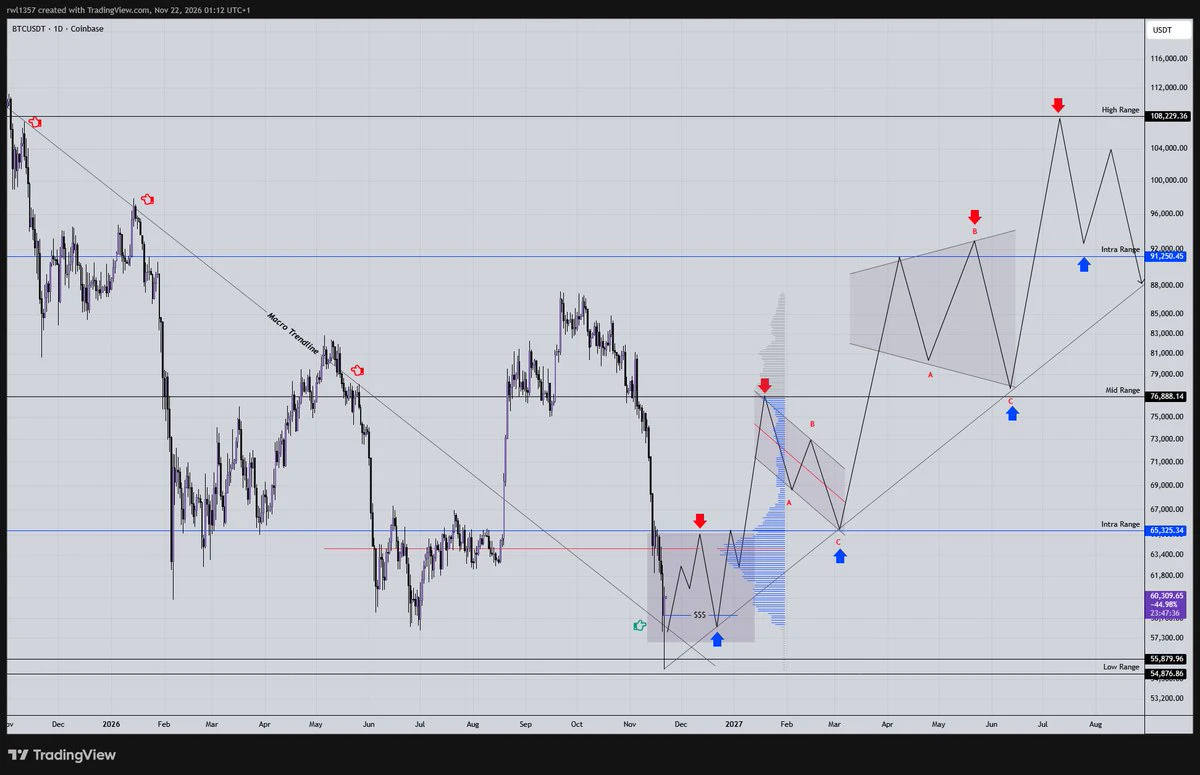
This is what I see for the bullish case in crypto going into 2027. Right now on the lower timeframe we are looking at the 64-65k area which is acting as the LTF trend, meaning that below it selling pressure will persist, and above it buying pressure will kick in. At first expect a pullback from that area before price breaks above the trend and begins the expansion move to fill the gap left behind by the recent crash, up to 76-78k which will be our mid term trend reversal, once we flip it as well, we can enter a more aggressive and sustainable breakout higher, pushing Bitcoin towards the ATH ag
post-image
BTC-0.67%
🌞 Good morning, another beautiful day!
Rainbow goes into the basket 🌈
post-image
Morning market update
live-cover
LIVE1,575
ETH-1.26%
BTC-0.67%
SOL-0.77%
#SOL #WCTCS9 #ShareWeekly
Worked for 1m 24s

SOLANA AT 70 USDT: IS THIS A GENERATIONAL BUYING ZONE OR A WARNING THAT THE DOWNTREND IS NOT OVER?

Solana is at an important decision point. At 70 USDT, traders must decide whether the deep correction offers a long-term opportunity or whether another wave of selling is ahead. Solana has a strong ecosystem and institutional interest, but a lower price is not automatically a safe entry. The analysis must combine market structure, network activity, liquidity, ETF flows, Bitcoin direction, and risk management.

CURRENT MARKET SNAPSHOT

The latest marke
  • 1
$ENSO 's washout phase is basically over; the real uptrend comes next🚀 Go long at the current price, don't hesitate🔥
Targets in three tiers: First target: 0.52Second target: 0.55Third target: 0.6 to 1 range
Set the stop-loss at 0.437; if it breaks, admit you're wrong and exit.
Also watch the moves of $SKYAI and $BTW in tandem. $SKYAI has already climbed 34%, $ENSO is up nearly 20%, and $BTW has gained 8%. Sentiment across the sector is recovering, so keep a close eye on your positions🙈💸
Risk warning: The above is only my personal opinion and does not constitute investment advice. Cont
post-image
ENSO-3.03%
SKYAI-7.58%
BTW-7.42%
Load More

Join 40 M users in our growing community

⚡️ Join 40 M users in the crypto craze discussion

💬 Engage with your favorite top creators

👍 See what interests you

Trending Topics

BTCBreaksBelow60K

2.1M Views30.1K Discussing

BTC fell below $60,000 on November 20 for the first time since July, alongside a tech stock selloff and broader pressure on risk assets. Will $60K become resistance, or can BTC quickly reclaim it? What price or volume signals would convince you that selling pressure is easing?

GateDirectIPOPhase3ANTAllocates92100Shares

802.9K Views4.9K Discussing

NvidiaDropsNearly14Percent

336.1K Views7.6K Discussing

View More