
Square
Following
Hot
News
Profile
Share your thoughts
placeholder
Article
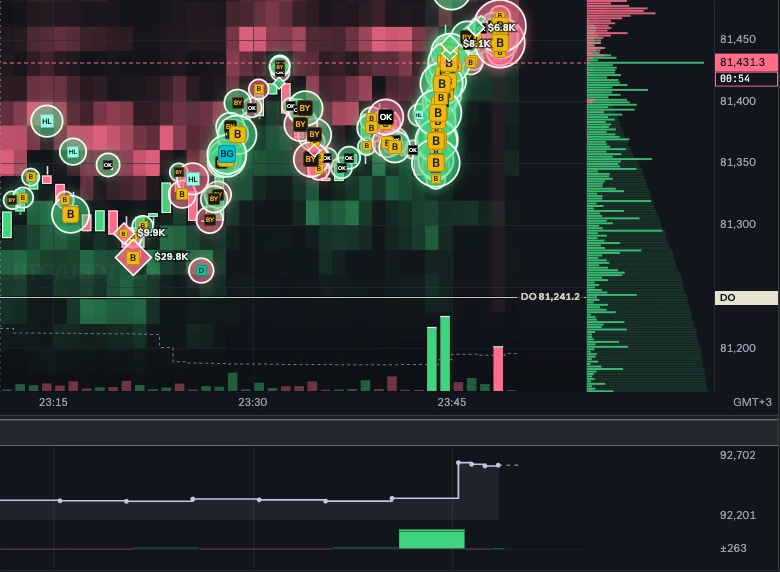
Is breaking below the previous low tonight still far off?
Is ETH at 22–2100 still far off?
I've been saying this since the start of the month
But BTC is holding firm at 80800
If it breaks below, ETH will accelerate straight down
ETH-2.23%
BTC-0.51%
Long positions entered, waiting for a massive surge
​#晒出我的持仓收益
post-image
Trenches
CNPY
C
bade
b
CNPY
0xc6...ddd2
Market Cap
$.
Change
.
24h Vol
$.
Holders
.
AGT
A
bade
b
AGT
0x5d...e274
Market Cap
$.
Change
.
24h Vol
$.
Holders
.
TSI
T
bade
b
TSI
0xa8...1c1e
Market Cap
$.
Change
.
24h Vol
$.
Holders
.
hi
h
bade
b
hi
0x8a...a7f7
Market Cap
$.
Change
.
24h Vol
$.
Holders
.
Gato
G
bade
b
Gato
55A3...pump
Market Cap
$.
Change
.
24h Vol
$.
Holders
.
btc market update
live-cover
LIVE26
Eyes on war stocks and war ETFs which had a pretty good week. 90% chance it's just defensive hedging (what I did) but sometimes there's something happening not in the news that gets reflected in the charts and only makes sense later.
post-image
  • 7
  • 1
$AGT I lost 17 points on this trade, cutting my losses at 0.0712. Looking back now, 0.0683 is starting to look interesting.
Yesterday before dawn, BTC was moving sideways around 68,000, and I thought altcoins were about to move. I saw $AGT ’s 24-hour trading volume hit 400 million, with the price climbing from a low of 0.0622 to 0.1151—nearly doubling. I figured that kind of volume couldn’t be fake, so I chased it around 0.088. But as soon as I bought, it started drifting down. It bounced to 0.092 at one point, but I didn’t sell, thinking that with volume this high it had to make another run.
BTC-0.51%
#比特币短线站上8.2万美元 Sideways action after 1 a.m. is the most honest: what you think is “no market movement” is both bulls and bears waiting for the other side to blink first, while the exchange collects fees from both sides.
Who’s most likely to get wrecked today
BTC at 81,166, down just 0.056% in 24h, but whipped back and forth between 82,295 → 80,819 twice.
ETH is hurting the most: 2,371, down 1.32% in 24h. It just hit the ceiling at 2,430 yesterday, and gave up over a percentage point in five hours.
SOL at 102.41, stuck on the roller coaster between 101.25–104.79; BNB at 712.82, down 0.08% in 24
post-image
BTC-0.51%
ETH-2.22%
SOL-1.69%
BNB-0.60%
BTC and ETH Prices Stabilize as Buyers Return Near Recent Lows
live-cover
LIVE342
#美国9月PPI大超预期 The “data vacuum” is approaching. How will gold and silver prices move?
Recently, gold and silver prices rebounded somewhat after a downturn, showing signs of stabilizing. Wang Weimang, an analyst at Zhonghui Futures, told Futures Daily that the rebound in gold and silver prices was driven by interest rates and safe-haven demand.
“The rapid decline in long-term U.S. Treasury yields was the direct driver of the rebound in gold and silver prices,” Wang Weimang said. Against the backdrop of U.S. September inflation data exceeding expectations, AI technology stocks faced a global sell
post-image
XAU-0.12%
XAG-0.18%
#WCTCS9 #每周来晒 Gold poised for a breakout, silver under pressure after breaking down, and oil taking aim at $100! Which will break the deadlock first?
On Friday (October 16), gold, silver, and oil showed clearly divergent technical trends for the week: gold continued to consolidate near support in the “green zone” between $4,110 and $4,170, silver remained under bearish pressure after breaking below a key level, while oil extended its climb above $95, forming a new bullish advance.
Gold holds its support range Gold is still trading near the $4,110–$4,170 support area. Price action suggests that
post-image
XAU-0.12%
XAG-0.18%
$ZEC is trading at 1,085.98 USDT, down 4.24% in 24 hours, but 1-hour trading participation is only 0.07x. This seems somewhat unusual because the price has moved, but volume has not clearly followed. The current price is already close to the 1-hour support level at 1,076.86, while the 1-hour resistance level at 1,163.24 still lies ahead.
I’d rather wait for the price to stop making new lows than treat oversold conditions as a rebound signal. Oversold simply means the price has fallen a lot, but it doesn’t mean a bottom is in. Rebound demand has increased, but if the price breaks below 1,076.86
post-image
ZEC-4.80%
Lets Go Guys, This is a great meme token for dog lovers. $OnBoardInu 🤩
@harrypauldavies @sadcrissy @lonemikol
MEME-5.49%
TOKEN-2.10%
#沃什IMF讲话 #每周来晒 The core of Warsh’s IMF remarks wasn’t that he was dovish or hawkish, but that he refused to signal either direction. Markets interpreted them in the short term as meaning “the probability of an October rate hike has fallen,” but the real impact is that the Fed’s rate path will be harder to predict going forward.
To be clear about the context: this was a fireside chat at the IMF/World Bank annual meetings in Bangkok on October 16. Warsh repeatedly emphasized that he wouldn’t prejudge rate decisions or say in advance what the Fed would do at the remaining meetings this year. The
post-image
SPX-0.58%
BTC-0.51%
CRWV-11.90%
https://www.gate.com/zh/profile/缠浪解盘
‼ Profiting every day 🔥4gt’s half-price offer ends tonight; high win rate + precise calls, with over 600 subscribers 🎉Futures/spot signals updated 👇Tap to subscribe☝️
🔥Shorted SanDisk at 1880 / shorted zec at 1580, turning a profit 📉Last week, shorted at 87000/2735 and rode the drop to 80500/2405, making gains across three positions 📉Then went long at 81000/2420 to 84300/2575 for another gain 📈This week, shorted at 84000/2570 down to 79300/2355, making profits again
#GateWCTCS9全球交易赛
SNDK-3.29%
SNDKG-3.18%
ZEC-4.81%
#TeslaRoadsterSparksMemeCoinSurge #TeslaRoadsterSparksMemeCoinSurge 🚀⚡
When Tesla Creates a Buzz, Meme Coins Know How to Steal the Spotlight!
The Tesla Roadster has once again become a fascinating talking point for the market, showing how the combination of technology, innovation, and internet culture can influence investor sentiment. Whenever Tesla-related excitement starts spreading across social media, the attention can quickly extend beyond electric vehicles and reach the fast-moving world of meme coins.
But here is the interesting part: attention can trigger a rally, but sustained demand
post-image
TSLAG-0.83%
MEME-5.49%
BTC-0.51%
  • 2
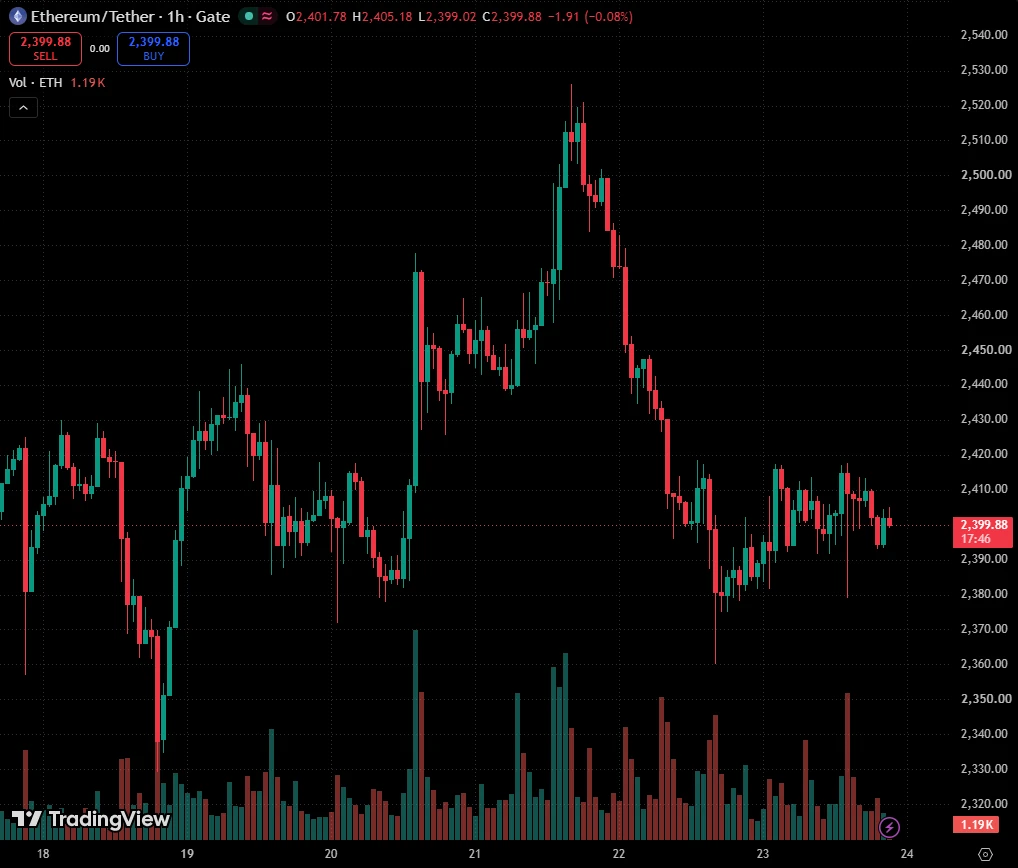
$ETH - Update
No demand set in yet, so just looking for new lows now.
post-image
ETH-2.23%
  • 9
  • 2
Captured $UAI
’s rebound from oversold intraday lows—a clean mean-reversion trade. 🔥 This quick trade gained 83%. 📈 📈 Profit: $253. Closely monitor the charts for $GTC and $BR .
post-image
BR+12.47%
$ZEC is trading at 1,094.52 USDT, down 1.86% over 24 hours, but its 1-hour trading volume is only 0.25x. This feels somewhat unusual: the price has moved, but volume has not noticeably followed. The current price is already close to the 1-hour support level at 1,076.86, while the 1-hour resistance level at 1,163.24 remains ahead.
My view is that although ZEC has entered oversold territory, it is too early to call a bottom. Demand for a rebound has increased, but the structure still looks weak. If the price can hold above 1,076.86 and continue to recover, that would be a positive signal. But if
post-image
ZEC-4.80%
$BTC
There is a lot of panic across the timeline, and I understand why. We are approaching our first daily close below the current range lows since September, alongside the first daily close below the D1 50 MA since August.
However, this does not invalidate the higher-timeframe bullish structure. It simply opens up the possibility that price is rotating back into the previous range.
If you have managed risk effectively, taken profits along the way, and avoided chasing the highs, this pullback could present some excellent opportunities.
post-image
BTC-0.51%
We're so back it's so over
$TROLL
post-image
TROLL-6.84%
10.19 $BTC Market View
The current market logic is not about expecting an immediate one-way surge; rather, the fact that the price “won’t fall” is itself a sign of strength. Bearish data has failed to push it below 80,000, institutions and whales are quietly accumulating, on-chain supply is tightly held, and technical indicators are setting up for a reversal from low levels—together, these factors are building a bottom structure with a favorable risk-reward ratio.
As long as the price holds above the 80,700–81,100 zone and breaks above the Bollinger midline at 81,765 with increased volume, th
post-image
BTC-0.51%
ETH-2.23%
Load More

Join 40 M users in our growing community

⚡️ Join 40 M users in the crypto craze discussion

💬 Engage with your favorite top creators

👍 See what interests you

Trending Topics

USSeptemberPPIBeatsExpectations

91.35k Views1.94k Discussing

US September PPI came in at 6.3% YoY, well above the 5.3% market expectation, pointing to renewed producer-side inflation pressure. Weekly jobless claims were 199K, broadly in line with forecasts. Could hotter inflation further reduce room for rate cuts, and what does it mean for $BTC, US stocks, and gold?

GateWCTCS9GlobalTradingCompetition

37.87k Views6.82k Discussing

GateBTCAndETHFuturesVolumeRanksTop3

53.8k Views1.93k Discussing

View More