Share your thoughts
placeholder
Article
$ZEC
Who is holding it?
There is no denying that
the crypto world is creating get-rich-quick legends again, but it definitely won't be you!
post-image
ZEC+21.43%
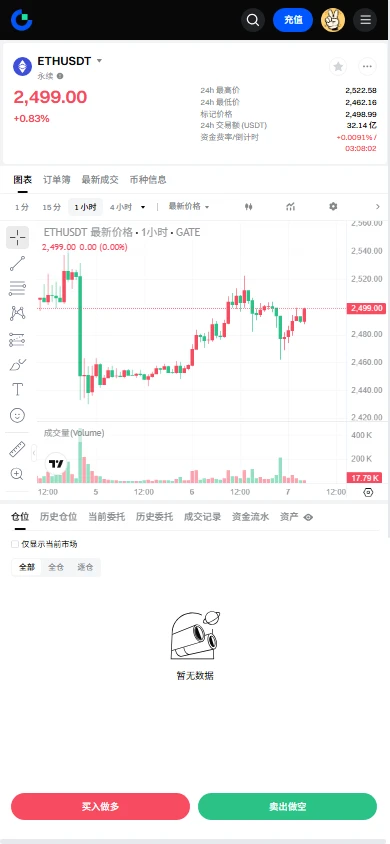
$ETH Signal】1H triangle convergence + 4H bullish buildup, targeting the breakout
$ETH 1H Bollinger Bands have narrowed to 2478-2514, marking a short-term decision point. The 4H MACD histogram is contracting, but bullish momentum remains. Order book depth imbalance: -7.24%, with aggressive buyers holding a slight edge. Funding rate: 0.0044%, with no signs of overheating. OI is stable, and holders remain calm.
🎯Direction: Long
⚡Entry/Limit order: 2488.4424 - 2494.7300
🛑Stop-loss: 2469.7827
🚀Target 1: 2532.1509
🚀Target 2: 2550.8614
🛡️Trade management:
- Execution strategy: After reaching Ta
post-image
ETH+1.42%
I didn’t do a thing—just went to the restroom, and when I came back, the candlestick chart had already done the work for me. 😂
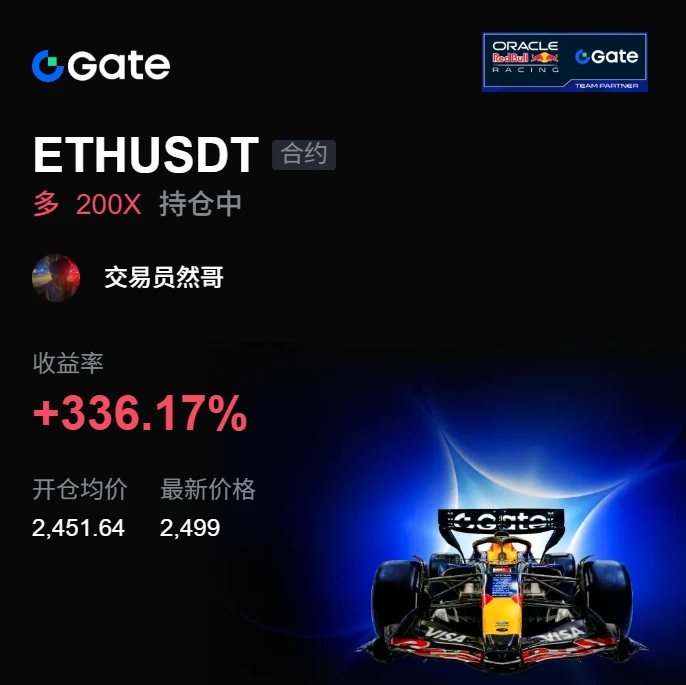
When I opened the market this morning, $ETH /ETH had just started moving, and volume suddenly surged. Funds were quietly flowing in, buying pressure kept getting stronger with every sell-off, and the pullbacks showed no hesitation at all. I issued a long signal at 2451.64 and entered directly.
Looking again now, the current price is 2498.48, +331.7%. Those already on board must be waking up laughing—this move was purely a gift to the early risers. 😌
Don’t get greedy w
post-image
ETH+1.42%
SNDK+1.07%
XRP+0.54%
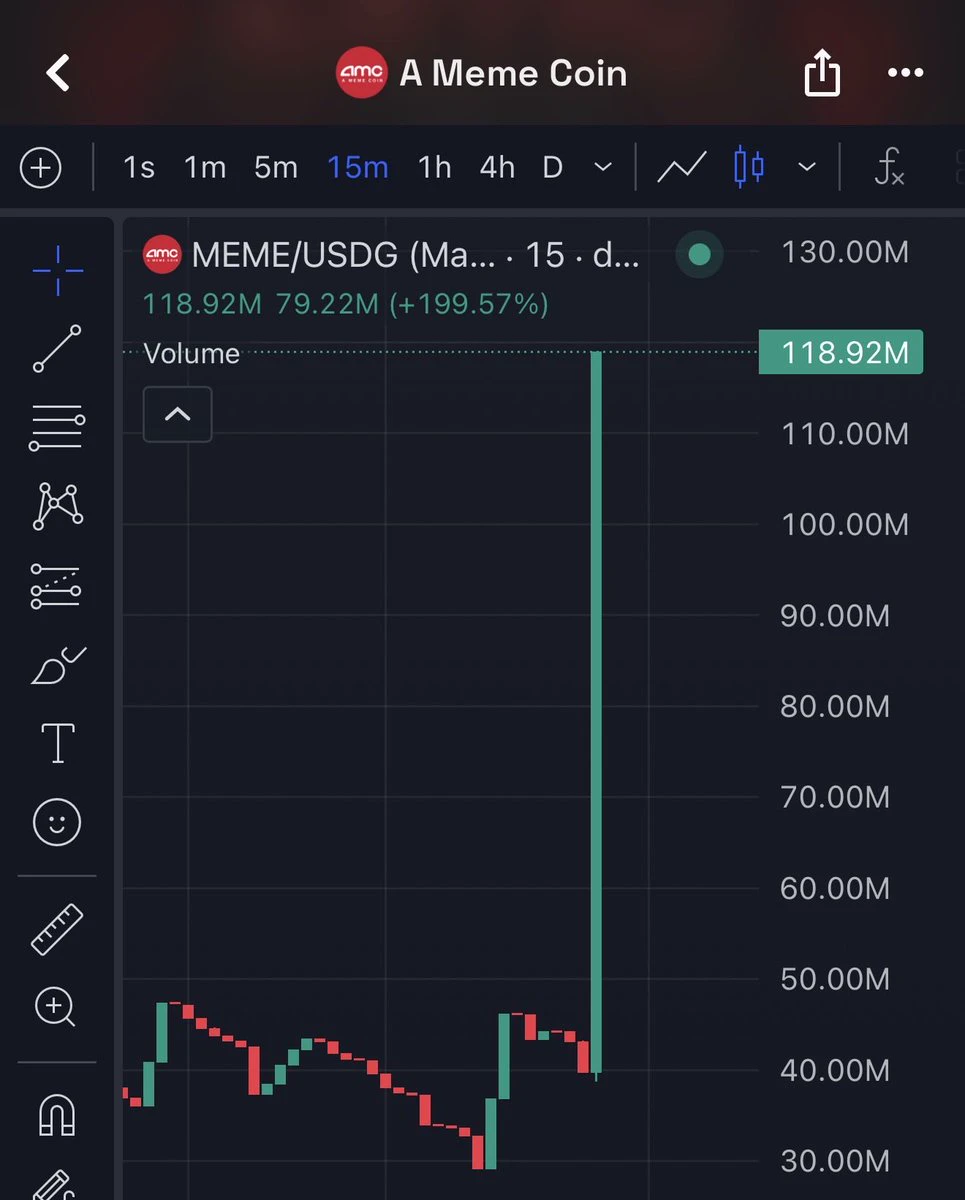
YO WTF JUST HAPPENED???
post-image
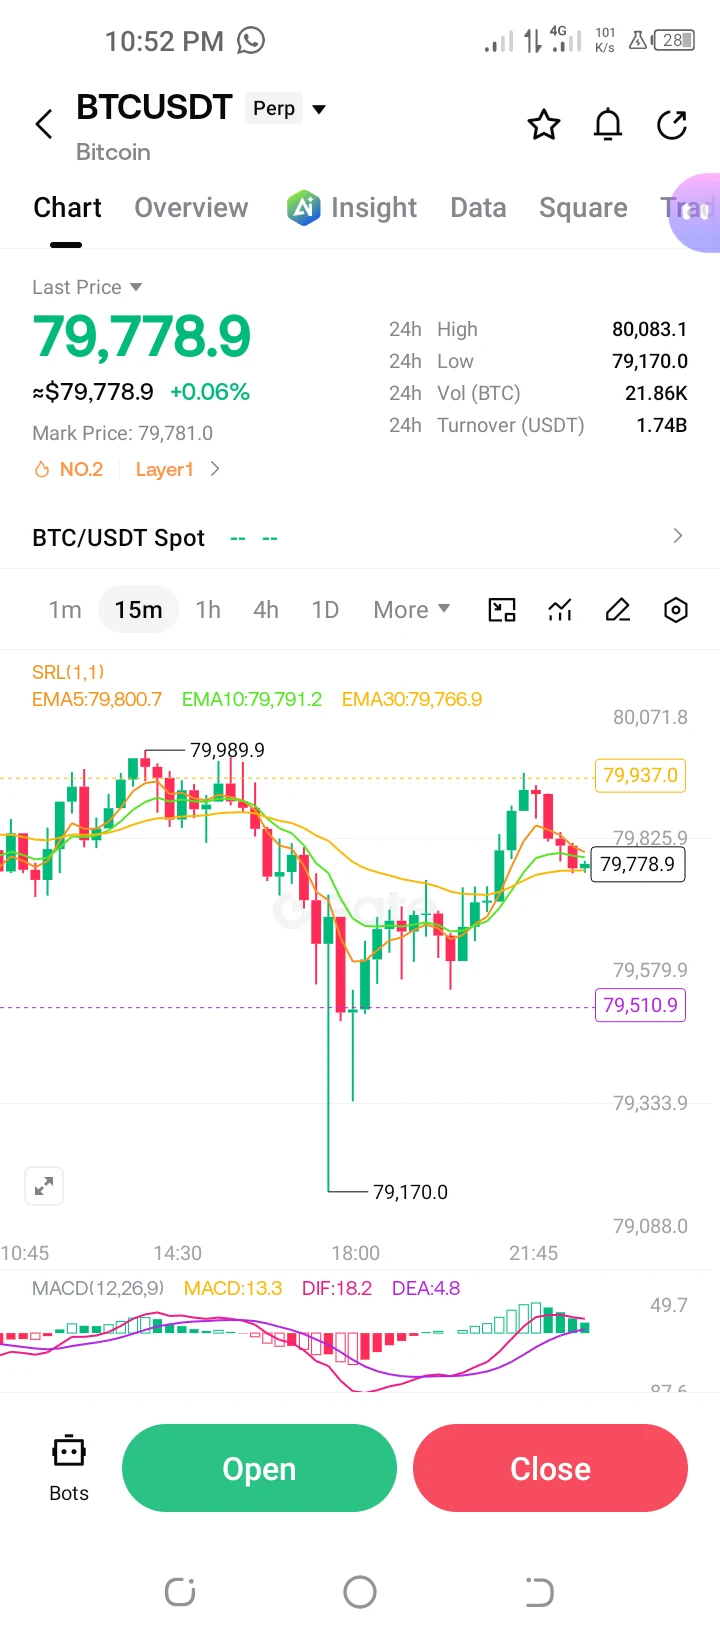
$BTC /USDT Perp – "V-Shape Recovery – Long"**
**Trading Plan Long $BTC
Entry: 79780
SL: 79500
TP1: 79937
TP2: 80083
Explanation: Strong recovery from the 79,170 low with a bullish MACD (13.3), targeting the 79,937 yellow line and the 80,083 high.
post-image
BTC+0.21%
  • 4
  • 2
$$METIS The data looks off: the 24-hour trading volume is only 16.3M, yet the price has been pushed up 21.61%? In a sideways market, this kind of price-volume divergence is a trap nine times out of ten.
First, look at the chart: the current price is 3.399, trading just below the 24-hour high of 3.463. The swing from the low of 2.792 to the high of 3.463 exceeds 24%, yet the trading volume is even lower than that of many third-tier altcoins. Put bluntly, this was not driven up by real money from major players; it is the product of short liquidations and dried-up liquidity—the moment sell order
METIS+23.81%
How is this a rebound? This is CPR for my account, isn’t it?
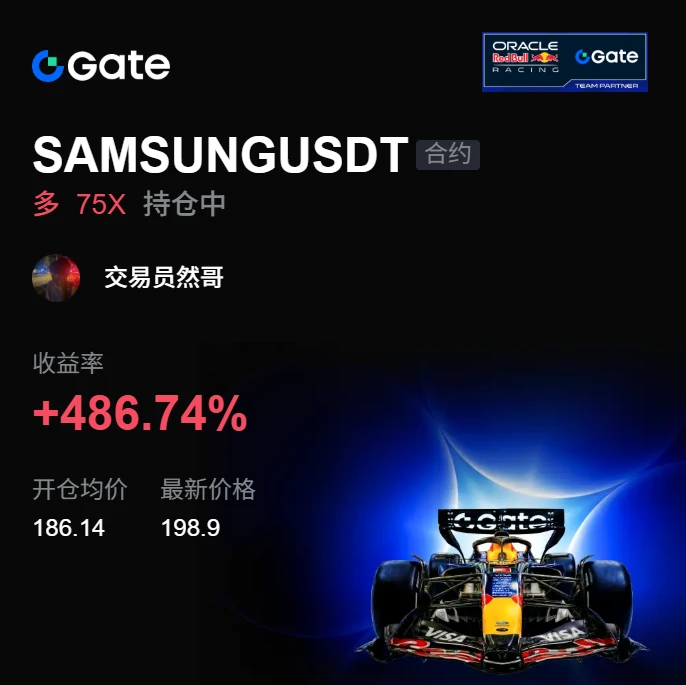
A few days ago, in the early hours, when $SAMSUNG was bottoming, I didn’t rush to buy the dip. I waited until the pullback held the key level around 186.14 and buying pressure quietly started strengthening before cautiously entering with a small position. The thinking was simple: set a stop-loss, admit it if I’m wrong, and hold on if I’m right.
When I opened the chart this morning, 198.96 had already been reached, and the floating profit had jumped directly to +489.03%. Catching this move wasn’t about being quick—it was about honest
post-image
SAMSUNG+0.05%
BNB-2.29%
SNDK+1.07%
#RedBullTradingTourSeason6
🏎️ 2026 Red Bull Trading Tour · The sixth edition is now heating up!
The maximum 60,000 GT dynamic prize pool has been upgraded again, with F1 viewing grand prizes, official Red Bull car models, and more waiting for you to unlock!
Sign up now: https://www.gate.com/competition/f1rb/s11
🎁 Livestream perks continue tonight at 20:00 (UTC+8)
Golden Bull sculptures × 2|100 USDT position experience vouchers × 3|Red packet rain keeps falling
🔥 Tonight's key topics:
🔹 60,000 GT dynamic prize pool: A comprehensive breakdown of this edition's reward mechanism—how can you e
post-image
GT-1.72%
#Gate事件合约晒单挑战
#XRP Ledger Shows Bigger Value Despite Fewer Active Accounts
Q2 ACTIVITY SHIFT
The latest XRP Ledger data shows an interesting divergence in network activity. Daily active accounts fell 24% year over year to 16,600, but average daily order-book volume increased 79% to 3.57 million XRP.
That combination matters. Fewer active accounts are participating, yet the amount being traded through the order book has increased significantly. This suggests that the activity that remains is becoming more concentrated around larger transactions rather than being driven purely by a growing num
post-image
XRP+0.54%
RLUSD0.00%
#BTC Morgan Stanley is quietly buying Bitcoin, while market makers are opening short positions—which side are you on?
On one side, traditional financial giants are adding to their Bitcoin holdings with real money; on the other, crypto market makers are aggressively opening short positions on-chain. The same market, two completely opposite bets.
On September 5, these two pieces of news emerged almost simultaneously, once again putting the question of whether institutions are actually bullish in the spotlight.
① Morgan Stanley: 355 BTC bought in 4 days According to on-chain monitoring, Morgan St
post-image
BTC+0.21%
ETH+1.36%
HYPE+3.06%
ASST+1.21%
BMNR-5.48%
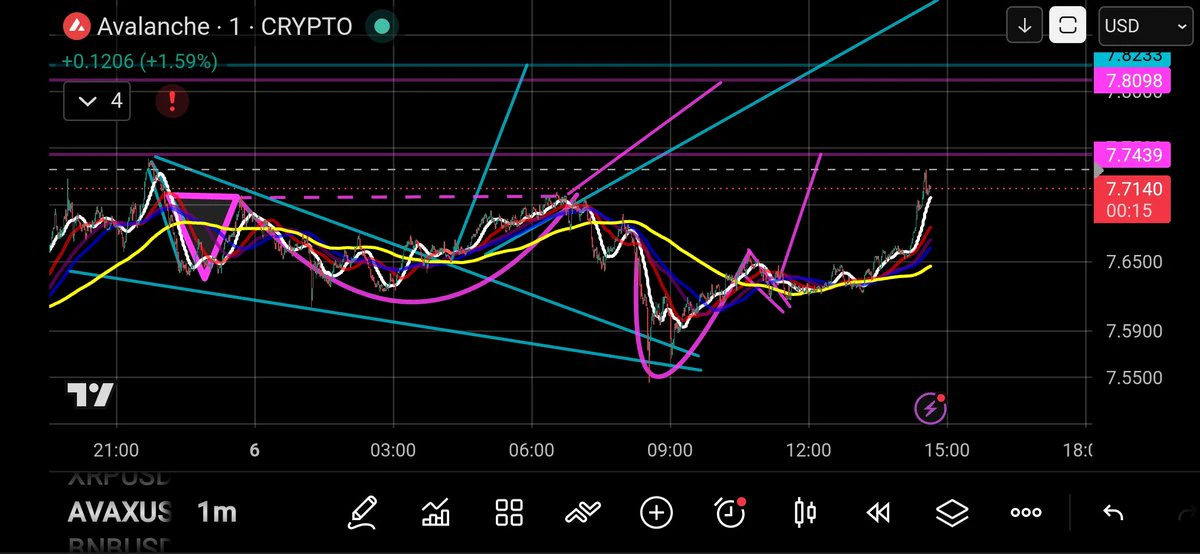
$AVAX With A Strong Bounce Off The Bullish Restest Of The Blue Falling Wedge 🚀
post-image
AVAX+3.09%
( new streamer) market overview
live-cover
LIVE52
MARKET prediction
live-cover
LIVE30
#Gate事件合约晒单挑战
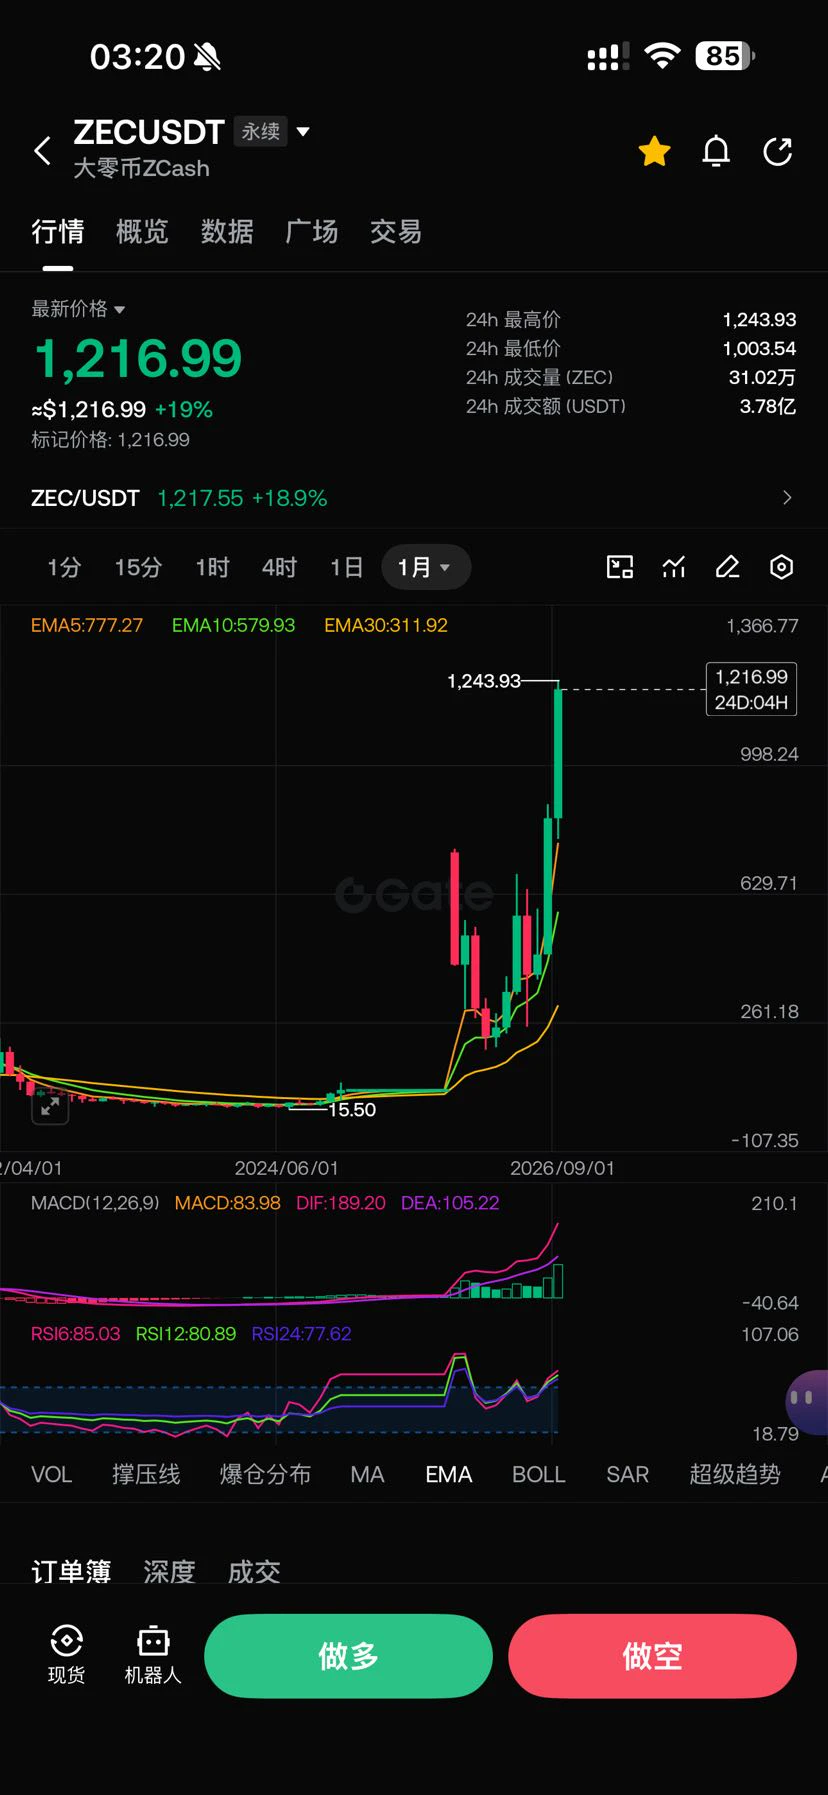
Zcash has moved ahead of Dogecoin to become the tenth-largest cryptocurrency by market capitalization. Latest data from CoinMarketCap and market reports on September 6, 2026 show ZEC’s market value at approximately 19.64 billion dollars, placing it above DOGE.
ZEC has traded in a strong upward range in recent sessions, with prices moving through the 1,000 to 1,170 dollar zone on elevated volume. Circulating supply sits near 16.8 million coins against a maximum of 21 million. This relatively limited float has magnified the effect of recent capital inflows. Over the past thirty da
post-image
ZEC+21.43%
DOGE-0.71%
This kind of return makes me both thrilled and uneasy, worried the market will come to its senses tomorrow and blacklist me.

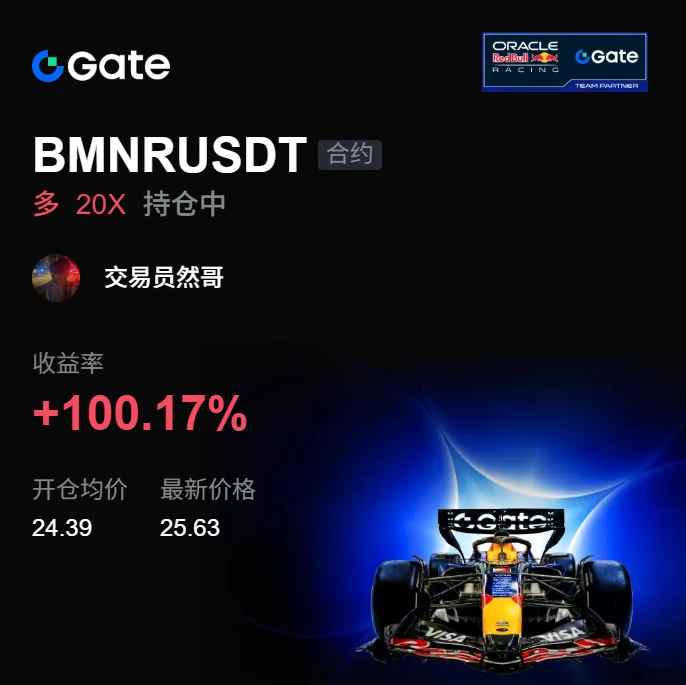
When I opened the chart this morning, $BMNR was repeatedly testing around 24.39. The most agonizing part is before the move starts, but as long as the bottom consolidation holds and funds quietly flow back in, I know the direction is most likely up. I entered in batches without chasing.

When I checked the chart after lunch, the price had already climbed to 25.62, taking my return straight to +100.17%. This level feels almost too good to be true, but looking back at
post-image
BMNR+2.42%
SNDK+1.07%
XRP+0.54%
Everyone’s chasing TAO’s green candles, but the 4h tape is screaming something they refuse to hear.

$TAO /USDT - SHORT

Trade Plan:
Entry: 267.0 – 269.4
SL: 283.5
TP1: 256.7
TP2: 249.1
TP3: 237.6

Why this setup?
- RSI on the 15m is overheated at 69.6—buyers are exhausted right as price tags the 268.2 reference.
- ATR (1h: 4.89) shows volatility is compressing; a snap back toward 256.7 (TP1) is the path of least resistance.
- 1D trend is range-bound, so fading the top of the range (269.4) with a 77.4 confidence short isn’t a gamble—it’s statistical edge.

Debate:
If TAO rejects 269 an
TAO+15.07%
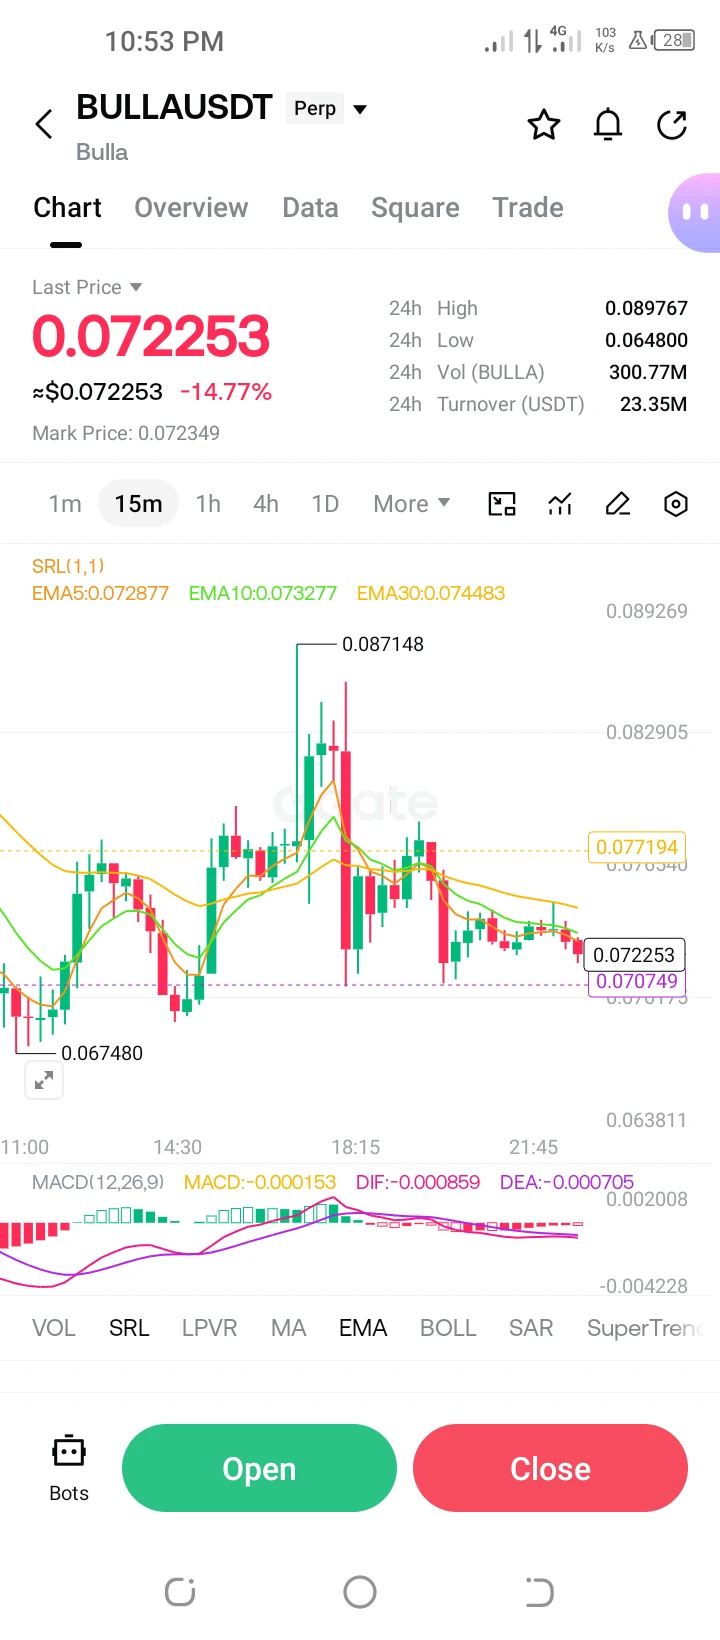
$BULLA /USDT Perp – "Breakdown Below EMAs – Short"**
**Trading Plan Short $BULLA
Entry: 0.0722
SL: 0.0745
TP1: 0.0707
TP2: 0.0674
Explanation: Breakdown below the EMA5 (0.0728) with negative MACD, targeting the 0.0707 purple support and the 0.0674 low.
post-image
BULLA-15.19%
  • 3
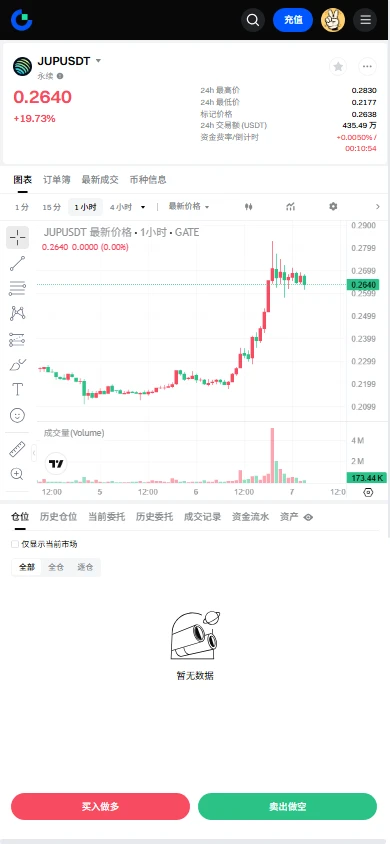
$JUP Long Signal】1H volume-backed surge, 4H bullish momentum continues
$JUP Currently around 0.2682, after consolidating at high levels on the short-term 1H timeframe, it is strengthening again. The 4H MACD bullish histogram is expanding, the upper Bollinger Band is opening up, and volume is providing synchronized support, clearly indicating that funds are actively following in. Order-book buying is slightly weak, but spot buying continues to provide support, with no widespread order cancellations. RSI on both 1H and 4H is at high levels, showing extremely strong short-term momentum, with no
post-image
JUP+19.84%
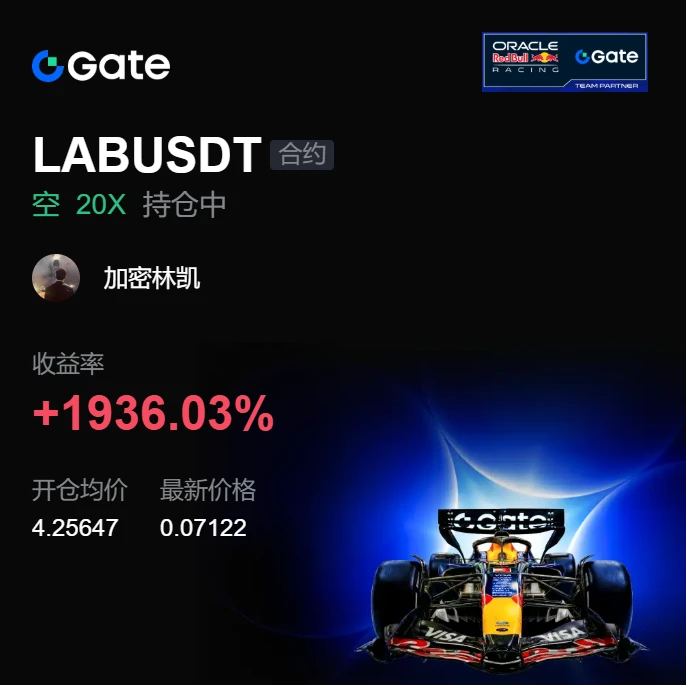
No trades, no analysis, just sheer luck—this track record is embarrassing to even talk about. Too bad the market never makes sense; when it really wants to drop, it doesn't care whether anyone is prepared.
At the time, I thought this move was completely done for, so I casually placed a small short at 4.25647, just to give my restless hands something to do. Who knew that right after I placed it, the market actually started moving down, grinding all the way to 0.07118. The unrealized gain is now +1936.05%—it feels amazing, but honestly, I didn't contribute much brainpower. The market was simply
post-image
BTC+0.21%
BNB-2.29%
#ZEC How should we view ZEC after it broke above $1,200?
First, the most compelling point in the bullish narrative: ZEC's all-time high was actually $5,941 in 2016—the current $1,193 is still about 80% below its ATH. Against the backdrop of continued ETF inflows, the market can fully tell the story that a ten-year high is only the beginning and that ZEC is returning to its ATH. ZEC's ETF assets under management have surpassed $400 million, while the SMA-200 near $440 provides strong trend support, and the daily structure remains healthy.
But in terms of momentum, the risk is accumulating rathe
post-image
ZEC+21.43%
Load More

Join 40 M users in our growing community

⚡️ Join 40 M users in the crypto craze discussion

💬 Engage with your favorite top creators

👍 See what interests you

View More