
Square
Following
Hot
News
Notifications
Profile
Share your thoughts
placeholder
Article
#70%OfAltcoinsFallBelow200DMA #ShareWeekly

Altcoin Market Structure Is Deteriorating: Is Capital Preparing for a Rotation or Leaving the Market Entirely?

The altcoin market is entering a critical phase, and the latest technical data deserves serious attention. According to CryptoQuant analyst Darkfost, approximately 70% of altcoins are now trading below their 200-day moving average. At the beginning of October, this figure was only around 10%. Such a dramatic shift in a relatively short period suggests that market weakness is spreading across the broader digital asset ecosystem rather than
BTC-0.67%
  • 2
  • 1
$KORU B I got in at the lowest price, didn’t I, you little Korean? 😏 I’ve posted about Koru and helped everyone get positioned—we’re already on a six-win streak
post-image
KORUB
KORUBSouth Korea Bull
Four.meme
MC:$3.67KHolders:1
0%
KORU+10.82%
Trenches
牛逼
牛
bade
b
牛逼
0x96...7777
Market Cap
$.
Change
.
24h Vol
$.
Holders
.
PIEVERSE
P
bade
b
PIEVERSE
0x0e...25a9
Market Cap
$.
Change
.
24h Vol
$.
Holders
.
STONK
S
bade
b
STONK
6GmA...UNgx
Market Cap
$.
Change
.
24h Vol
$.
Holders
.
BTC
B
bade
b
BTC
C5xp...pump
Market Cap
$.
Change
.
24h Vol
$.
Holders
.
ON
O
bade
b
ON
0x0e...1d48
Market Cap
$.
Change
.
24h Vol
$.
Holders
.
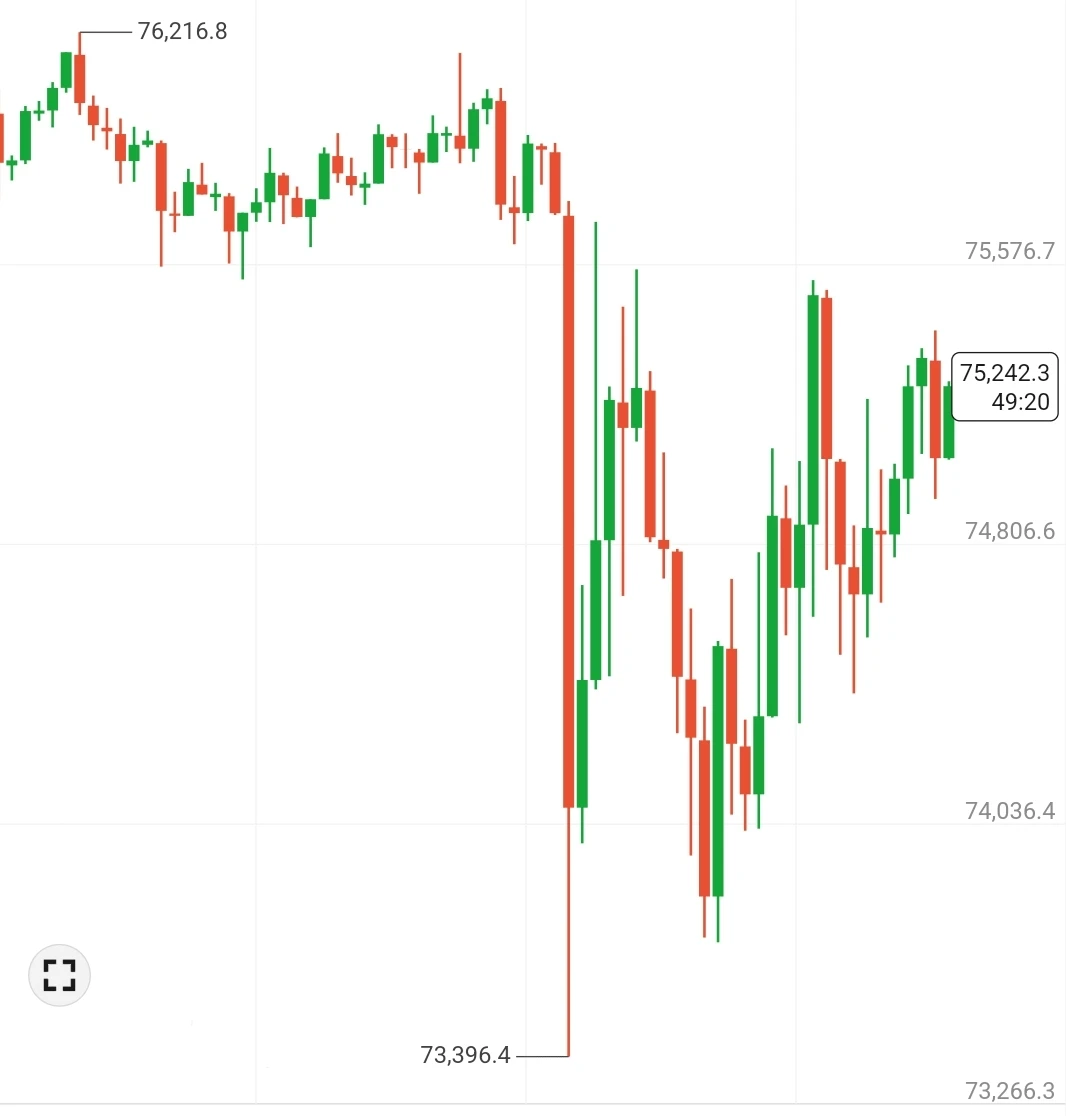
11.10 Bitcoin Market Analysis$BTC

Bitcoin formed a long lower wick on the one-hour chart, clearly testing low-level support. The bullish divergence has played out, and a rebound is now underway. Candles are gradually climbing along the Bollinger midline, with lows moving steadily higher as short-term bullish momentum builds. The price has remained below the upper Bollinger Band, suggesting the market is about to choose a direction. It is currently in an accumulation phase, building a base through consolidation; a breakout on increased volume would be more likely to open up room to the upside
post-image
BTC-0.65%
Where do you even find a girlfriend with a baby face, a tiny waist, and a figure straight out of a Korean webtoon?
Layout: Bitcoin, Ethereum, Dogecoin
live-cover
LIVE910
  • 1
#BTCETFOutflowsContinue #ShareWeekly
Introduction: Bitcoin ETFs Face Renewed Selling Pressure
Bitcoin exchange-traded funds (ETFs) have become one of the most important parts of the cryptocurrency market. Since their introduction, spot Bitcoin ETFs have provided traditional investors with a regulated way to gain exposure to Bitcoin without directly managing cryptocurrency wallets or private keys.
However, recent developments have raised concerns about institutional demand. During the week of November 2–6, 2026, US spot Bitcoin ETFs recorded approximately $1.28 billion in net outflows, markin
post-image
How can I go back to how things were before?
Talk about getting proven wrong.
Born in '98 and bought a Mercedes-Benz with their own money.
Mr. Liu saw it and angrily wanted to break up.
post-image
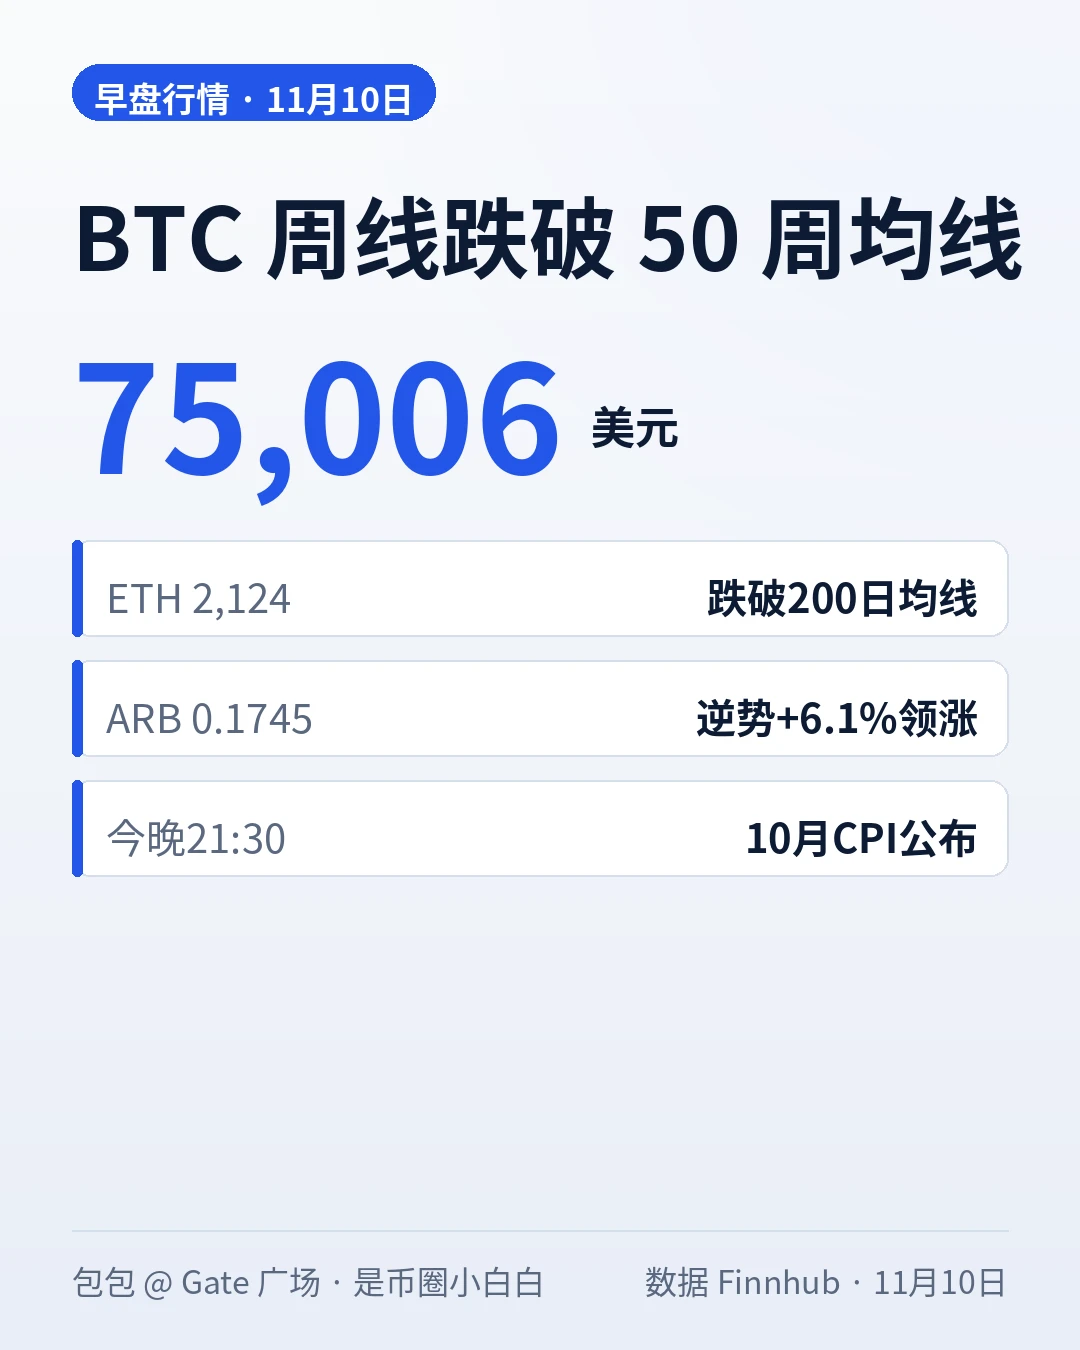
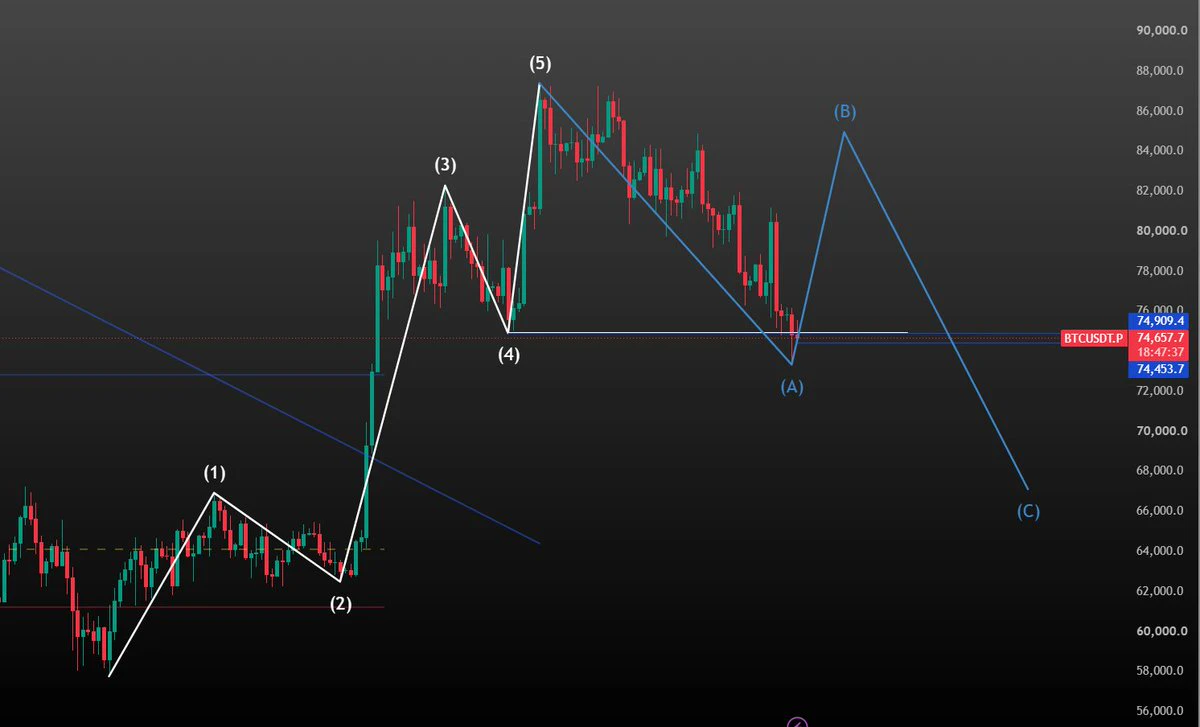
BTC closed the weekly candle at $74,968, falling below the 50-week moving average (around $75,200–$75,500) for the first time in two months. It failed to reclaim it on both days of the weekend and is still hovering around $75,006 this morning. #美国10月CPI即将公布

This breakdown is not an isolated signal: Glassnode data shows that whales on Hyperliquid have flipped from net long to net short. ETH is weaker, hitting a low of $2,083 last night and trading at $2,124 this morning, with the 200-day moving average (around $2,155) still hanging overhead. At yesterday’s close, only 5 of the top 100 coins w
post-image
BTC-0.67%
HYPE+0.33%
ETH-1.26%
ARB+1.17%
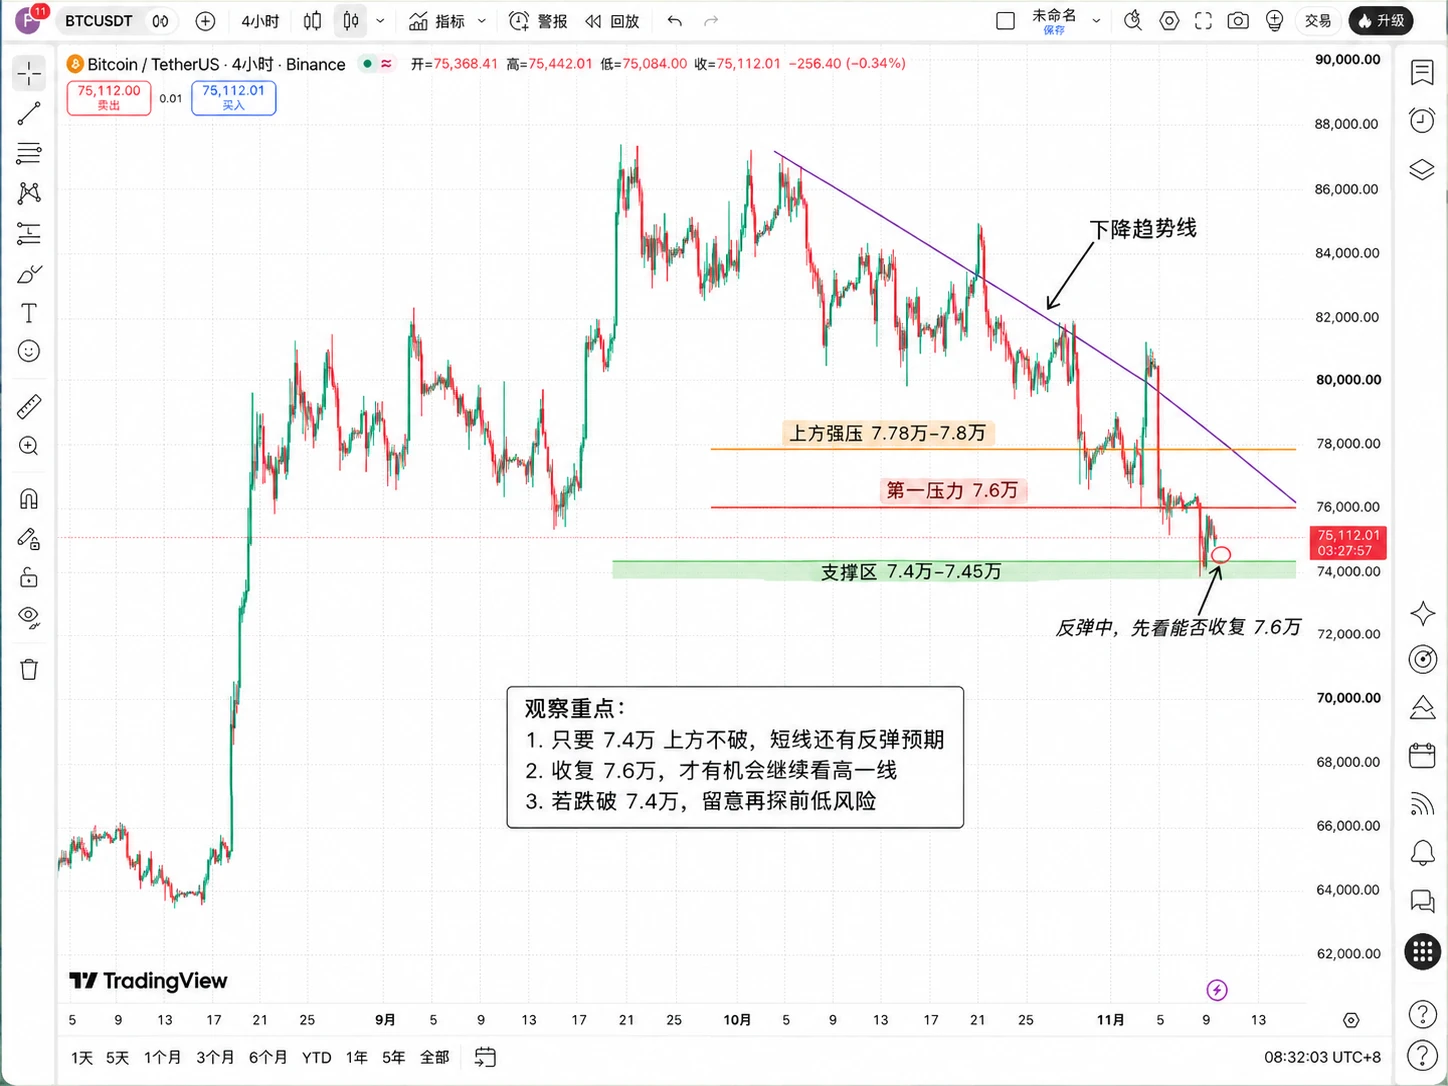
#美国10月CPI即将公布 CPI is coming tonight. Can $BTC use this as a chance to turn things around?

1. First, the news. U.S. October CPI will be released at 21:30 tonight, but because last year's government shutdown caused data to be missing, the official year-over-year increases for headline and core CPI will not be released as usual this time. The market can only focus more on month-over-month changes.
2. The market currently expects headline CPI to rise 0.3% month over month and core CPI 0.2%. What really matters this time is not whether inflation is high, but whether the results exceed expectatio
post-image
BTC-0.67%
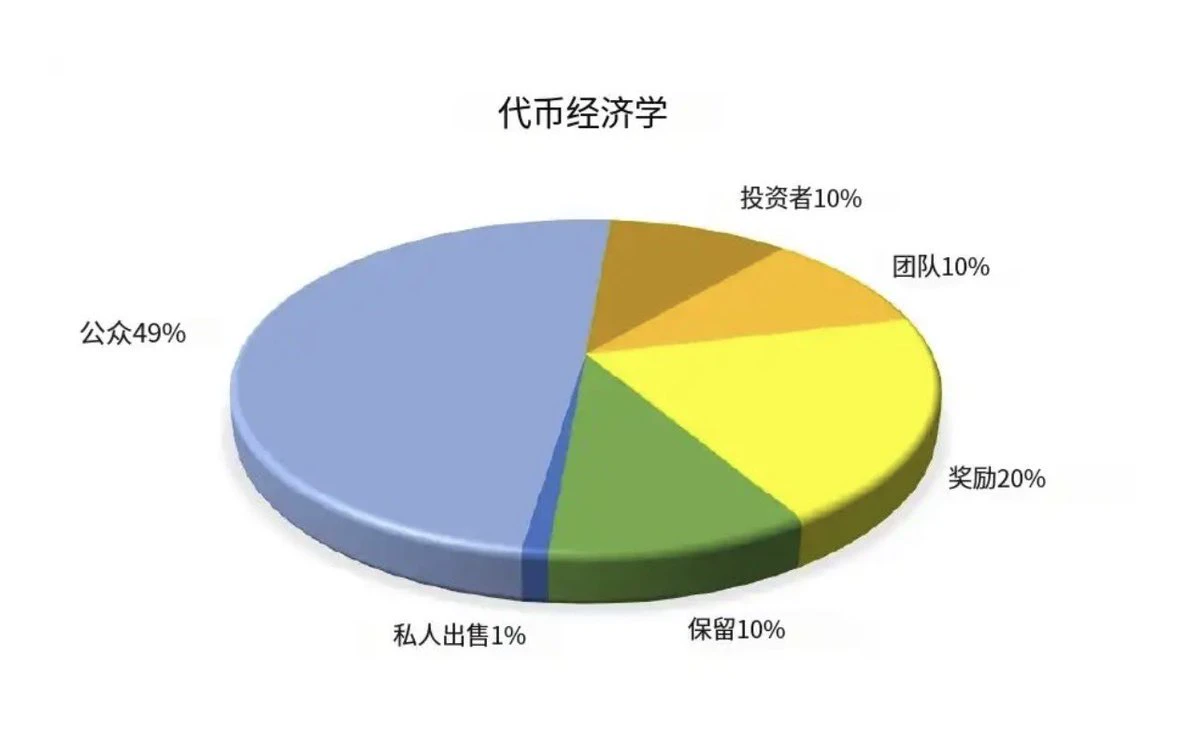
Tokenomics
is one of the most essential frameworks for evaluating a crypto project.
It determines who gets the tokens, when they get them,
how they are released, what they are used for, and how value flows back.
What retail investors most often overlook is treating Tokenomics
as just “numbers in the white paper.”
As a result, they get burned by token unlocks and token distribution structures.

1. Allocation (the most important part of the token distribution structure)
Typical examples of poor allocation:
The team + advisors + VCs hold more than 40–50% combined.
The community and airdrops accou
post-image
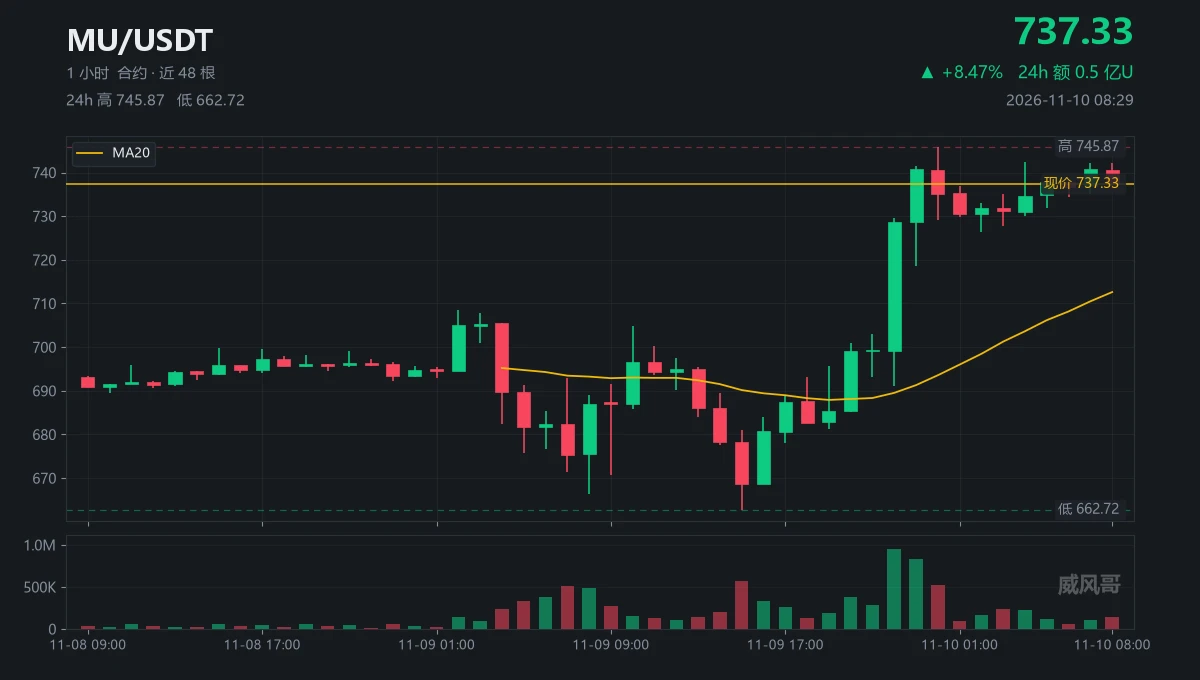
Up 8.5 points.
$MU Now at 737.33.
Eight hours, and it hasn’t moved forward another step.
The 22:00 candle traded 945k lots, 4.8 times the average volume of 196k.
At 23:00, another 827k lots came in, pushing the price up to 740.73.
If it was really in such a hurry, why did it touch 745.87 only once?
At 00:00, it touched the level and then pulled back to 735.13, leaving a 10-point upper wick.
After that, volume fell from 526k all the way to 54k.
With volume drying up and the price holding sideways, who’s placing the supporting bids?
I don’t speculate; I only go by the levels.
Get above 742.46 be
post-image
MU-0.63%
Slow is the fastest way!
Yesterday I helped a buddy deploy the same Ritual bot, and today the order book already feels a lot denser 😄. I feel like their investment shouldn't have too much impact on me, right? Let's see...
‍$BTC $NOS $LABUBU
BTC-0.67%
NOS-1.40%
LABUBU+0.34%
$XAU LONG SETUP — GOLD BULLS ARE BACK IN CONTROL!

Gold is showing strong bullish momentum after a powerful recovery from 4,045.54. Buyers are defending higher levels, and another breakout could be coming!

Entry: 4,144.41
SL: 4,125.00

TP1: 4,165.92
TP2: 4,180.00
TP3: 4,195.00
Final Target: 4,210.00

Gold has reclaimed the 4,133 area, with buyers stepping in strongly after the latest pullback. A clean breakout above 4,154.98 could accelerate the rally toward 4,180 and potentially 4,210.

Invalidation: Sustained break below 4,125.

Keep your eyes on $XAU. Bulls are challenging another major re
post-image
XAU+0.38%
$ETH The inverse head and shoulders pattern is confirmed. Bullish... a drop below $2,000? That’s exactly what we need. The right shoulder has formed, and the pattern is complete. We’re not chasing here. Wait for ETH to pull back to $2,000 again. That’s the perfect time to open a long position. The plan is simple: → Enter on a retest of $2,000 → A break above the neckline confirms the bullish reversal → $3,000 is the next key target The sweep is over. Now we just wait for the next move up.
post-image
ETH-1.26%
BTC Market Analysis 2026.11.10
This is my 18th price-movement forecast, and all 17 previous forecasts were correct.
The key dividing line is 7W3. There are currently two possible scenarios and corresponding trading strategies:
1) The first scenario: Go long directly around 7w3, targeting the long term. Set a hard stop-loss at 7W1 and look for a take-profit at 8W4.
2) The second scenario: If price breaks straight through 7w3, things could get very ugly, with price heading straight for 6w4 and turning bearish. In that case, absolutely do not chase shorts here. Even if the level breaks, chasing a
post-image
BTC-0.67%
  • 1
Layout: Bitcoin, Ethereum, Dogecoin
live-cover
LIVE11
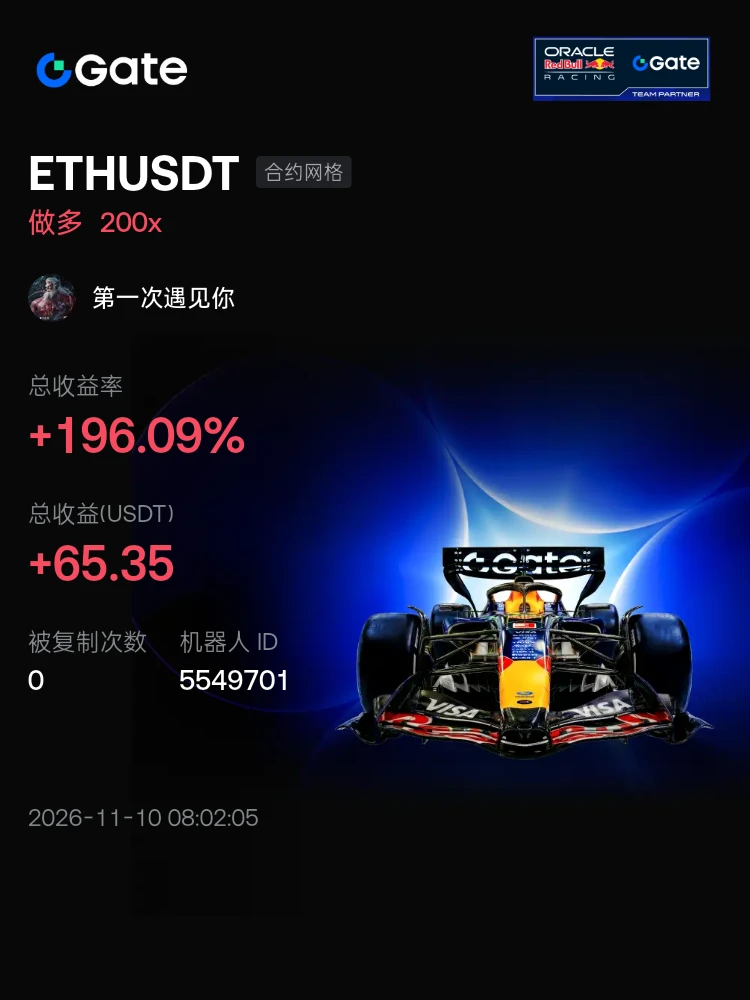
#交易机器人 I'm using the ETHUSDT contract grid bot on Gate—come copy trade with me
post-image
When we're in love, we stay together for life.
When we're not, we hide the body in a box.
Load More

Join 40 M users in our growing community

⚡️ Join 40 M users in the crypto craze discussion

💬 Engage with your favorite top creators

👍 See what interests you

Trending Topics

USCPIDataIncoming

47.01k Views2.1k Discussing

The U.S. October CPI report will be released on November 10 at 8:30 a.m. ET. September CPI came in at 3.7% year over year, and markets will be watching closely for signs that inflation is cooling, especially in core CPI. A softer-than-expected reading could strengthen rate-cut expectations, while hotter inflation may pressure risk assets through higher Treasury yields and a stronger dollar. How do you think this CPI print will move $BTC, U.S. stocks and gold?

RedBullDoublePodiumInBrazil

11.92k Views30.6k Discussing

BTCFlashCrash

256.53k Views66.64k Discussing

View More