Share your thoughts
placeholder
Article
#GateTops24HNetInflowsAmongExchanges
Gate is once again attracting attention in the crypto market as reported exchange-flow data highlights more than $79.6 million in 24-hour net inflows. The figure puts Gate at the top of the reported exchange ranking for the measured period and adds another important data point to the broader discussion around liquidity, capital movement and market participation.
Exchange net inflows are useful because they provide a snapshot of how much value is moving onto a platform compared with how much is leaving. When inflows exceed outflows, the exchange records a p
BTC-0.42%
After these years of trading, I’ve seen too much helplessness:
Staying up late watching the charts until my eyes turn red, yet still falling into the trap of chasing highs and selling lows;
Going through every piece of news and studying every indicator, yet still failing to get the market rhythm right;
Finally making some unrealized gains, only to give them all back in one pullback—ultimately working for nothing.
The market has never lacked opportunities; what’s lacking is the ability to steadily put the money into your pocket.
As the ancients said, “Ten years to hone a sword; its frosty blade
BTC-0.40%
ETH-0.75%
AVAX surges 50% in four days and hits the trending list: I’m watching for a pullback here, not chasing
Wow, $AVAX itself has climbed onto CoinGecko’s trending list. I’m bullish at this level—up 50% in four days to 11.271, with 24h volume at 141 million USDT, 6.2 times the 30-day average.
My view: the bullish trend remains intact, but RSI at 79.2 is clearly overbought. I wouldn’t chase here; I’d buy the dip on a pullback.
Bullish rationale: first, the momentum isn’t over yet—MACD’s bullish crossover above the zero line is only one day old, and MA7 has crossed above MA30 on its first day; secon
AVAX+13.98%
【$ONE Signal】1H pullback + negative funding rate short squeeze, buy the dip
$ONE 1H pulled back to 0.003634, funding rate -0.3503%, order book bid/ask depth ratio 1.81, depth imbalance 28.82%.
4H RSI 67.71, 1H RSI 49.94 neutral, 4H MACD bullish histogram contracting, 1H bearish histogram expanding, indicators in conflict.
1H Bollinger middle band at 0.0040 acting as resistance, lower band at 0.0034 providing support, 4H EMA20 at 0.0027 far below, open interest stable.
There are bids above the intraday low of 0.003541, shorts continue to pay funding, and the price remains resilient.
🎯Direction
post-image
$ETH Ethereum Consolidates at the Highs — Resistance in Focus
Due to family commitments, this will be the last analysis until late tomorrow evening
Breakout Zone Holds
Ethereum has so far successfully retested the $2,400 breakout zone, with buyers stepping in on both recent pullbacks. Holding this area keeps the broader recovery firmly intact.
Consolidating Near the Highs
Rather than seeing a sharp rejection, ETH has been consolidating near the top of its recent range. Price has now pushed as high as $2,668, increasing the possibility of another move higher.
Major Resistance Being Tested
ETH i
post-image
ETH-0.75%
It's Sunday
Enjoy and have fun
What did you eat today 👀😁
algorand:native breaking from a prolific bottom - we have spot and margin entries on this
Lets goooooooooooooooooooooooooo
post-image
ALGO+11.07%
Same Plan, Same Patience
The wolf does not predict; it prepares. I looked at four assets all weekend and one conclusion came out: the market is looking for direction but has not decided yet.
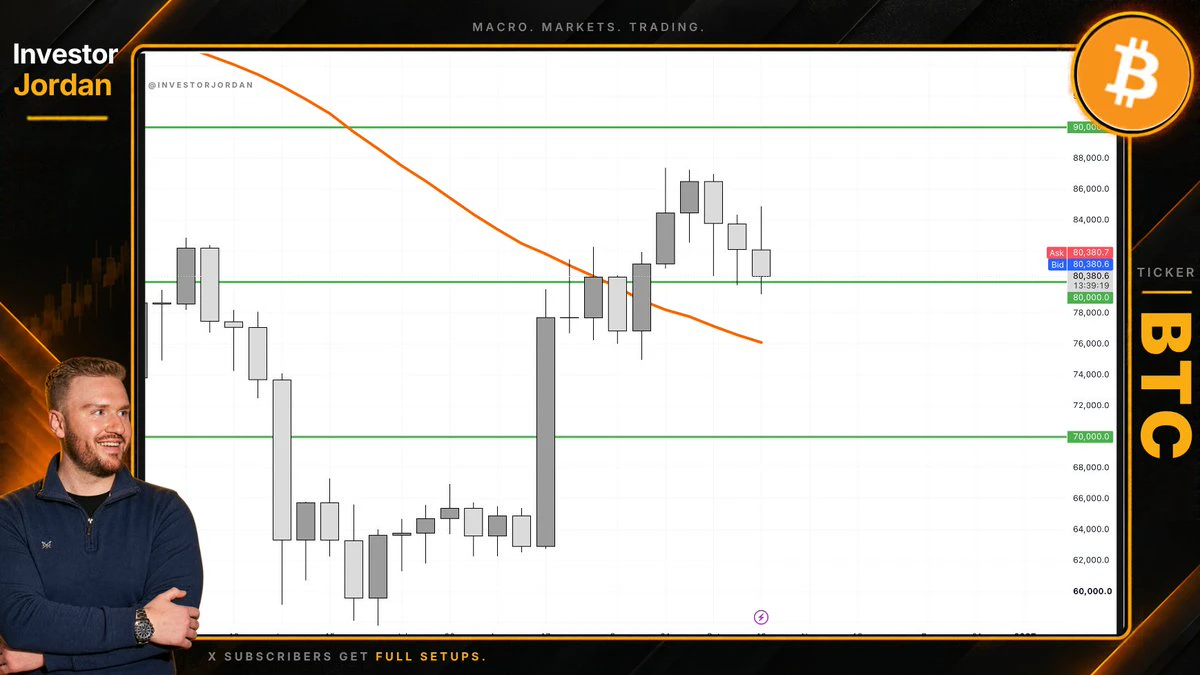
The plan is short and simple. Watch price: BTC's 80K band, ETH around 2.5K, SOL's 107 dollar support, GT's 10 dollar threshold. Watch volume: if the rally has no volume, do not believe it. Watch liquidity: is there a buyer when you want to sell? Then, and only then, move.
This weekend I am not telling anyone to buy now or sell immediately. Because the responsible approach is not predicting direction, it is
post-image
xxx40xxx
Four Assets, One Picture
The fastest way to understand the market is to read assets of different character in the same frame. The current picture is short and clear: BTC is trying to hold above 80K and is green on the week; ETH is negative on the day in the 2.5K zone; SOL is seeing a sharper daily drop around 108 dollars; GT is trading nearly flat in the 10 dollar zone.
What this table says is this: risk appetite is not dead, it is divided. Capital is not flowing fully into altcoins; the bulk is still waiting in Bitcoin. In periods like this, declines in altcoins are usually faster than BTC's, and rallies more volatile.
The right question for the wolf is not which one will earn more, but which one will tire it more. Four positions locked in the same direction are in fact one position. It is worth remembering that when BTC falls, ETH, SOL and GT often move together.
A practical frame: the core weight in BTC, the infrastructure leg in ETH, the high-beta leg in SOL, the platform leg in GT. But percentages are not copied from anyone; everyone draws their own risk line. Watch the levels, know the correlation, keep the size measured.
Risk Note: This content is not financial advice. It is for informational purposes only. Do your own research before making investment decisions.
$BTC $ETH $SOL $GT
#GateSquareMidAutumnReunion #GateTops24HNetInflowsAmongExchanges #BTCRetakes80K #EthereumSpotETFsSee144MNetInflow
#WeekendMarketBullishOrBearish
repost-content-media
BTC-0.42%
GT+0.67%
ETH-0.79%
SOL-1.45%
  • 3
Watching the market nonstop gets annoying; turning it off actually made things clearer. When I stopped watching the market, I stopped panicking too.
During the intraday bottoming, $HUMA held its level while funds quietly entered. I only suggested testing with a small position, not chasing.
Later, it rallied from 0.02133 to 0.02235, +116.19%. I played this move just right—staying up late wasn’t for nothing, and the timing was spot-on.
For a coin you’re not confident in, taking a quick look keeps you clear-headed; buying a single lot is foolish. Staying out of the market isn’t a sin—opening pos
post-image
HUMA-6.54%
SNDK-0.30%
SOL-1.42%
Japanese stocks are attracting fresh attention as several key sectors show stronger momentum, with real estate, power and semiconductor-related names becoming important areas to watch.
The latest market activity shows that sector rotation remains a major theme in Japanese equities. Semiconductor and AI-related stocks have been particularly active, while power and other infrastructure-linked companies are also attracting market interest. Recent trading in Japan saw the Nikkei 225 rise 1.38% on September 18, with major semiconductor and AI-linked companies helping drive the move.
The semiconduct
JPN2250.00%
🔥Free strategy levels for Sunday night👇
🔥Long entry levels (the second entry level, short entry level, and take-profit level are provided in the pinned subscription post; both long- and short-term spot setups are also provided in the pinned post)
===========
Long above 79300, long above 79000, Sun 77600
Long above 2535, long above 2515, stop-loss 2465
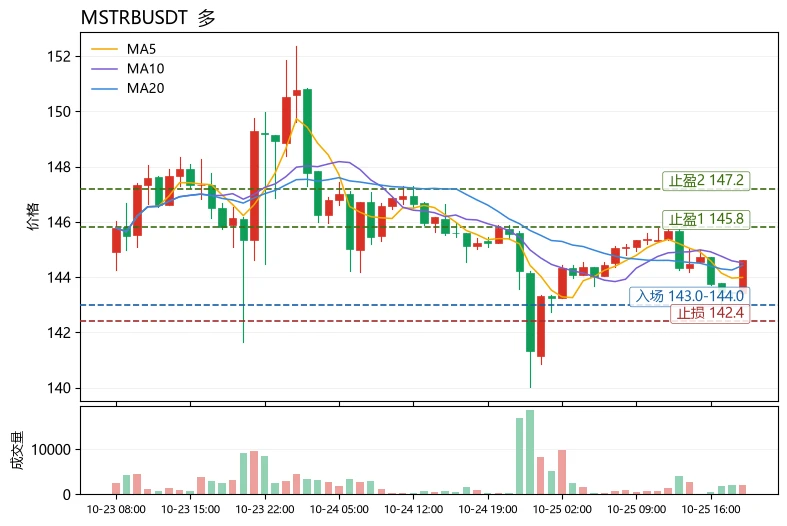
#MSTR领涨纳指100
MSTR+16.35%
Long $NEAR
market is showing signs of pumping againEntry 1: 3.607 USDT (nearby retest zone)Entry 2: 3.483 USDT (main support)Entry 3: 3.423 USDT (deep liquidity sweep zone)Take Profit:TP1: 4.600TP2: 5.000TP3: 5.594Stop Loss: 2.900The price is currently near the Weak High zone around 3.95, so FOMO is not recommended. Allocate volume evenly across the 3 entries; if the retest holds 3.60–3.48, the LONG structure still looks favorable.
post-image
$DOGE
Long around 0.0845
50x
Stop loss 0.083
1 Take profit 0.0896
post-image
DOGE-3.20%
Layout for Bitcoin, Ethereum, and Dogecoin
live-cover
LIVE90
Everyone is about to get blindsided by $WLD /USDT.

$WLD /USDT - SHORT

Trade Plan:
Entry: 0.4501 – 0.4549
SL: 0.4760
TP1: 0.4349
TP2: 0.4232
TP3: 0.4056

Why this setup?
Why now? The 1h price is 0.4522, trapped inside a range while the 15m RSI screams 84.99, meaning the short-term bounce is exhausted. The 1h ATR of 0.009771 shows that the next move will be sharp, and the entry zone between 0.4501 and 0.4549 is where the smart money is waiting to fade the top. TP1 at 0.4349 is the first target, TP2 at 0.4232 is the confirmation, and the invalidation level at 0.4132 is the hard line in the s
post-image
WLD+0.67%
If you longed hyperliquid:native and shorted aster-2:native a year ago you would be up >500% while paying $0 in funding.
Only thing that beats that is buying something like $100 strike HYPE call options a year ago.
Don't sleep on pear trading - ngl also talking to myself here.
post-image
HYPE+0.28%
ASTER-3.19%
Can you see the blue tiles in the screenshot?
For the past month or so, I might have taken only 3 days off from Claude Code.
This shows how much I am locked in with building my trading bot - Money Machine.
Now, it's not just about 1 month.
The data is not complete here.
Because I figured out how to use Claude Code for my workflow very late.
Earlier, I had a very rookie - 2023 styled workflow.
I was prompting Claude Chat and asking for a step-by-step guide.
Then I was copy pasting the codes given by Claude Chat.
I would go back and forth with the chat when I encountered errors.
This immens
post-image
XRP is about to break range, but not the way longs expect.

$XRP /USDT - SHORT

Trade Plan:
Entry: 1.3972 – 1.4038
SL: 1.4320
TP1: 1.3769
TP2: 1.3611
TP3: 1.3375

Why this setup?
Why now? The daily trend is range, but the 1h price is hugging resistance near 1.4003 while the 15m RSI sits at 70.54, showing momentum is exhausted on the short term. The 1h ATR of 0.013122 means a single candle can cover the distance to TP1 at 1.3769, making the entry zone around 1.4005 a high probability fade. With TP2 at 1.3611 and TP3 at 1.3375, the setup offers a clear staircase down, but the line in the sand
XRP-1.77%
🚀 $LINK
Buyers behind the strong breakout have taken full control and are targeting further upside...Now going long with 15x leverage: Entry zone: $12.20 – $12.60Target 1: $13.00Target 2: $13.60Target 3: 14.30Stop-loss: 11.75Click below to place an order immediately...👇Setup logic: $12.20–$12.60 is the key entry zone for this long setup. As long as the price holds above $12.20, the bullish structure remains valid. A clean breakout above $13.00 could open the way to $13.60 and 14.30. Risk management: Do not over-leverage or trade emotionally; please protect your capital. The market will give
post-image
Load More

Join 40 M users in our growing community

⚡️ Join 40 M users in the crypto craze discussion

💬 Engage with your favorite top creators

👍 See what interests you

Trending Topics

MSTRTopsNasdaq100

74.18k Views3.02k Discussing

Strategy (MSTR) has gained about 48% over the past month, making it the best-performing stock in the Nasdaq 100, while Bitcoin rose roughly 12% over the same period. The company holds 845,050 BTC with a cumulative cost basis of about $63.73B. MSTR is not a pure Bitcoin proxy — its price swings can be more extreme. Can this rally last?

Gate Tops 24H Net Inflows Among Exchanges

26.5k Views3.69k Discussing

BTCRetakes80K

57.29k Views60.65k Discussing

View More