Share your thoughts
placeholder
Article
🔥 Ice Trader LIVE | Bitcoin Signals & Market Update 🚀
live-cover
LIVE1,086
#AKE shorted from 0.01 to 0.08—fucking hell.
post-image
AKE+37.89%
Opened a Pokemon pack today for Avery
Will do more on @dyli_io and @Beezie tonight
I always watched your videos and you made big man cry today
It pains me so much that you’re gonna so soon but we know you’re in a better place now
RIP angel 👼
post-image
$80K has held, but I won't call for a rush at this point
BTC has climbed back above $80K, and market sentiment has clearly improved. But the purpose of this post isn't to call for a trade; it's to put the risks on the table.
First risk signal: daily RSI is overbought. The current daily RSI has risen to 82.93, its highest level since November 2024, clearly indicating short-term overheating pressure. Overbought does not mean an immediate drop, but it does mean the risk-reward of continuing to push higher in the short term is deteriorating.
Second risk signal: whales are taking profits. On-chain
post-image
BTC-1.17%
  • 15
$ZEC —Rejection means a retracement.
Short-term $ZEC entry: 1,435–1,450 Stop-loss: 1,495 Take-profit 1: 1,426.53 Take-profit 2: 1,400 Take-profit 3: 1,365. Selling pressure may intensify here. If rejection occurs, it may trigger a downside reversal. Trade 👇 here at $ZEC .
post-image
ZEC-7.71%
Tired from scrolling
Let’s share some scenery and relax a little.
#BTCRetakes80K In September 2026, the crypto market experienced a textbook case of inverse pricing.
Amid the double shock of the Federal Reserve announcing its first 25-basis-point rate hike since July 2023 and the U.S. Senate rejecting the procedural motion for the CLARITY Act by 49 votes to 50, Bitcoin not only held above the key support level of 76,000 USD but instead launched a short squeeze rally on September 18, gaining approximately 6% and climbing back above 81,000 USD. As of September 20, 2026, based on Gate market data, BTC was fluctuating within a narrow range around 81,000 USD, wit
post-image
GateBlog
Rate Hike and CLARITY Roadblock: Why Did Bitcoin Rise Instead of Fall Amid the Double Negative Factors?
In September 2026, the crypto market experienced a textbook case of inverse pricing.
Amid the double shock of the Federal Reserve announcing its first 25-basis-point rate hike since July 2023 and the U.S. Senate rejecting the procedural motion for the CLARITY Act by 49 votes to 50, Bitcoin not only held above the key support level of 76,000 USD but instead launched a short squeeze rally on September 18, gaining approximately 6% and climbing back above 81,000 USD. As of September 20, 2026, based on Gate market data, BTC was fluctuating within a narrow range around 81,000 USD, with an intraday price range of approximately 81,088 USD to 81,156 USD.
This was not a simple oversold rebound. Rising interest rates pushed up risk-free yields, and by traditional estimates,
BTC-1.17%
Overview of Today’s SOL Ecosystem Tokens and Trading Levels!
If you’re referring to this latest SOL rally and want to position yourself in the SOL ecosystem ahead of time rather than chase SOL itself, I would focus on several areas. Solana’s on-chain fundamentals are indeed improving: DEX trading volume was approximately $17.3 billion over the past week, network fees were approximately $107 million, and fees increased 26.9% month over month. At the same time, the scale of Solana’s RWA sector has surpassed $4 billion, while tokenized stock trading is also growing rapidly.
I would divide them in
post-image
SOL-3.45%
RWA-1.18%
JUP-3.19%
RAY-12.26%
JTO+8.71%
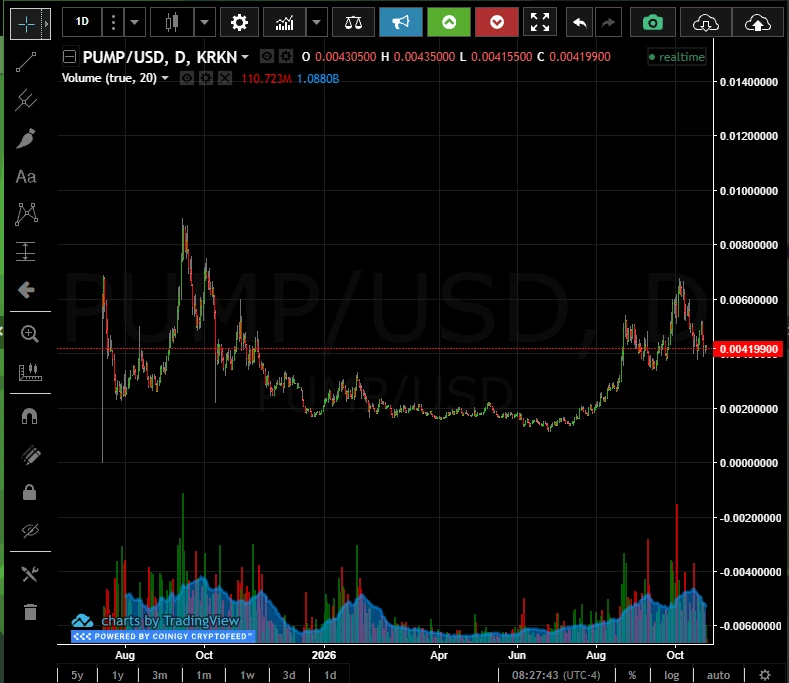
The core reason I have held this $PUMP long position until now is not guessing the direction, but waiting for a pullback confirmation above 0.003600. When the price first surged to 0.003977, I did not chase it. I waited for it to pull back without breaking the short-term moving average, then completed the position as planned. Current unrealized profit: +741.61%.
In terms of market structure, the moving averages are beginning to fan upward, but what really matters is that the key previous-high level has not been fully cleared. As long as the price remains above the key pullback level, the bull
post-image
PUMP-3.38%
ZEC-7.44%
DOGE-3.47%
Insiders are quietly loading $BR /USDT before the next explosive leg up.

$BR /USDT - LONG

Trade Plan:
Entry: 1.00671 – 1.04337
SL: 0.84905
TP1: 1.15703
TP2: 1.24503
TP3: 1.37702

Why this setup?
Why now? The daily trend is bullish, the 1h price sits at 1.02504, the 15m RSI is 39.63, the 1h ATR is 0.073329, the entry zone spans 1.00671 to 1.04337, TP1 is 1.15703, TP2 is 1.24503, and the invalidation level is 0.58764. The bullish daily trend confirms a macro uptrend, while the 1h price at 1.02504 anchors the entry reference. The 15m RSI at 39.63 signals room for upside before overbought, an
BR+32.21%
#周末行情你看涨还是看跌 #每周来晒
For this weekend, my overall market view is cautiously bullish. I am not looking at a simple green-market narrative; I am looking at price structure, volume, liquidity, momentum and the ability of buyers to absorb macro pressure.
Bitcoin has recovered back above the $80,000 psychological level, while Ethereum has returned toward the $2,600 area. The broader crypto market has also shown renewed risk appetite. For me, the key question is not whether the market can move higher for one candle, but whether buyers can defend the important levels and confirm the breakout with vol
BTC-1.17%
ETH-2.64%
COIN+11.64%
HOOD+9.10%
  • 2
🇯🇵📈 Japan’s Real Estate & Power Chip Stocks Rise! ⚡🏢
Japan’s market is seeing fresh momentum as real estate and power semiconductor stocks move higher. 🚀 Investors are closely watching the sectors benefiting from changing economic conditions, infrastructure demand, and technology-driven growth. 💹🔋
Power chips remain an important part of the global electronics and EV supply chain, while real estate continues to attract attention amid evolving market trends. 🏗️⚡
The move highlights the growing interest in Japan’s strategic industries and the opportunities emerging across its equity marke
post-image
$AKE took a loss of 1000000U.
post-image
AKE+56.45%
  • 22
#渣打预计ARB2030年达10美元 #Gate广场中秋团圆局 Standard Chartered’s ARB $10 Target: Hype or Value?
On September 15, Standard Chartered initiated coverage of ARB, authored by Geoff Kendrick, Global Head of Digital Asset Research, and gave it a $10 target price by the end of 2030. At the time, based on a price of approximately $0.14, this implied “approximately 70x.” Since then, ARB has surged, leaving approximately 48x upside at the current price!
Standard Chartered’s path: $0.5 by the end of 2026 → $1.5 in 2027 → $3.5 in 2028 → $6.5 in 2029 → $10 by the end of 2030. The implied annualized return is approxima
post-image
ARB-0.37%
  • 7
Damn, is it all over? Fuck.
post-image
  • 1
Bitcoins market capitalization surpasses Teslas, returning it to the top 15 globally.
live-cover
LIVE1,168
$USUAL – Bulls are quietly rebuilding strength🌱
Long position $USUAL entry: 0.0128 – 0.0131Stop-loss (SL): 0.012Take-profit (TP): 0.014 - 0.015 - 0.016After weakening recently, the price is holding within a relatively tight range; buying pressure is gradually absorbing selling pressure near the support level. This consolidation is beginning to look constructive, and once demand returns, it could trigger a more significant shift in momentum. Disclaimer: "This is solely my personal opinion, does not constitute investment advice, and is not intended for Vietnamese people."
post-image
USUAL-2.53%
What do we do? @Polymarket has IPO’d on BSC 🥲🥲🥲
Fuck me, I farmed it for two years, and it ends up doing an on-chain IPO. The airdrop is probably gone.
Based on multiple sources, it’s confirmed to be Polymarket, with an FDV of over 15 billion.
post-image
I’ve managed to hold this $UNI long position until now. The key wasn’t guessing the direction, but the pullback confirmation above 6.662. I didn’t chase when the price first surged to 8.783; I waited for it to hold above the short-term moving average on the pullback, then added to the position as planned. Current unrealized profit: +2255.3%.
Structurally, the moving averages are beginning to fan upward, but what really matters is that the key prior-high level has not been fully cleared. As long as the price stays above the key pullback level, the bullish structure remains intact; if it breaks
post-image
UNI-3.42%
SNDK-1.12%
SOL-3.45%
$CELR The most unusual detail today is not the +70.34% gain, but the funding rate plunging to -0.1868%—the price is surging while shorts are paying, indicating that substantial capital is shorting against the trend. This structure often means the short squeeze is not over. However, the technical picture is not cooperating: MA5=0.0043792 is clearly above MA20=0.00362425, and the bullish moving-average alignment remains intact, but the current price of 0.003952 has fallen below MA5, indicating that short-term momentum is beginning to fade. The MACD histogram is -6.589e-06, with DIF crossing belo
post-image
CELR+74.13%
Load More

Join 40 M users in our growing community

⚡️ Join 40 M users in the crypto craze discussion

💬 Engage with your favorite top creators

👍 See what interests you

Trending Topics

MSTRTopsNasdaq100

73.71k Views2.82k Discussing

Strategy (MSTR) has gained about 48% over the past month, making it the best-performing stock in the Nasdaq 100, while Bitcoin rose roughly 12% over the same period. The company holds 845,050 BTC with a cumulative cost basis of about $63.73B. MSTR is not a pure Bitcoin proxy — its price swings can be more extreme. Can this rally last?

Gate Tops 24H Net Inflows Among Exchanges

26.31k Views3.67k Discussing

BTCRetakes80K

56.61k Views60.21k Discussing

View More