Share your thoughts
placeholder
Article
Whale alert: Address 0x6750 bought 174,826 HYPE (~$15.01M) and fully staked them. If true, this could signal strong long-term conviction and potential upside for HYPE liquidity dynamics. $HYPE
post-image
HYPE+1.40%
Everyone’s long CL/USDT at 91.78—but the 4h tape just whispered a secret that flips the script.

CL/USDT - SHORT

Trade Plan:
Entry: 91.70 – 91.86
SL: 92.59
TP1: 91.17
TP2: 90.77
TP3: 90.16

Why this setup?
- Price is pinned at 91.78 with a 1D range, not a breakout—mean reversion is king.
- RSI 15m at 54.09 shows zero bullish thrust; momentum is stalling right at resistance.
- Why now? ATR 1h (0.337) is tiny—squeeze is loading. If we lose 91.70, the vacuum pulls us to TP1 91.17 fast, then TP2 90.77.
- Stop at 92.59 is tight—risk/reward is nearly 1:2.5 for the short side.

Debate:
Are
CL+0.82%
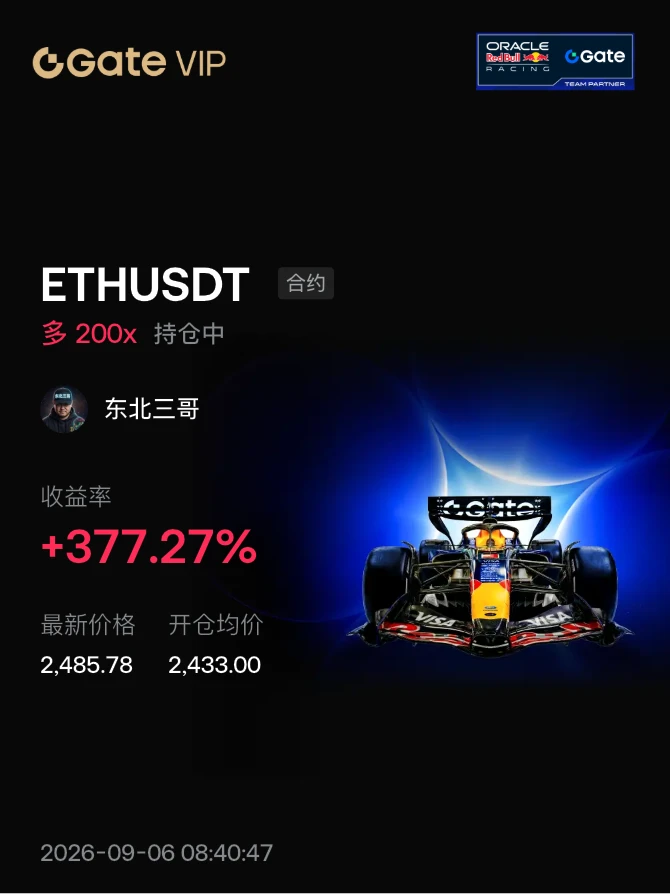
Take profit or significantly reduce the position around 2495–97 (you can try a small short at 2497–95, with a stop-loss at 2510)
post-image
Everyone’s long gold at 4440—but the 4h tape just whispered a dirty secret about $XAU /USDT.

$XAU /USDT - SHORT

Trade Plan:
Entry: 4435.04 – 4437.50
SL: 4448.05
TP1: 4427.44
TP2: 4421.55
TP3: 4412.72

Why this setup?
Why now? RSI on the 15m is already at 38.8 (weak bounce fuel), while the 1D trend is dead range—no rescue bid coming.
- Entry zone: 4436.27 (tight 4435–4437.5 trap).
- TP1 at 4427.44 is a 0.2% scalp; TP2 at 4421.55 is where the real pain starts.
- Stop at 4448.05 keeps risk tight (≈0.27%), but the invalidation at 4468.52 tells you the bulls are bluffing.
The setup is
XAU-0.03%
🚀 🚀 🚀 𝐌𝐚𝐫𝐤𝐞𝐭 𝐀𝐧𝐚𝐥𝐲𝐬𝐢𝐬 | 𝐏𝐎𝐍𝐒/𝐔𝐒𝐃𝐓
Pons ($PONS ) is holding strong bullish momentum near $0.931, consolidating closely beneath its recent peak barrier of $0.972. Sustained buying interest driven by Robinhood Chain activity and whale wallet accumulation continues to absorb selling pressure, setting up an immediate retest of local all-time highs.
📊 𝐊𝐞𝐲 𝐌𝐞𝐭𝐫𝐢𝐜𝐬
• Current Price: ~$0.931
• Market Cap: ~$650M – $665M
• 24H Range: $0.683 – $0.972
• Market Bias: Bullish / Breakout Retest 🐂⚡
📈 𝐓𝐞𝐜𝐡𝐧𝐢𝐜𝐚𝐥 𝐇𝐢𝐠𝐡𝐥𝐢𝐠𝐡𝐭𝐬
• Structural Momentum: Price acti
PONS+40.32%
#GateEventContractTradeSharingChallenge
#XAU Gold Is At a Macro Crossroads
Gold is entering the new week in a very different position from where it started September.
The latest available spot data puts XAU/USD around the $4,430 area, after Friday’s sharp reaction to the U.S. jobs report. Spot gold closed around $4,419 on September 4, falling roughly 1.2% as the dollar and Treasury yields moved higher.
The immediate trend is therefore neutral-to-bearish, but I would not call the larger gold structure broken yet.
The key catalyst was the U.S. August employment report. Nonfarm payrolls increas
XAU-0.03%
TSLA-5.96%
MU+5.89%
AAPL-2.51%
Noted ✍️, ZEC short position. The limit order to add to the position was filled, and I exited when I saw an opportunity. It looks like it may hit a new high today, probably around 1216. This should be the final wave.
ZEC+4.54%
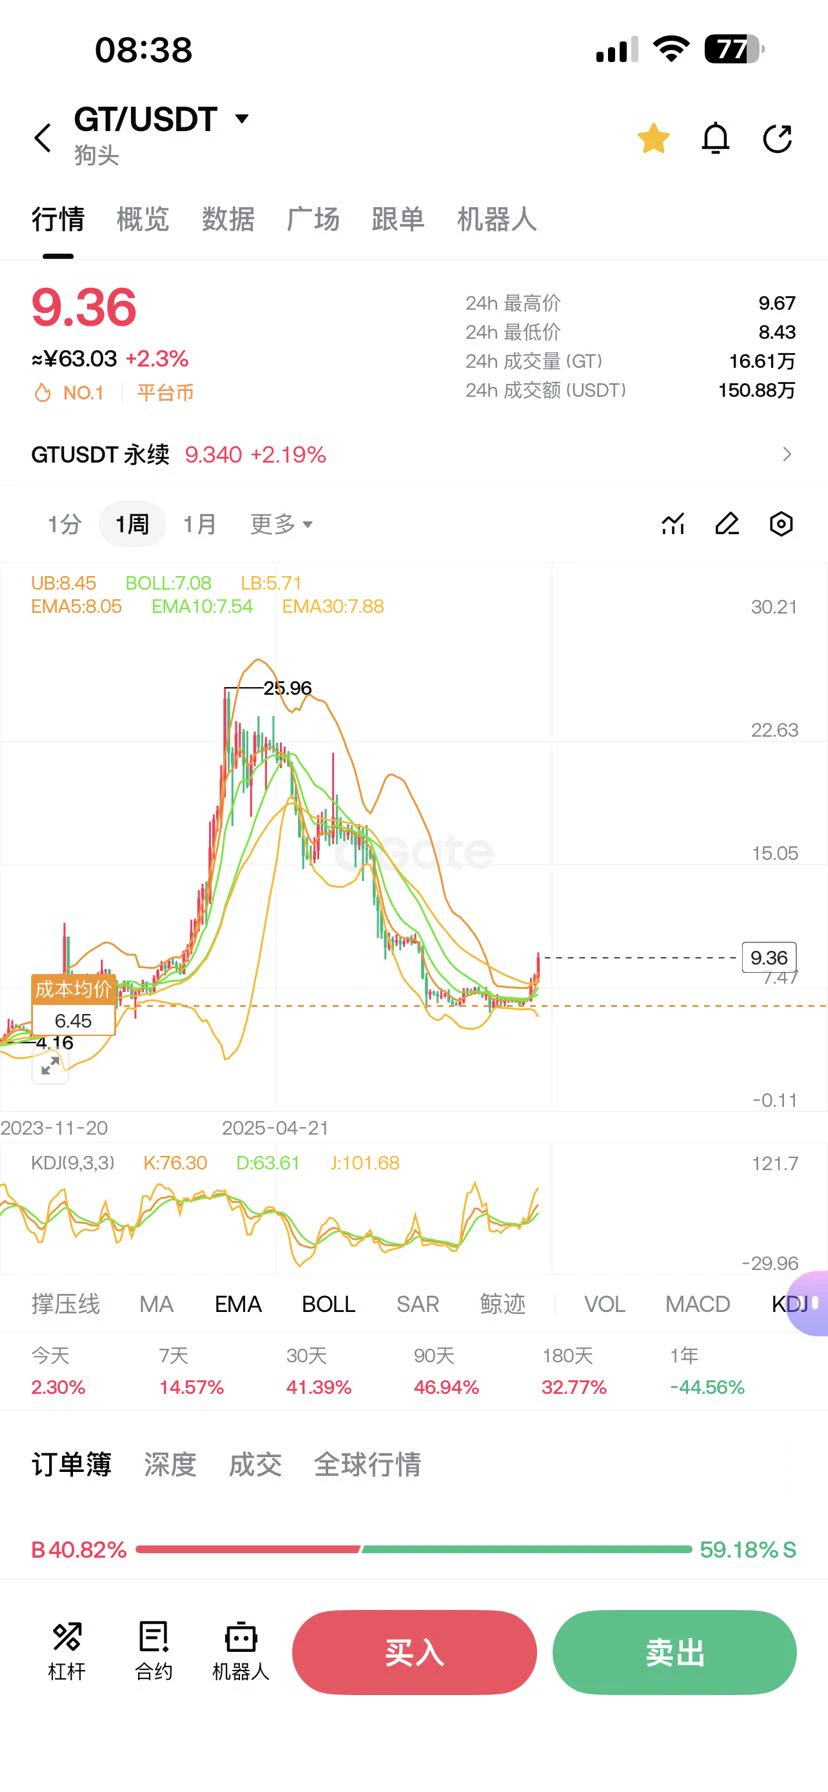
$GT Offloaded at $30–55
post-image
GT+11.59%
Nobody’s watching PEPE’s quiet 4H reversal—but the data just whispered a nasty secret.

PEPE/USDT - SHORT

Trade Plan:
Entry: 0 – 0
SL: 0
TP1: 0
TP2: 0
TP3: 0

Why this setup?
- 1D trend is *range*, not bullish—so every spike is a short seller’s gift.
- RSI on 15m sits at 56.9, stalling before overbought—momentum is faking strength.
- Confidence 55 on SHORT means the edge is thin but real; entry is still “Waiting,” so we’re early, not late.
- Why now? Because range tops punish late longs—and this setup is 0.5% from a trap.

Debate:
If PEPE rejects this level, do you fade the breakout
PEPE+4.27%
Stop scrolling if you think ZEC is dead—this 95% confidence signal says otherwise.

$ZEC /USDT - LONG

Trade Plan:
Entry: 1027.77 – 1035.19
SL: 995.83
TP1: 1058.22
TP2: 1076.04
TP3: 1102.78

Why this setup?
- 4h timeframe is **Armed LONG** with 95% confidence—that’s rare.
- 1D trend is bullish, and 1h RSI (66.37) shows momentum building, not overheated.
- Entry zone: 1031.48 (low 1027.77–high 1035.19). TP1 1058, TP2 1076, TP3 1102.
- Why now? Price is squeezing above recent ATR (14.85) volatility—breakout fuel is loaded.

Debate:
Is ZEC front-running a privacy narrative revival, or w
ZEC+4.54%
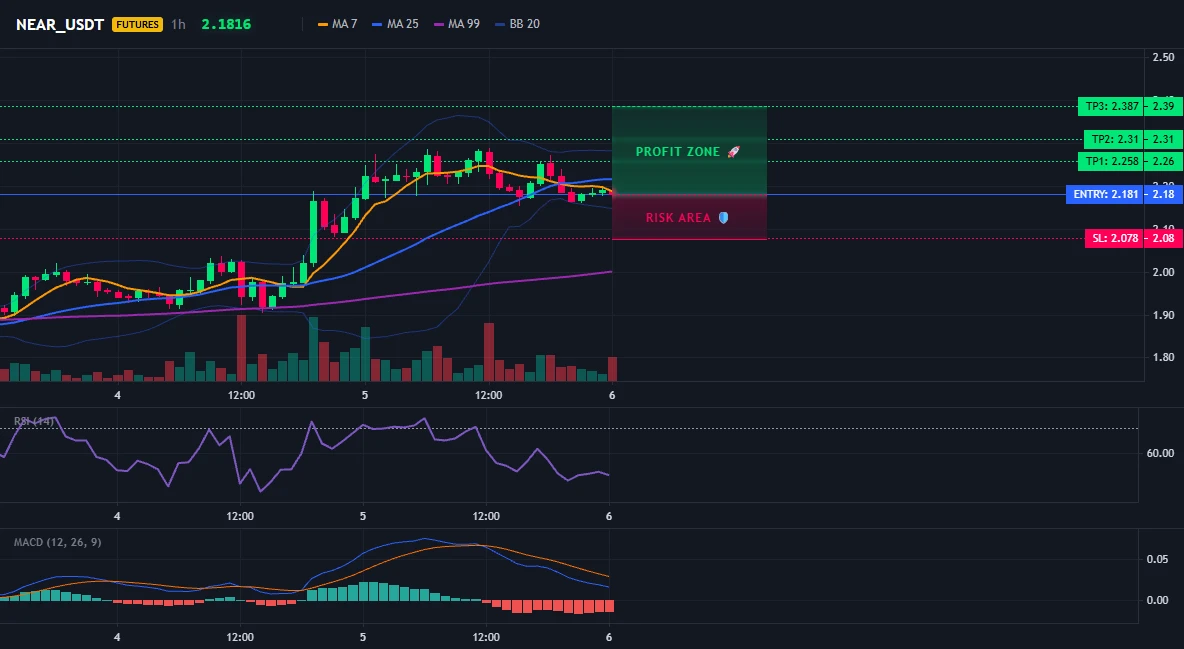
Everyone’s staring at NEAR’s 2.18, but the 95% confidence score is hiding a trap door.

$NEAR /USDT - LONG

Trade Plan:
Entry: 2.170 – 2.192
SL: 2.078
TP1: 2.258
TP2: 2.310
TP3: 2.387

Why this setup?
- 4H bias is LONG with 95% conviction, but RSI on 15m is weak at 45.53—momentum hasn’t confirmed the entry yet.
- Daily trend is bullish, and ATR (0.0428) suggests tight, controlled volatility—perfect for a squeeze.
- Entry zone 2.170–2.192 is a spring, not a cliff: TP1 at 2.258 is only 3.5% away, but TP3 at 2.387 is the real prize.
- Why now? The 1D uptrend is intact, and this pullback
post-image
NEAR+0.87%
I just casually hit refresh, and it dropped all by itself, leaving me on the back foot. 😂
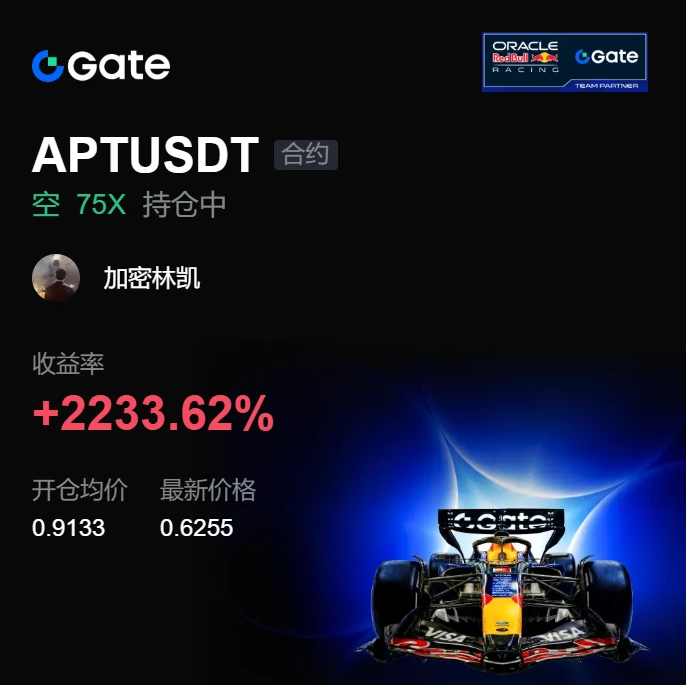
When the screen was full of green, $APT /APT bounced twice but failed to hold either rebound. The volume weakened each time; no one was buying on the way up, showing that the bears still weren’t done. I tentatively placed a short order at 0.9133, just to test the direction.
Then I switched away to take a sip of water, and when I came back, the current price had already fallen to 0.6264, with my unrealized profit reaching +2228.96%. This was purely good luck—I casually tossed out a few gold coins, and they
post-image
APT+6.32%
ZEC+4.54%
ETH+2.00%
Market prediction
live-cover
LIVE1,875
🌈 #GateLiveStreamingInspiration -September 6
Go live with the following topics now to receive extra official support and promotional exposure!Today's Topic Recommendations:
🔹 BNB Surpasses 770 USDT with a 7.24% Increase in 24 Hours
🔹 MARSCOIN market cap breaks through $265 million to reach a new all-time high, with a 24-hour increase of 38.2%
🔹 Bonk Guy's PONS position achieves over 150x returns, with his portfolio breaking through $27 million to reach a new all-time high
🔹 The surge in trading activity on the Robinhood chain drives ARB up over 48% in a single day, reaching $0.196
🔹 Anse
post-image
BNB+5.63%
MARSCOIN+31.48%
PONS+40.32%
ARB+46.18%
  • 4
  • 3
2026.9.6 Weekend Summary and Review: Growth Is an Inevitable Journey
This week, I made a total of 5 trades, all profitable: long SNDK at 1515 on Monday, long XAU at 4363 and BTC at 76700 on Tuesday, and long Little Nose tree at 0.418 on Wednesday night. It is either profit or loss; the stop-loss has not been triggered, and it is currently in a take-profit state. If you do not want to hold it, simply take profit; on Thursday night, I went long HYPE at 83.68, reduced the position on Friday, and exited with the remaining position at breakeven with a small profit at 84.
The WIF position left over
post-image
SNDK+11.88%
XAU-0.03%
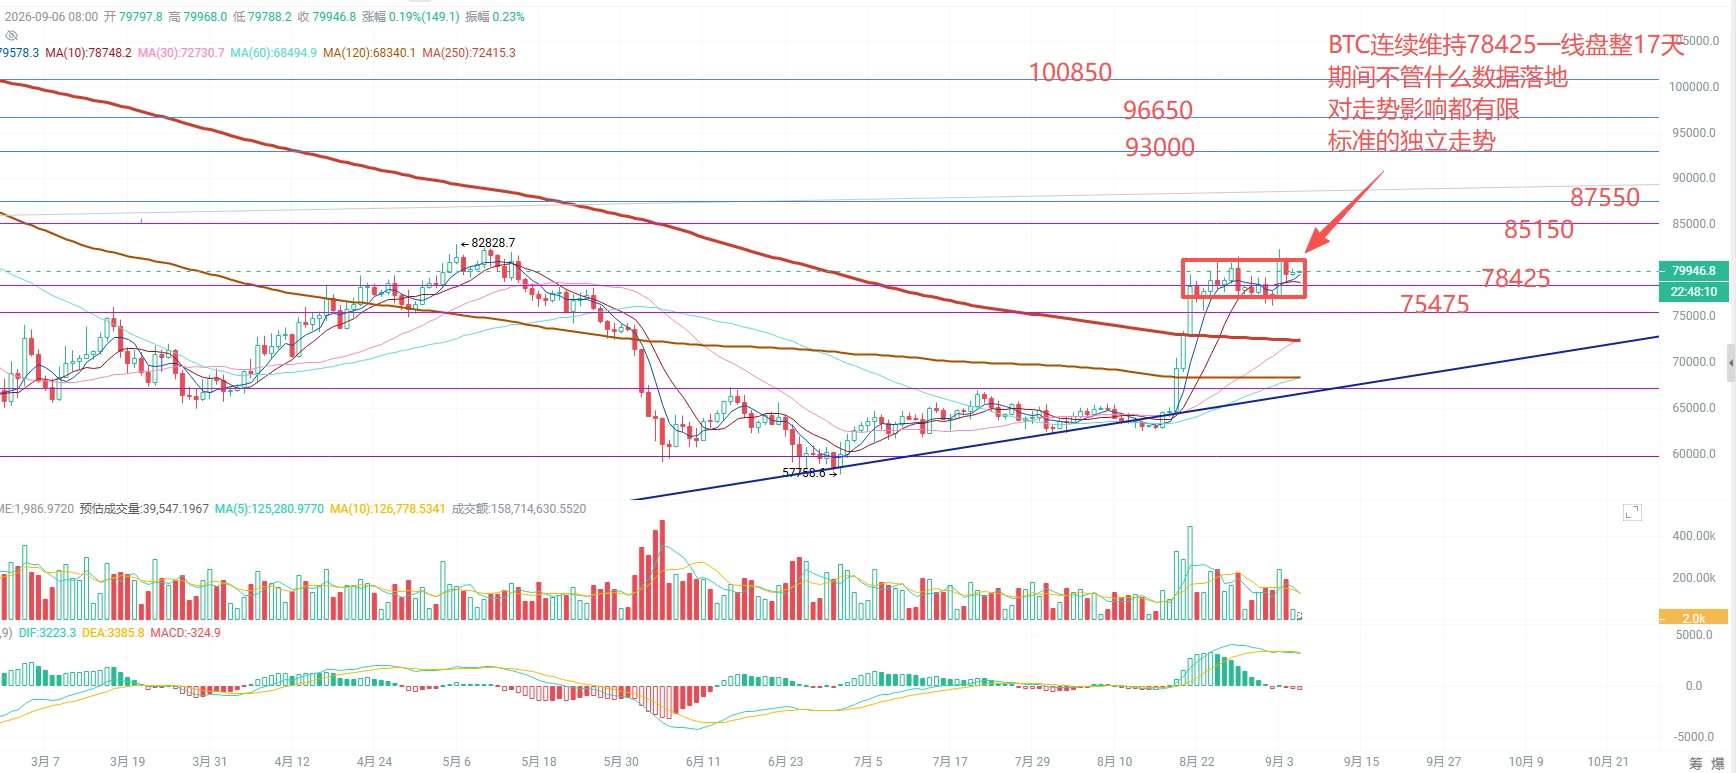
BTC+0.42%
TREE+0.75%
HYPE+1.40%
  • 4
  • 1
Just discovered a risk-free arbitrage opportunity generating tens of thousands of dollars per day from a single trade
I believe many people on robinhood have been rugged to the point of tears. Today I’m sharing an exclusive opportunity unavailable anywhere else—guaranteed profits with no losses
While the U.S. stock market was closed over the weekend, robinhood’s on-chain BONER coin surged. Because the Meme coin skyrocketed, the HIMS stock token paired with it on the robinhoodhood DEX also became massively overpriced and depegged, reaching 10x the U.S. stock’s closing price last Friday
Here’s w
MEME+2.05%
HIMS-0.32%
NVDA+0.87%
NVDAG+0.40%
NVDAON+0.48%
Everyone’s watching XRP’s breakout, but the 4H tape just whispered a name you didn’t expect—and it’s not “long.”

XRP/USDT - SHORT

Trade Plan:
Entry: 1.415 – 1.419
SL: 1.438
TP1: 1.401
TP2: 1.391
TP3: 1.375

Why this setup?
Why now?
- Price is pinned at 1.417, but the 1D trend says *range*, not rocket fuel.
- RSI on the 15m (55.12) is cooling from overbought—momentum is stalling, not accelerating.
- ATR (0.0088) is tight; that’s a coiled spring, but the bias is SHORT (55% conf) with invalidation at 1.406.
- Targets are stacked down: 1.401 → 1.391 → 1.375. The path of least resistan
XRP+1.31%
Everyone’s chasing silver’s rally, but the 4h chart just whispered a secret to me about $XAG /USDT.

$XAG /USDT - SHORT

Trade Plan:
Entry: 66.24 – 66.30
SL: 66.54
TP1: 66.07
TP2: 65.94
TP3: 65.74

Why this setup?
Why now? The 1D trend is *range*, not breakout—so mean reversion is king.
- RSI on 15m is 58 (cooling, not overbought), but the 1h ATR (0.111) shows volatility is compressing.
- Entry at 66.27 with TP1 at 66.07, TP2 at 65.94—that’s a 0.5% drop before the daily range even blinks.
- Confidence is only 55, but the invalidation at 66.76 is tight—risk is defined, reward is 3:1 to
XAG+0.02%
Everyone’s long ADA while the 4h chart whispers a different exit—are you listening?

$ADA /USDT - SHORT

Trade Plan:
Entry: 0.2210 – 0.2222
SL: 0.2270
TP1: 0.2175
TP2: 0.2148
TP3: 0.2107

Why this setup?
- RSI 15m at 64 shows a local overheat, but the 1D trend is *range*, not breakout.
- Entry zone 0.2216 (0.2210–0.2222) is a liquidity magnet; ATR 1h at 0.0023 means tight stops, fast moves.
- Why now? Price sits at range-high resistance with a SHORT bias (55% confidence)—the “waiting” status means the trap is set before TP1 at 0.2175.

Debate:
Range high or fake pump—do you trust the 0
ADA+4.75%
BTC MARKET UPDATE
live-cover
LIVE1,009
Load More

Join 40 M users in our growing community

⚡️ Join 40 M users in the crypto craze discussion

💬 Engage with your favorite top creators

👍 See what interests you

View More