Square
Following
Hot
News
Profile
Share your thoughts
placeholder
Article
$BNB BNBUSDT: +3.4% bounce off $709 — $735 resistance decides next
BNB outperformed in today's ~$1B liquidation cascade. While ETH fell 5%+ and BTC broke $81K, BNB finished green (+0.5%), bouncing 3.4% from $709 to $733, just below its $735.3 24h high. The question is whether this is genuine relative strength or a slower bleed while markets digest hot US inflation data.
Daily: Price fell from $745–747 (Oct 14) to a $709 wick (Oct 15 02:00 UTC), then recovered to $733.2, still ~1.6% below the selloff origin. Recovery remains corrective until $740+ flips to support.
4H: A $745 → $709 down-leg wa
post-image
BNB-0.12%
Let me say one thing for those who are bullish $ONDO , and one thing for those who are bearish.
The bullish side needs to prove that buyers are stepping in above 0.4716; the bearish side needs to prove that no one will catch it after 0.4221 is lost. $ONDO is currently at 0.4687, up 5.23% in 24 hours. The 1-hour support is 0.4221, resistance is 0.4716, and current volume is 0.37 times the average volume of the past 20 bars.
Before both sides have presented all their evidence, I am more concerned that $ONDO remains strong and that the crowded positioning is already out in the open. I acknowledge
post-image
ONDO+5.57%
Insiders are calling the SYMBOL long setup the best kept secret of 2026.

$BTC /USDT - LONG

Trade Plan:
Entry: 82016.6 – 82308.2
SL: 80762.7
TP1: 83212.2
TP2: 83912.0
TP3: 84961.8

Why this setup?
Why now? The daily trend is firmly bullish, the 1h ATR of 583.19 signals strong volatility, the 15m RSI at 48.41 shows room to run before overbought, and the entry zone around 82162.4 aligns with the 1h price of 82163.9. The first target sits at 83212.2, the second at 83912.0, and the third at 84961.8, giving the trade defined upside. The line in the sand is 82416.4; breaking below invalidates th
BTC+0.75%
$BTC
BTC Long/Short Trend Monitor |
Simply put:
Bitcoin is currently weak and range-bound in the short term, but the trend has not broken down yet.
1. Current price: Around 82,000
2. Short-term direction: Bearish; it is being capped by the moving averages and unable to move higher, with strong resistance above 84,000
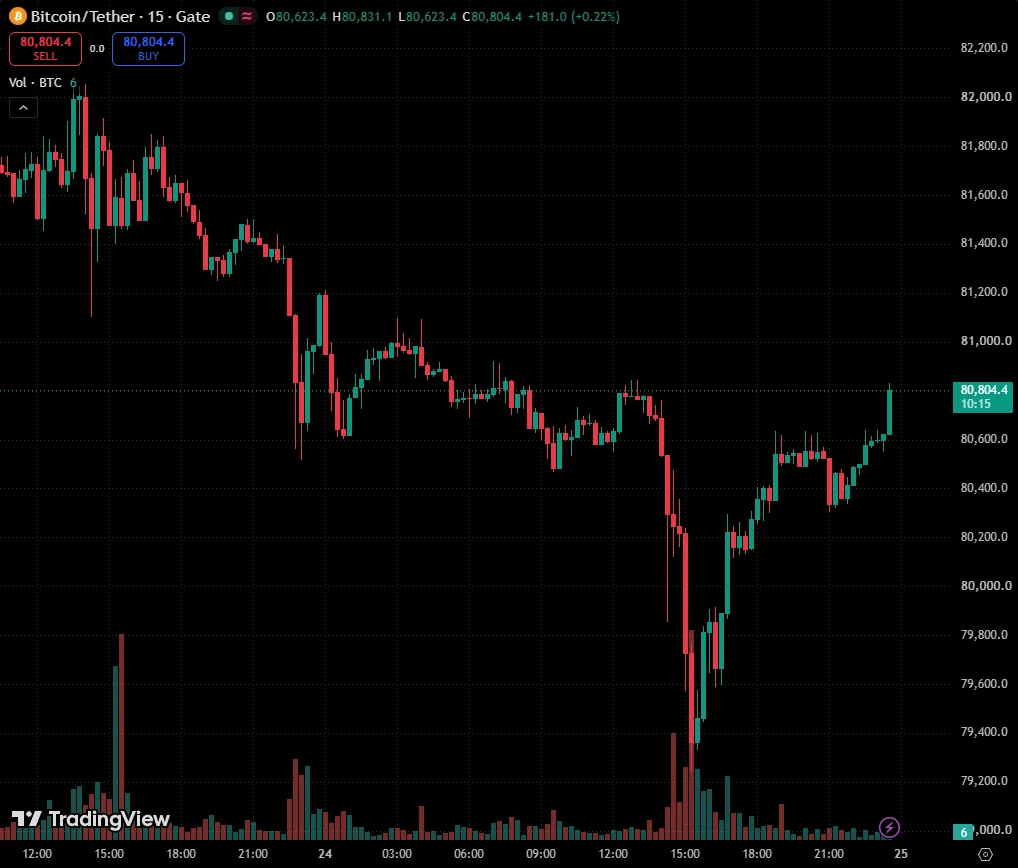
3. Support level: 80,000 is the key floor; only a break below it would lead to a further decline toward 77,000
4. Medium to long term: The broader trend remains intact, with support still at the bottom, so there is no need to panic excessively
One-sentence summary: Weak consolida
BTC+0.78%
📊 BCV at 879.12 and USDT P2P with a 15.35% premium… but the order book shows an actual spread of just 0.02%.
The BCV rate, the traffic light spread, and the order book spread measure different things — that’s why they can coexist. We explain what each one shows.
👉
#P2P #USDTVES #Venezuela
post-image
Stonk eco woke up and said hello $stonk $nearkat
STONK+10.90%
crypto market update
live-cover
LIVE2,110
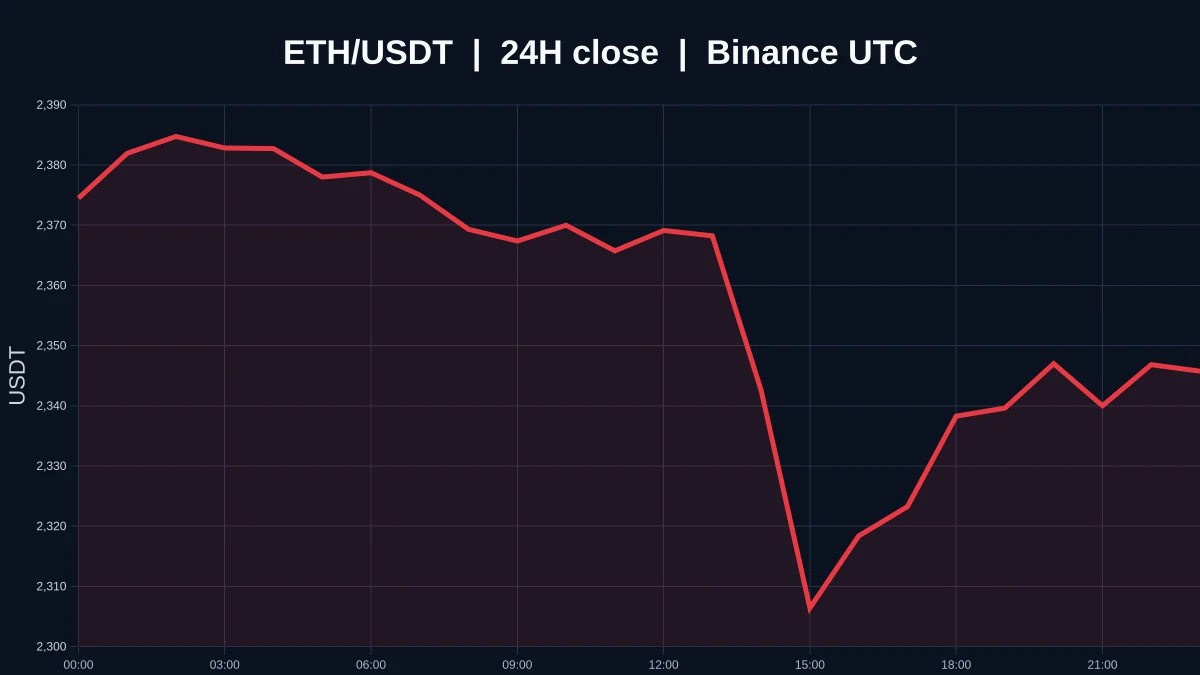
At 10 a.m. yesterday, Ether crashed to 2318 before recovering—I know what you’re hesitating about: it’s not that you’re bearish on it, you’re just worried this drop isn’t over yet.
The Time Lord sees this move as the end of a three-wave decline—in other words, the C wave.
The daily chart’s yearly moving average is around 2355. Yesterday’s wick pierced below it before recovering—the volume was 1.3 times that of the previous few days, so this wasn’t a drop with nobody stepping in.
The 2411 level we mentioned last time broke, and this is where it went next. He placed orders lower, with his stop-l
post-image
ETH+0.71%
Retail sales increased, but don’t rush to pop the champagne over consumer spending. Gasoline also counts as a purchase, and higher fuel prices can inflate the report just as easily.
The U.S. September retail sales report released last night at 20:30 Taiwan time on 10/15 showed a 0.8% month-over-month increase. Sales at gas stations rose 6.4%; excluding gas stations, overall sales increased only 0.2%. This data is not adjusted for price changes, so the 0.8% figure cannot be treated directly as an increase in the volume of consumption.
The PPI released at the same time rose 1.3% month over month
post-image
The four-hour resistance level has not yet been decisively broken; wait for a bearish divergence on the one-hour timeframe, then look for an opportunity to enter a short position
post-image
#JapanAndKoreaStocksPlunge 🚨 Japan and Korea Stocks Plunge: Global Markets Face Fresh Pressure! 📉🌏
Global financial markets are experiencing renewed uncertainty as Japan and South Korea's stock markets suffer a sharp sell-off, highlighting growing concerns about inflation, interest rates, and the sustainability of the artificial intelligence investment boom.
On October 15, South Korea's KOSPI plunged approximately 7.6%, closing at 5,554.22, while Japan's Nikkei 225 fell nearly 5% during the session. Semiconductor companies and technology stocks faced particularly heavy selling pressure. 🇯�
Good morning!
U.S. CPI and PPI both came in hotter than expected, putting a rate hike this year back in focus!
With inflationary pressure picking up again, the Fed’s room to cut rates is limited, and the market has started reassessing the risk of a rate hike this year.
For Bitcoin, the key issue is not just whether rates are raised, but whether the U.S. dollar and Treasury yields will continue to strengthen. Once expectations for liquidity tightening take hold, BTC could come under pressure, while altcoins face even greater volatility risk.
However, a single upside inflation surprise is still
post-image
BTC+0.78%
#SpotGoldRecoversPostCPILosses
XAUT RISES TO $4,159.6: CAN GOLD EXTEND ITS RECOVERY AS INFLATION, PPI, AND THE FOMC TAKE CENTER STAGE?
Gold is showing renewed strength after experiencing selling pressure following the latest US inflation data. With XAUT (Tether Gold) recovering to $4,159.6, the market is once again balancing two powerful forces: persistent inflation, which could keep the Federal Reserve hawkish, and safe-haven demand, which continues to support gold during periods of economic and geopolitical uncertainty.
My view is that this recovery deserves attention, but traders should av
XAUT+0.21%
Sell $EPIC
at the current price. Entry range: 0.2582 - 0.2639Take-profit level 1: 0.2350Take-profit level 2: 0.2142Stop-loss level: 0.2771The asset remains in a clear downtrend, with the price below both MA7 and MA25 on the two timeframes. The RSI(6) on the 15-minute chart is 45.90, and the price still has ample room to continue falling, potentially dipping to the recent low of 0.2252 before finding strong support. Click here to trade 👇👇👇Noteworthy: $BTC : Current price 82,152.9 - 24-hour change: +0.69%$AKE : Current price 0.033442 - 24-hour change: +21.98%
post-image
EPIC-20.76%
BTC+0.78%
AKE+19.19%
When you want ChatGPT or Claude to help you execute on-chain operations involving funds, they often refuse, and nothing you say will change their mind.
At times like this, you can try the Cursor App: have ChatGPT or Claude write the prompt for you directly, then copy it over and execute it. Auto works—tested and confirmed
It’s been frozen solid since this morning. I forgot to take it out of the freezer.
post-image
$NEAR Current price: 5.305, up 8.84% in 24h, with a trading volume of 224.4M USDT; funding rate +0.0100%, with longs paying shorts, indicating that leveraged longs have become overcrowded. Technicals: MA5=5.3346 above MA20=4.94675, MACD histogram +0.05829 maintaining a bullish bias, but RSI=65.7 approaching the overbought zone, while the Bollinger upper band at 5.58677 presents short-term resistance. The 17.19% range over 30 candles shows frequent wick spikes. The Fear & Greed Index is 53, neutral with a warm bias, not yet at extreme greed, indicating that sentiment still has room to run. Over
post-image
MARSCOIN-5.77%
anyway all ragebait posts & misogynistic retweets aside;
- I remain bullish on HTF, Q4, 2027-2028
- I don't think we trade under 65-70k ever again, bear lows were in and I will ride my bottom buys into the end of decade
- Macro is a bit scary here, things could get choppy, nothing goes up in a straight line
- On macro point however, many headwinds right now that, for most of the time throughout history, usually resolve themselves and become tailwinds for risk/liquidity driven assets
- Spot and chill is key, have liquidity for high conviction trades, slam them hard when they come
- There will b
post-image
Someone asked me: Did last night’s needle finally bottom out?
$MU I’m not guessing; I’m just repeating what I saw
21:00 A single candle crashed to 860.33, with the heaviest volume among the 48 candles
(That pile of orders was swept away, not sold)
22:00 A bullish candle filled half the hole back in
At 4 a.m., it touched 934.56 and bounced without much delay
Now at 914.96, just 1.5% above the 20-day moving average at 901.467
Further up is 965.72, left behind the day before yesterday
A bottom isn’t guessed; it’s defended
If 901.467 can’t hold, that needle to 860.33 was for nothing
Only after rec
post-image
MU+2.05%
Load More

Join 40 M users in our growing community

⚡️ Join 40 M users in the crypto craze discussion

💬 Engage with your favorite top creators

👍 See what interests you

Trending Topics

USSeptemberPPIBeatsExpectations

91.35k Views1.89k Discussing

US September PPI came in at 6.3% YoY, well above the 5.3% market expectation, pointing to renewed producer-side inflation pressure. Weekly jobless claims were 199K, broadly in line with forecasts. Could hotter inflation further reduce room for rate cuts, and what does it mean for $BTC, US stocks, and gold?

DrLinHanSpeaksAtOxfordUnion

135.63k Views1.86k Discussing

JapanAndKoreaStocksPlunge

47.27k Views1.76k Discussing

View More