Share your thoughts
placeholder
Article
I originally only wanted to mooch a breakfast, but the market ended up serving me dumplings for half a year.
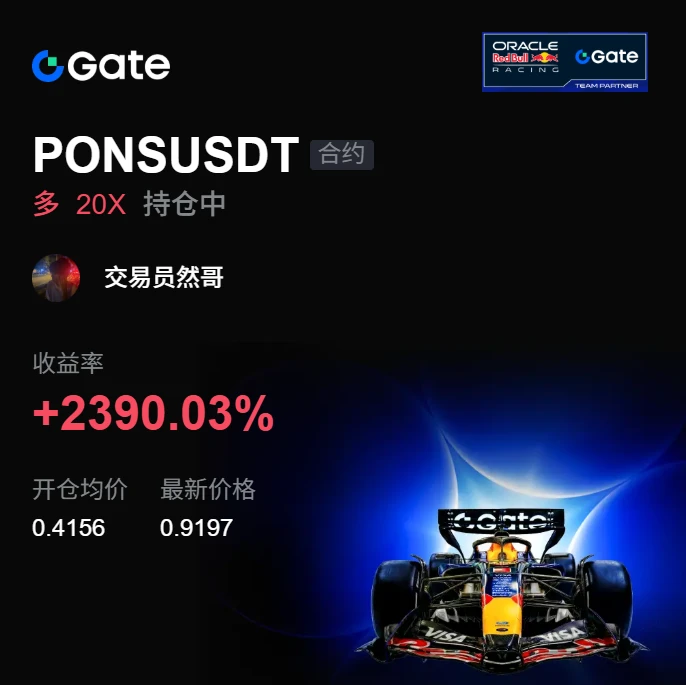
A few days ago, when that late-night pullback hit, to be honest, many people were shouting that the level had broken. I kept staring at the $PONS /PONS chart, and the key level hadn't broken at all; instead, volume kept tightening and stabilizing. I posted one sentence at the time: Bottom consolidation isn't weakness—it's funds quietly accumulating. I entered a long position at 0.4156 and ground my way up to 0.9197, with paper profits surging straight to +2385.29%. I'm not going to brag
post-image
PONS+26.44%
ADA+3.65%
ZEC+1.59%
$907,000 A certain trader made two FOMO trades i, resulting in a total loss of $907,000
live-cover
LIVE1,708
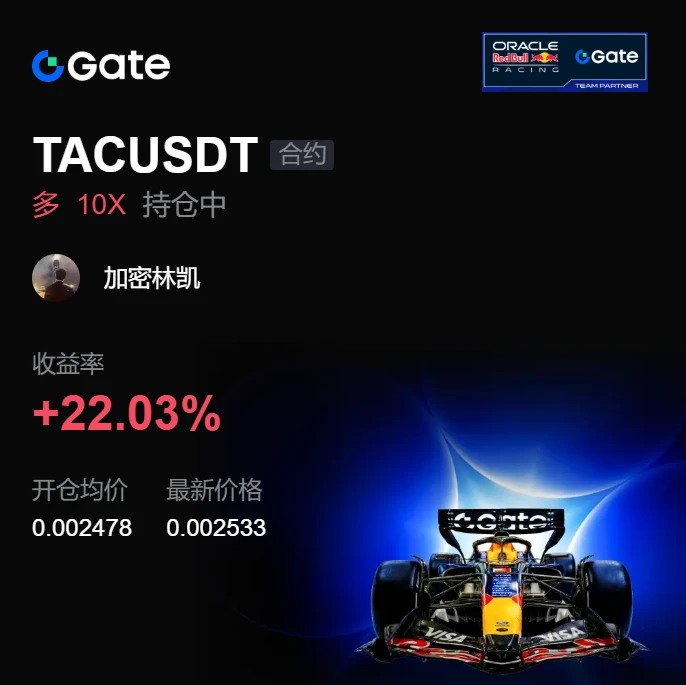
I originally just wanted to mooch a breakfast, but the market ended up making dumplings out of me for half a year. I opened the charts this morning, and before my eyes were even fully open, I saw the price bubbling up on its own. A few days ago, while watching the market in the early hours, $TAC had been moving sideways at the bottom. Everyone was waiting and watching. I stared at the order book for a while and saw funds entering slowly but steadily, with small orders constantly providing support at the bottom. In situations like this, I don't hesitate—I reached in and bought some around 0.002
post-image
TAC-5.19%
ZEC+1.59%
LAB+0.51%
$GT is showing strong bullish momentum on the daily chart.
Price is up over 10% around $9.28 after breaking out from the recent $8.00 area.
Key levels I’m watching:
• Resistance: $9.67–$10.00
• First support: $8.80–$9.00
• Major support: $8.00–$8.20
If $GT can hold above $9.00 and break the recent $9.67 high, the next leg higher could open up.
For now, buyers clearly have momentum, but after such a strong move, a retest would be normal.
#GT #GateToken #Crypto
GT+10.20%
  • 6
  • 1
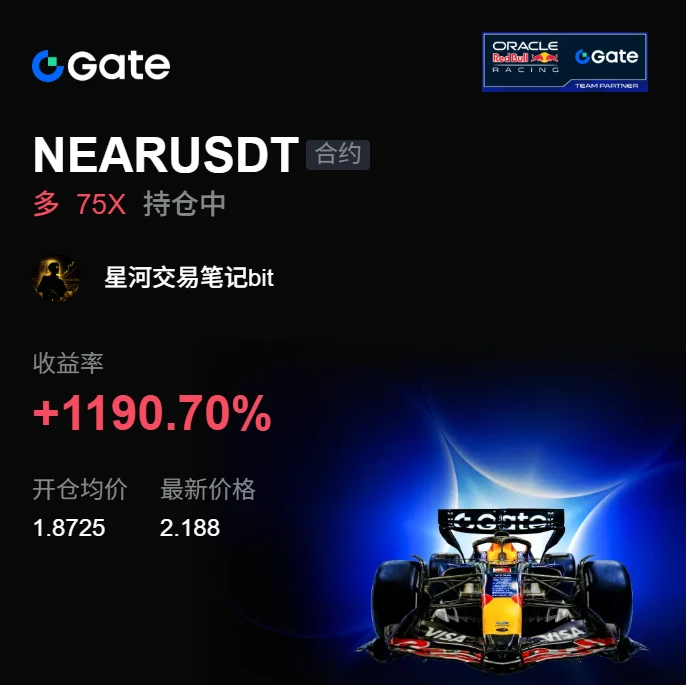
This time, what I think was most crucial in holding onto the $NEAR long was splitting the take-profit into several stages instead of waiting for one key level.
The entry price was around 1.8725. When it rose to the first target, I closed 30% first, instantly lowering the cost basis of the position. I set a protective stop for the remaining 70% and patiently waited for higher levels. Honestly, no one can guarantee selling at the key level. Locking in part of the profit and letting the remaining position continue to run actually makes it easier to hold the trade steadily.
There was one quick pul
post-image
NEAR-1.51%
ETH+1.21%
SOL+1.58%
Everyone’s staring at $LAB /USDT’s green candles—but the 4h tape just whispered something they’ll ignore until it’s too late.

$LAB /USDT - SHORT

Trade Plan:
Entry: 0.07433 – 0.07479
SL: 0.07676
TP1: 0.07291
TP2: 0.07182
TP3: 0.07017

Why this setup?
- 95% confidence SHORT while the crowd buys the bounce.
- 1D trend is bearish; this dip is a retest, not a reversal.
- RSI 15m at 43.66 = weak relief, no momentum shift.
- Entry 0.07456 with TP1 at 0.07291—that’s 2.2% before you blink.
- Why now? ATR (0.000915) says volatility is coiling; the next push down is the expansion leg.

Deba
LAB+0.51%
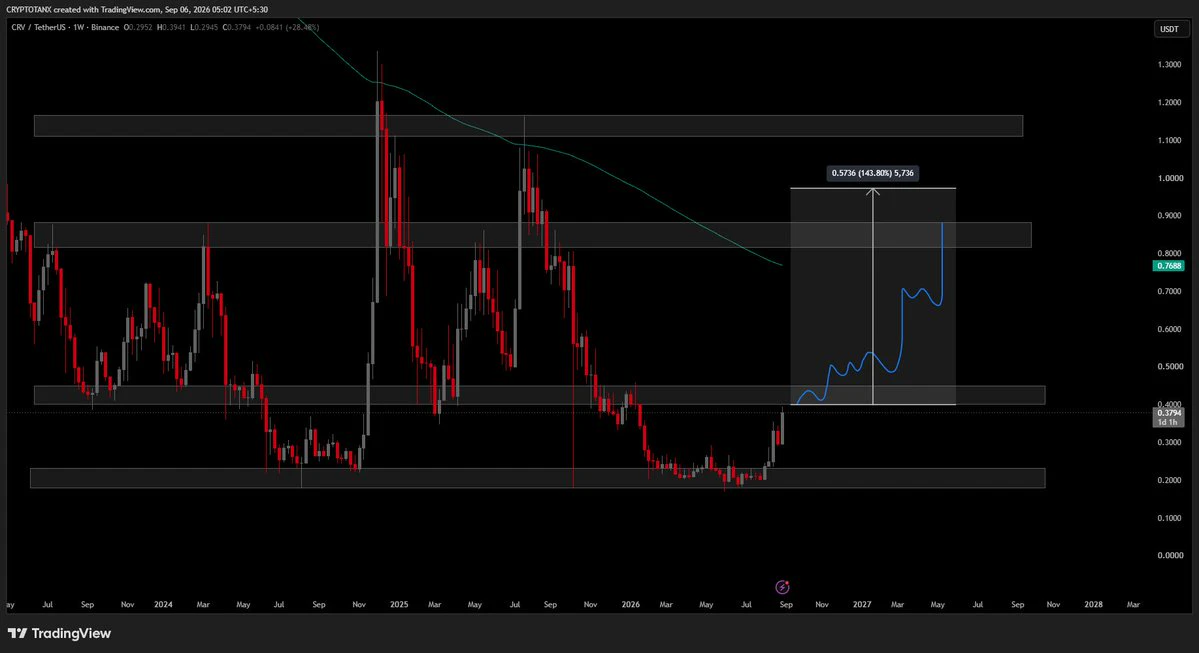
📊 $CRV looking interesting.
The level to watch is $0.40–$0.45 on the weekly.
• Flip + hold ✓ → 1W 200EMA next
And if $CRV flips the 1W 200EMA into support, then $1.0–$1.4 comes into play for the med term. 📈✍️
#CRV #CRVUSDT #Curve #Alts #Crypto
post-image
CRV+8.93%
Keep holding the $UNI contract—you’re sure to achieve financial freedom. Don’t let yourself get shaken out.
UNI+16.52%
Everyone’s chasing longs on $SOL /USDT, but the 4h tape is quietly whispering a different name.

$SOL /USDT - SHORT

Trade Plan:
Entry: 103.08 – 103.44
SL: 104.95
TP1: 102.00
TP2: 101.15
TP3: 99.89

Why this setup?
- Price is pinned at 103.26 with a SHORT bias (55% confidence) while the 1D trend is *range*, not breakout.
- RSI on the 15m sits at 47.6—no momentum behind the bid, just dead air.
- ATR (1h) is a tight 0.70, meaning the next move will be violent when it comes.
- Why now? We’re sitting at the exact entry ref with invalidation at 102.46—if that cracks, the path to TP1 (102.0
SOL+1.58%
Everyone’s watching 80K, but I’m watching the 4h chart bleed—$BTC /USDT is about to fake you out.

$BTC /USDT - SHORT

Trade Plan:
Entry: 79698.9 – 79816.3
SL: 80321.3
TP1: 79334.9
TP2: 79053.0
TP3: 78630.3

Why this setup?
Why now? The 1D is rangebound, yet the 4h structure is cracking. RSI on the 15m is at 43 and falling—no bounce fuel. ATR is tight (234), meaning the breakout is coming, not optional. Entry at 79,757 with TP2 at 79,053 is a 0.9% scalp, but the real edge is the invalidation at 79,079. If that breaks, the short thesis is dead. This is a low-confidence trap (55%), so size do
BTC+0.30%
No big-picture thinking, can't hold, the profits on this move are paper-thin, but I absolutely love it. $LIT quietly made a move like this, and thankfully I wasn't shaken out.
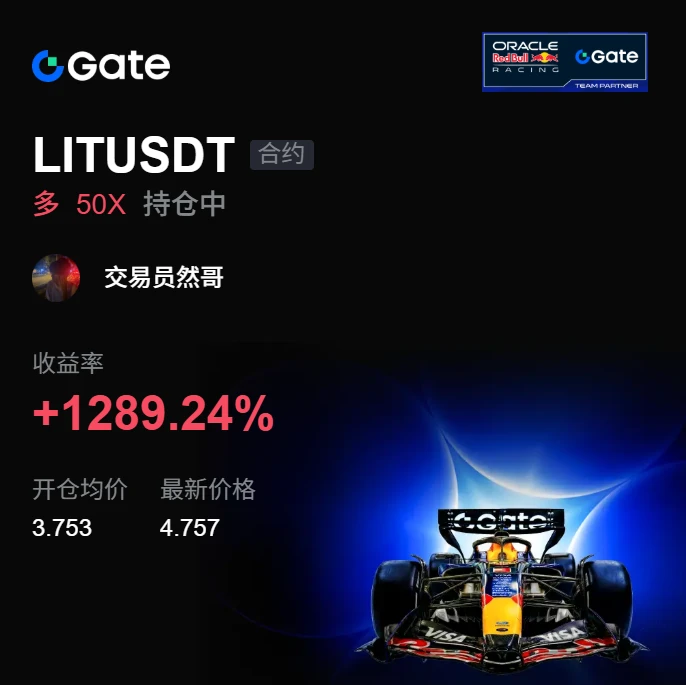
When I checked the charts after lunch, I watched the pullback level and felt that it couldn't drop any further. The volume had also dried up, as if it were building strength. So I added to my position around 3.753, and the price has now reached 4.757, with unrealized gains already hitting +1287.96%. It was truly sluggish at first, but the move is truly sweet now. I can afford a good meal.
Don't let profits inflate your e
post-image
LIT-2.24%
DOGE+6.34%
BTC+0.30%
Crypto Signals and Trding Insights
live-cover
LIVE1,373
Everyone’s watching the range, but the real money is hiding in the 4h squeeze—$BTC /USDT is about to pick a side.

$BTC /USDT - SHORT

Trade Plan:
Entry: 79699.84 – 79817.26
SL: 80322.21
TP1: 79335.80
TP2: 79053.97
TP3: 78631.22

Why this setup?
Why short now? The 4h structure is armed with a 55% confidence SHORT, not a breakout.
- Price is pinned at 79,758, but the 1D trend is just a range—no bullish conviction.
- RSI on the 15m (47.61) is weak, not oversold, leaving room to drop.
- ATR (234) is tight—volatility is coiling, and TP1 at 79,335 is the first magnet.
This isn’t a chase;
BTC+0.30%
Tokenized stocks are on fire! 🔥 August saw a whopping $3B in weekly volume, driven by Robinhood and Solana. What’s fueling this surge, and how might it change trading? 🤔 $SOL #CryptoMarket
SOL+1.56%
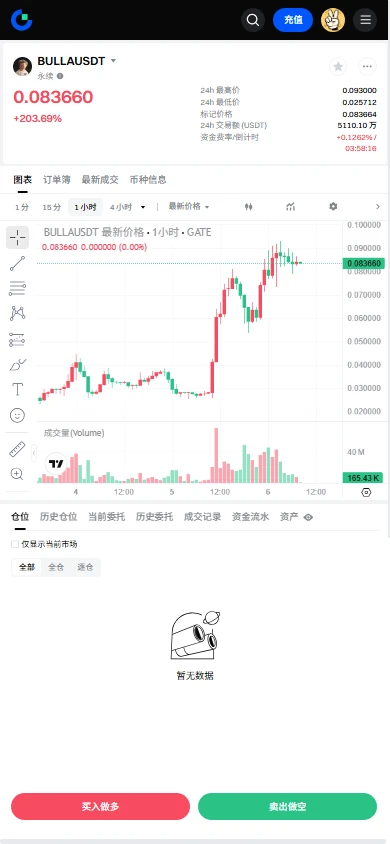
【$BULL Signal】Funding rate at 0.14%, relatively high; target short-term longs amid 1H high-level consolidation
$BULL Funding rate at 0.1406%, with extremely high long holding costs. After surging to 0.0924 on the 1H timeframe, price fell back to around 0.0816, with buy-side depth imbalance at -12.89% and sell orders slightly dominant. The 4H MACD histogram has contracted continuously, indicating weakening momentum. The 1H MACD histogram is 0.0001, moving along the zero axis. In terms of order-book depth, the Bid/Ask depth ratio is 0.77, indicating average buying support. The current price is n
post-image
BTC+0.29%
ETH+1.17%
SOL+1.56%
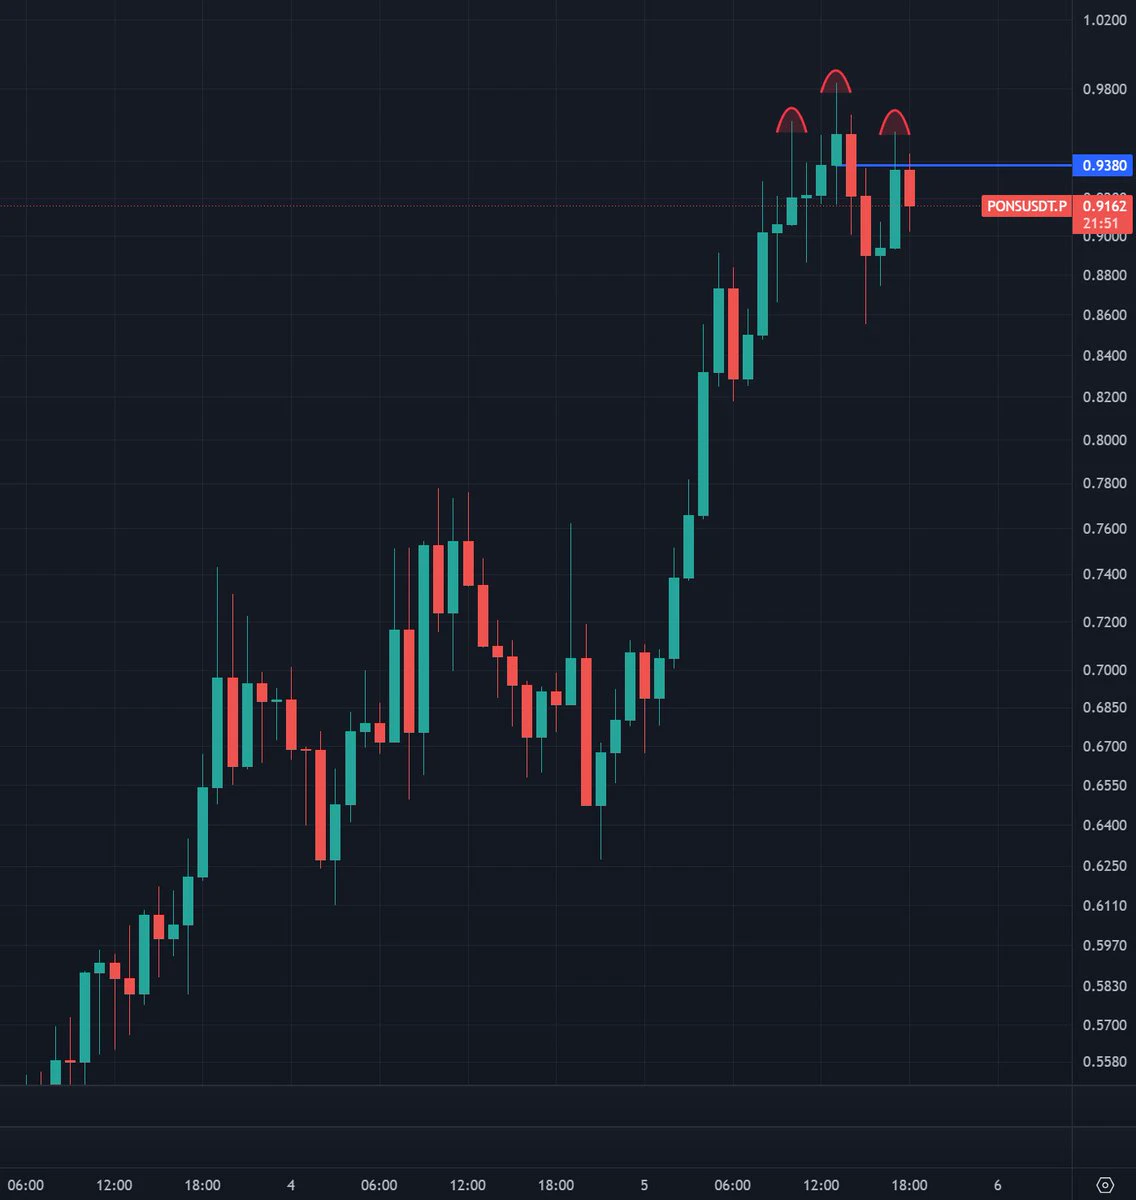
First signs of weakness on this massive PONS move. I think it would be good if it consolidated/pulled back here, that money flows into other tokens on RH chain and then we repeat with another leg up later.
Same as the BTC stalls > alts run loop we usually do, but RH specific.
post-image
PONS+26.57%
BTC+0.29%
Most traders will fade this silver short at 66.22—that's exactly why it works.

$XAG /USDT - SHORT

Trade Plan:
Entry: 66.19 – 66.25
SL: 66.49
TP1: 66.02
TP2: 65.88
TP3: 65.68

Why this setup?
Why now? The 4h frame is screaming exhaustion while the daily sits dead-center in a range. RSI on the 15m is already at 34.69—momentum is bleeding, not bouncing. The setup is armed with tight risk: entry 66.22, invalidation just 0.57 above at 66.79. That's a 1:3+ reward-to-risk to TP2 at 65.88. The range top is rejected; the path of least resistance is down.

Debate:
If silver closes back above 66.49
XAG-0.06%
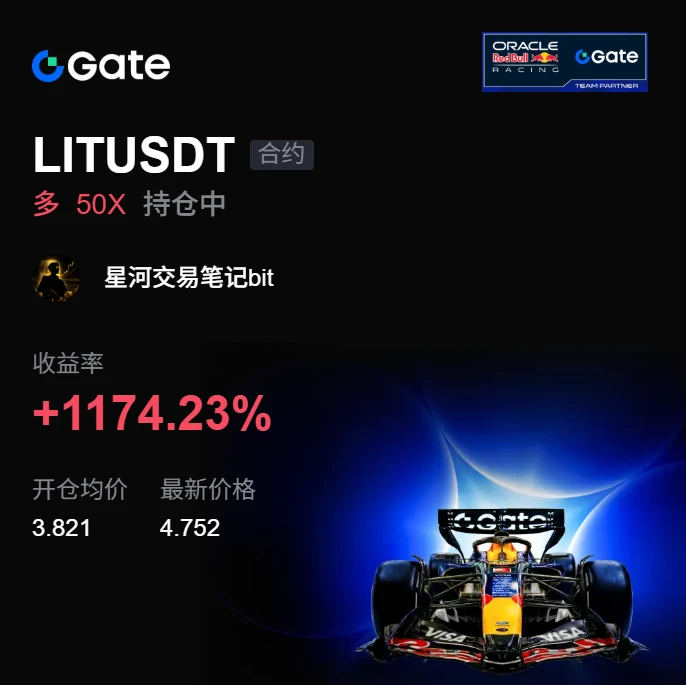
This rebound in $LIT has honestly been stronger than I expected. After the earlier wick swept out the stop-losses on several of my long positions, the price pulled back up and firmly reclaimed the key level. But compared with predictions, I care more about how to respond. With unrealized profit reaching +1175.49%, I took profit and exited 70% of the position first, and moved the protection level on the remaining 20% above the entry price. The reason is simple: the higher it goes, the more we need to watch out for false breakouts and profit-taking.

The price is now around 4.752. As for wheth
post-image
LIT-2.24%
ADA+3.65%
ZEC+1.59%
I didn’t enter immediately during the first wave of decline because after this kind of rapid sell-off, there is often an exaggerated rebound, and chasing shorts can easily result in getting stopped out badly. So at the time, I only marked a key zone at the highs and didn’t rush to act. The price did rebound afterward as expected, but near the key zone, it failed to show the rebound strength it should have had, with each lower-timeframe candlestick weaker than the last. Only then did I enter short in the direction of the decline. Since the entry was relatively close to the key zone, setting the
post-image
ETH+1.21%
BNB+6.59%
Everyone’s watching $MU /USDT for a breakout—but the 4H chart just whispered a secret the crowd missed.

$MU /USDT - SHORT

Trade Plan:
Entry: 1015.38 – 1017.00
SL: 1026.36
TP1: 1008.56
TP2: 1003.48
TP3: 995.86

Why this setup?
- RSI (15m) at 47.92—no momentum spike, just sideways exhaustion.
- ATR (1H) at 3.25 shows shrinking volatility, priming for a sharp squeeze lower.
- 1D trend is *range*—so we’re not chasing; we’re fading the top of the box at 1016.19.
- TP1 at 1008.56 is 0.75% away; TP2 at 1003.48 is the real magnet if 1015 support cracks.

Debate:
Is 1016 the fake ceiling be
MU+0.28%
Load More

Join 40 M users in our growing community

⚡️ Join 40 M users in the crypto craze discussion

💬 Engage with your favorite top creators

👍 See what interests you

View More