


Square
Following
Hot
News
Profile
Share your thoughts
placeholder
Article
🚀🏆 GATE WCTCS9 GLOBAL TRADING COMPETITION — THE ULTIMATE TRADING CHALLENGE IS HERE! 🌍📈
The excitement is building as the #GateWCTCS9GlobalTradingCompetition brings the spotlight to global trading, market strategy, and competitive performance! 🔥 Traders around the world are always searching for opportunities to sharpen their skills, test their strategies, and demonstrate their ability to navigate fast-moving financial markets. Competitions like this create an exciting environment where preparation, discipline, and smart decision-making take center stage.
🌎 A GLOBAL STAGE FOR TRADING AMBIT
post-image
  • 2
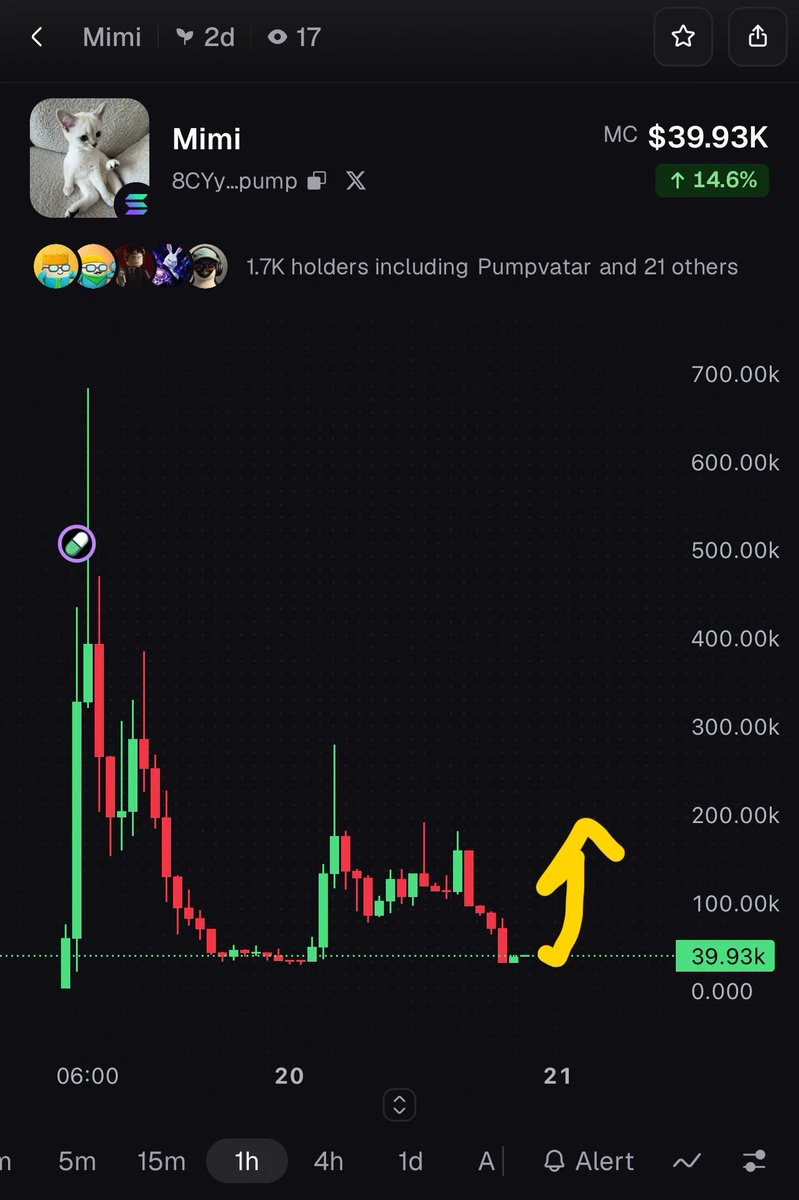
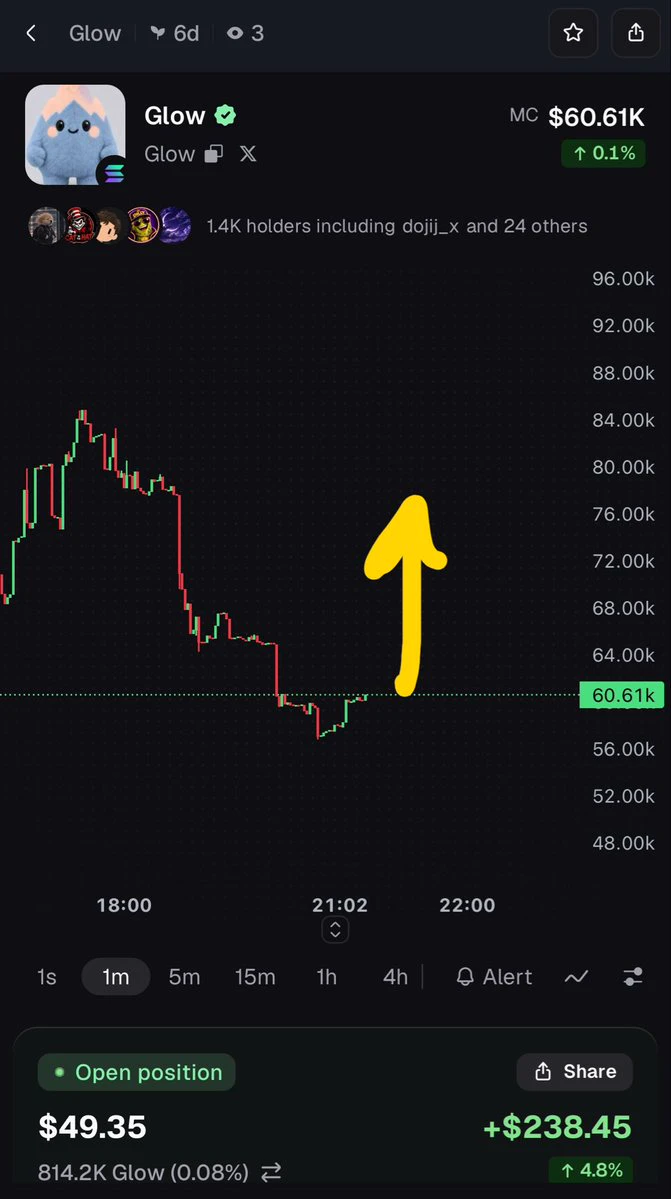
solana:EEpng77ZPn9FT4xsRjwuxNCcMBYq3HTwEscyTpump buy now big break out is near
This is another solana:Hg5Ja55T5wESq4vyFoiVCMeHXtGyVA69X2UHq8hgpump coin it will 10x
post-image
SOL-0.75%
Trenches
AGT
A
bade
b
AGT
0x5d...e274
Market Cap
$.
Change
.
24h Vol
$.
Holders
.
CNPY
C
bade
b
CNPY
0xc6...ddd2
Market Cap
$.
Change
.
24h Vol
$.
Holders
.
Q
Q
bade
b
Q
0xc0...0589
Market Cap
$.
Change
.
24h Vol
$.
Holders
.
Gato
G
bade
b
Gato
55A3...pump
Market Cap
$.
Change
.
24h Vol
$.
Holders
.
DOPE
D
bade
b
DOPE
0xf9...8899
Market Cap
$.
Change
.
24h Vol
$.
Holders
.
#每周来晒 #美国9月PPI大超预期 #沃什IMF讲话 Brent crude has surged past $110. U.S. stocks and Bitcoin should be on alert ahead of November 3
What happens if oil prices keep rising, AI stocks begin to correct, and U.S. inflation refuses to come down?
Any one of these factors on its own may not trigger a major sell-off. But if they converge around the November 3 U.S. midterm elections, the market could face a difficult stress test.
01 The real trouble is oil pushing inflation higher again
Brent crude has broken above $110 per barrel. This price warrants caution because crude oil is no ordinary commodity: its
post-image
ThisIsTranslateContent:
#美国9月PPI大超预期 #沃什IMF讲话 Brent crude breaks above $110; U.S. stocks and Bitcoin should be cautious before November 3
What happens if oil prices keep rising, AI stocks start correcting, and U.S. inflation remains stubbornly high?
Each of these factors alone may not necessarily trigger a major sell-off. But if they converge around the November 3 U.S. midterm elections, the market could face a challenging stress test.
01 The real problem is oil pushing inflation higher again
Brent crude has broken above $110 per barrel. This price warrants caution because crude oil is not an ordinary commodity: its effects ripple throughout the economy through transportation, production, chemicals and consumer spending.
More importantly, U.S. CPI rose 3.7% year over year in September, while gasoline prices jumped 9.1% month over month. The simultaneous rebound in inflation and rise in energy prices have prompted markets to reconsider whether the Federal Reserve needs to maintain its restrictive policy. Here lies a key tension. If oil prices spike briefly and then fall, markets may quickly absorb the negative impact; but if geopolitical conflicts persist and oil prices remain elevated, inflation could prove more persistent than expected.
This would make the Fed's choices more difficult: cutting rates could prolong inflationary pressures, while keeping rates high could weigh on the economy and asset valuations. So what concerns us more than oil rising 3.6% on any given day is whether high oil prices will change market expectations for interest rates over the coming months.
02 AI valuations and high interest rates could reinforce each other
AI has been one of the most important drivers of the latest U.S. stock market rally. The market has been willing to assign high valuations to companies involved in chips, cloud computing and data centers because investors believe their revenue and profits will continue to grow.
But two questions need answering now: How much return will AI investment actually generate? If financing costs keep rising, are those returns still worth today's stock prices?
Reuters reported on October 15 that confidence in further gains for U.S. stocks depends heavily on strong earnings from large technology companies. Meanwhile, rising oil prices and Treasury yields are also putting pressure on high-valuation assets. This means that even if the AI industry's long-term direction remains unchanged, stock prices could first go through a valuation contraction. If technology companies report better-than-expected results, the market could still recover; if earnings disappoint while interest rates rise, the correction may be more than a short-term swing in sentiment.
03 Could the November 3 midterm elections become a black swan?
The election itself is not necessarily a black swan; the real risk to watch for is a gap between the election outcome and market expectations.
The U.S. midterm elections will determine control of Congress. Different outcomes could affect fiscal policy, tariffs, AI regulation and the progress of cryptocurrency legislation. For the crypto industry in particular, the pace of digital asset regulatory policy is worth watching.
But changes in congressional seats do not mean all U.S. policies will change immediately. The executive branch still has considerable policy tools at its disposal, and the specific impact will also depend on subsequent legislation and implementation.
What could truly catch markets off guard is a scenario in which investors expect the election to bring policy moderation, but the result instead creates greater policy uncertainty; or in which energy prices keep rising, increasing pressure on the government over inflation and the cost of living. If markets have already bet on a particular election outcome and the result fails to meet expectations, crowded positions could be unwound all at once.
04 What could happen to Bitcoin?
In the short term, Bitcoin should not simply be treated as a safe-haven asset. If oil prices continue to rise, inflation rebounds and the Fed sends a more hawkish signal, both technology stocks and crypto markets could come under pressure.
Bitcoin also faces an additional risk: liquidations of leveraged positions could amplify a decline. Conversely, if geopolitical tensions ease, oil prices fall and markets confirm that the Fed will not tighten policy further, risk assets could rebound quickly.
So, over the coming weeks, focus on four indicators: Brent crude prices, U.S. two-year Treasury yields, U.S. technology companies' earnings performance, and Bitcoin ETF flows and changes in futures-market leverage. These are more useful than simply guessing the outcome of a particular election.
05 How should you respond?
Volatility risks in U.S. stocks and crypto markets may rise for a while, but that does not mean a bear market is inevitable. If oil prices fall, yields stabilize and companies deliver on earnings, the market could still recover; if oil prices stay high, rate expectations continue to rise and AI earnings fall short of expectations, the market could face a deeper correction.
For investors, keep some cash on hand, manage leverage, and don't rush to buy the dip after a single decline or easily dismiss the value of long-term assets when markets panic.
The real risk to watch for is not any single negative factor, but several risks that could otherwise be absorbed separately happening at the same time. Treat the period before November 3 as an event window that warrants close attention, not as a predetermined market turning point. Going forward, watch oil prices, interest rates and earnings. The data will show where the market ultimately goes.
repost-content-media
BZ-0.76%
BTC-0.96%
GAS-2.41%
#KOSPIJumps3.3% #ShareWeekly
KOSPI Rebounds After a 7.6% Crash: Is the Semiconductor Sell-Off Over, or Is More Volatility Ahead?
The Asian stock market experienced a dramatic shift on October 15–16, 2026, as semiconductor stocks came under heavy selling pressure before staging a partial recovery. South Korea’s KOSPI index suffered a sharp 7.6% decline on October 15, dropping to 5,554 points and triggering a circuit breaker. The index touched its lowest level since April, highlighting how quickly market sentiment can change when inflation concerns, interest-rate expectations, and uncertainty s
SK Hynix+0.79%
JPN225+0.29%
NAS100-0.42%
CXMT-0.81%
The most unusual detail in today’s market: $ZEC fell just 0.99% in 24 hours, yet its range reached 7.56%. The price repeatedly tested the lower Bollinger Band at 1111.11, while the funding rate remained positive at 0.0058%—longs are paying to hold positions, and shorts are not crowded. This combination of “small decline + high volatility + positive funding rate” suggests that positions are changing hands rather than being flushed out, and volatility is being underestimated.
Technical outlook: MA5=1127.15 is below MA20=1151.07, the MACD histogram at -1.335 remains bearish, and RSI=43.6 is in t
post-image
TIA-7.57%
🌈 Gate Live Livestreaming Inspiration - October 18
Trending Topics:
🔹 Vitalik compares BTC mining and AI inference costs: electricity accounts for nearly half the cost of the former, while the latter relies more on capital expenditure for computing power
🔹 Arthur Hayes: The so-called quantum threat to crypto is “nonsense”; users only need to pay attention to wallet management
🔹 A new angle on AI anti-fraud: get scammed on purpose to gather intelligence on scammers for regulators to crack down on them
🔹 Iranian armed forces open fire to intercept vessels making “unauthorized” passages thro
post-image
BTC+0.13%
  • 9
  • 3
#每周来晒 #美国9月PPI大超预期 The week after the double inflation beat: what the market actually did
Two hot inflation reports landed in two days, and the verdict is in. Stocks fell, bonds steadied, the Fed odds cooled and Bitcoin held its ground. Here is the final scorecard as of Sunday, October 18, followed by an if-then framework for next week.
What the data said
September CPI rose 3.7% against 3.6% expected, and producer prices rose 1.3% on the month and 6.3% on the year. The surprise sat in the details, since core PPI rose 0.7% against a 0.3% forecast.
How each market responded
US stocks: tech took
BTC+0.13%
MU-5.66%
AMD-5.98%
DOW+0.96%
GLD-0.16%
$CAKE Current price: 2.19. Key short-term levels are 2.157 (Bollinger lower band) and 2.1967 (MA20). In terms of moving averages, MA5=2.1936 remains below MA20, indicating a weak bearish alignment, but the gap is only 0.003, and the convergence of the moving averages means a directional move is approaching; the MACD histogram at -0.002064 is bearish, but its absolute value is extremely small, suggesting momentum is nearly exhausted; RSI at 48.0 is in neutral-to-weak territory, with neither oversold rebound momentum nor overbought pullback pressure; the price is near the Bollinger lower band a
post-image
CAKE+0.82%
LSK+12.67%
ERA+17.26%
Are you going to meet your online date in person?
You’re dressed so cute.
Jensen Huang: Current market turmoil will pass, AI will bring change
live-cover
LIVE2,305
Most people are focused on a tariff breakthrough. I think the market will drop first. The court has ruled, but the tariff agenda isn’t dead—it’s just lost its easiest path. After doing this for so long, I know position sizing is always more important than calling direction. Let’s compare notes this weekend.
post-image
#GateBTCAndETHFuturesVolumeRanksTop3
Gate BTC and ETH Futures Trading Volume: Can the Momentum Continue?
In my view, the momentum Gate is seeing in the derivatives market could persist; however, sustainable growth depends on whether this increased trading activity is driven by lasting demand rather than mere short-term speculation.
The reported figures are encouraging: with BTC and ETH in an uptrend, Gate ranks among the top three exchanges globally for futures trading volume in both assets, with BTC futures volume reaching approximately $7.18 billion over a 24-hour period.
Nevertheless, high
BTC+0.13%
ETH-0.51%
GT-2.52%
XTIUSD+2.67%
TSLA-2.17%
  • 8
2015 — Buy
2016 — Hold
2017 — Sell
2018 — Bear market
Cycle 3 (2019-2022)
2019 — Buy
2020 — Hold
2021 — Sell
2022 — Bear market
Cycle 4 (2023-2026)
2023 — Buy
2024 — Hold
2025 — Sell
2026 — Bear market ← We are right here
Cycle 5 (2027-2030)
2027 — Buy
2028 — Hold
2029 — Sell
2030 — Bear market
post-image
  • 1
Crypto Trade Today
live-cover
LIVE896
For subscribers, I placed a long order at 2365, but I accidentally placed mine at 2355—ugh!
  • 1
Last month altcoins against $BTC closed first whole monthly candle above the bull market support band.
This month retesting ✅
Look where we are 👇🏼
Next 6 months will be good 💵
#OTHERS
BTC+0.13%
#日韩股集体大跌
KOSPI +3.3%: A relief bounce or the start of a recovery?
My initial assessment: This appears to be a potential relief rally; however, a single strong session is not enough to confirm a broader recovery. The key question is whether semiconductor stocks can sustain this rebound following the sharp sell-off, or if the gains are merely driven by short covering and bargain hunting.
The gains seen in Samsung Electronics (+3.6%) and SK Hynix (+3.4%) are particularly significant, as the South Korean market is highly sensitive to semiconductor sentiment and the global AI-memory trade.
What is
post-image
ybaser
#日韩股集体大跌
KOSPI +3.3%: A relief bounce or the start of a recovery?
My initial assessment: This appears to be a potential relief rally; however, a single strong session is not enough to confirm a broader recovery. The key question is whether semiconductor stocks can sustain this rebound following the sharp sell-off, or if the gains are merely driven by short covering and bargain hunting.
The gains seen in Samsung Electronics (+3.6%) and SK Hynix (+3.4%) are particularly significant, as the South Korean market is highly sensitive to semiconductor sentiment and the global AI-memory trade.
What is driving the recovery?
1. The sell-off may have overshot the fundamentals
On October 15, the KOSPI fell by 7.57%, closing at a six-month low following seven consecutive days of losses. During this sell-off, Samsung and SK Hynix lost 23.9% and 31.5% of their value, respectively—creating an opening for bargain hunters to return.
2. Memory chip fundamentals remain supportive
Analysts continue to highlight tight memory supply, robust demand related to artificial intelligence, and expectations for rising DRAM prices. This supports the view that the sell-off was driven more by sentiment and positioning than by a collapse in earnings expectations.
3. Global risk appetite has improved
A recovery in U.S. equities, combined with easing concerns regarding AI-related credit risks, has helped fuel a rebound in Asian technology stocks. However, concerns regarding returns on investment in artificial intelligence, financing costs, and interest rates have not dissipated.
A relief rally or a sustainable recovery?
Bullish scenario — a lasting recovery
* The KOSPI remains above its recent low.
* Samsung and SK Hynix continue their recovery.
* Foreign investors return as net buyers.
* Earnings forecasts and expectations for memory chip prices remain robust.
Bearish scenario — a short-lived rebound
* The index rises toward a resistance level and then reverses.
* Foreign investors continue to sell Korean stocks.
* U.S. bond yields rise, or renewed concerns regarding AI valuations weigh on chip stocks.
* Samsung and SK Hynix fall back below their recovery levels.
What should investors watch for next?
The most critical indicator is not the magnitude of the initial rebound, but whether buying pressure is sustained.
Indicator Bullish interpretation
Foreign investor flows Consistent net buying
Samsung and SK Hynix Gains sustained over several sessions
Memory chip pricing Continued strength in DRAM and HBM
U.S. Treasury yields Stabilization or decline
Earnings expectations Maintenance of upward revisions
A key distinction: On October 16, the KOSPI recorded an intraday gain of up to 3.17%, but closed the day up 2.05% at 5,668.05. Consequently, the sharp intraday rally made the final gain at the close appear more significant than it actually was.
My View
Short-term: Cautiously optimistic
A recovery is possible.
Oversold conditions and attractive entry points could support further gains, though volatility is likely to remain high.
Medium-term: Conditional
Not yet confirmed.
A more substantial recovery would require the stabilization of foreign investor inflows, supportive earnings data, and a more durable improvement in sentiment toward the global technology market.
In summary: I view the 3.3% move not as proof that the downtrend has ended, but as a promising first step. Earnings expectations for the semiconductor sector provide a firmer foundation for this recovery—moving it beyond a mere technical rebound—but the market must demonstrate that buyers are willing to hold their positions, even amidst renewed volatility.
A key factor to watch in the near term will be the earnings outlooks from SK Hynix and Samsung Electronics, set to be released on October 28 and October 29, respectively. These reports could prove decisive in determining whether the recent sell-off was an overreaction or if it reflects a more fundamental reassessment of the AI-driven memory market.
$MU ‌
$SNDK ‌$NVDA ‌
repost-content-media
  • 7
  • 1
BREAKING: Meta's Muse Wonder and Muse Spark are now live on Venice, available privately. Venice also added NVIDIA's Nemotron 3.5 Super VL and Tencent's Hy4 Preview since October 15.
@AskVenice
NVDA-1.42%
TENCENT+0.00%
Load More

Join 40 M users in our growing community

⚡️ Join 40 M users in the crypto craze discussion

💬 Engage with your favorite top creators

👍 See what interests you

Trending Topics

USSeptemberPPIBeatsExpectations

91.35k Views1.93k Discussing

US September PPI came in at 6.3% YoY, well above the 5.3% market expectation, pointing to renewed producer-side inflation pressure. Weekly jobless claims were 199K, broadly in line with forecasts. Could hotter inflation further reduce room for rate cuts, and what does it mean for $BTC, US stocks, and gold?

GateWCTCS9GlobalTradingCompetition

37.87k Views6.69k Discussing

GateBTCAndETHFuturesVolumeRanksTop3

53.8k Views1.82k Discussing

View More