
Square
Following
Hot
News
Profile
Share your thoughts
placeholder
Article
Viewing BTC’s market today through the lens of mindful awareness: price simply reflects reality; gains and losses stem from the choices of the mind.
Don’t fixate on direction or bet on a one-way move. Wait for confirmation signals and strictly adhere to stop-loss limits.
Watch the market outwardly and your mind inwardly; don’t let short-term volatility sway your emotions.
Opportunities come in their own time; patience is a fundamental skill for an aware trader.
#BTC #觉照交易法
post-image
BTC+0.11%
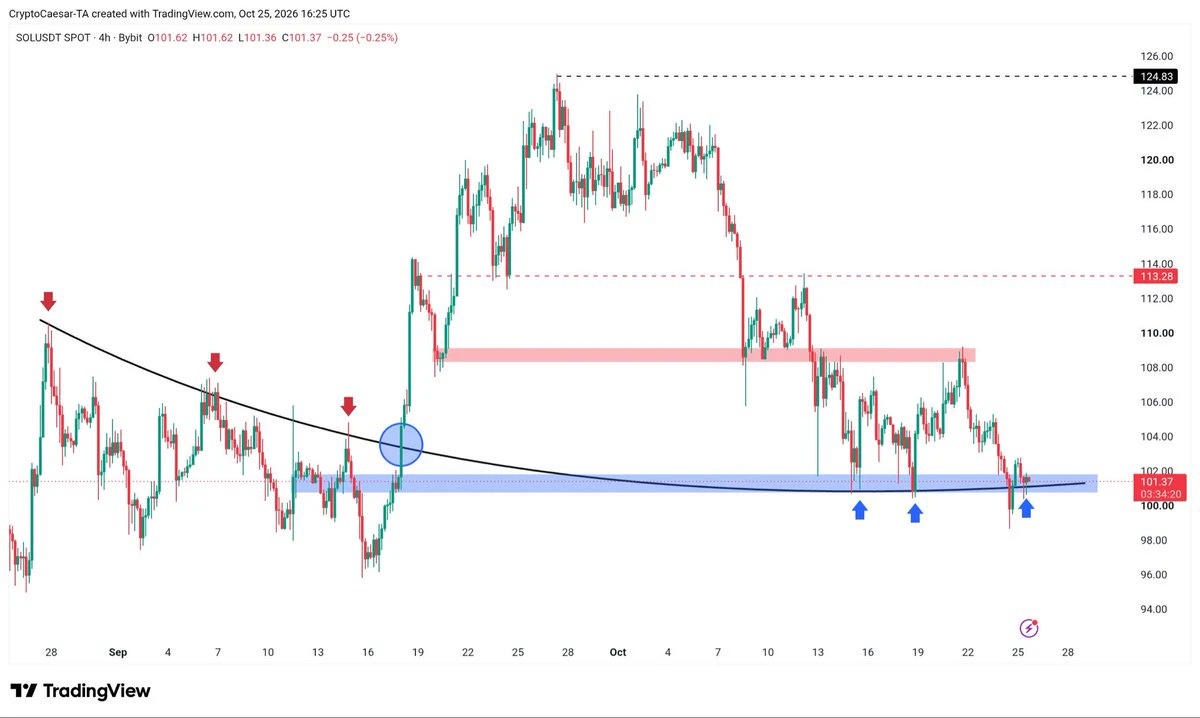
$SOL testing support on the 4H chart right now. Not a bad buying zone imo.
post-image
SOL+0.64%
Trenches
STONK
S
bade
b
STONK
6GmA...UNgx
Market Cap
$.
Change
.
24h Vol
$.
Holders
.
BTC
B
bade
b
BTC
C5xp...pump
Market Cap
$.
Change
.
24h Vol
$.
Holders
.
CNPY
C
bade
b
CNPY
0xc6...ddd2
Market Cap
$.
Change
.
24h Vol
$.
Holders
.
ZIG
Z
bade
b
ZIG
0x8c...1145
Market Cap
$.
Change
.
24h Vol
$.
Holders
.
LAUNCH
L
bade
b
LAUNCH
AhBi...Qj6C
Market Cap
$.
Change
.
24h Vol
$.
Holders
.
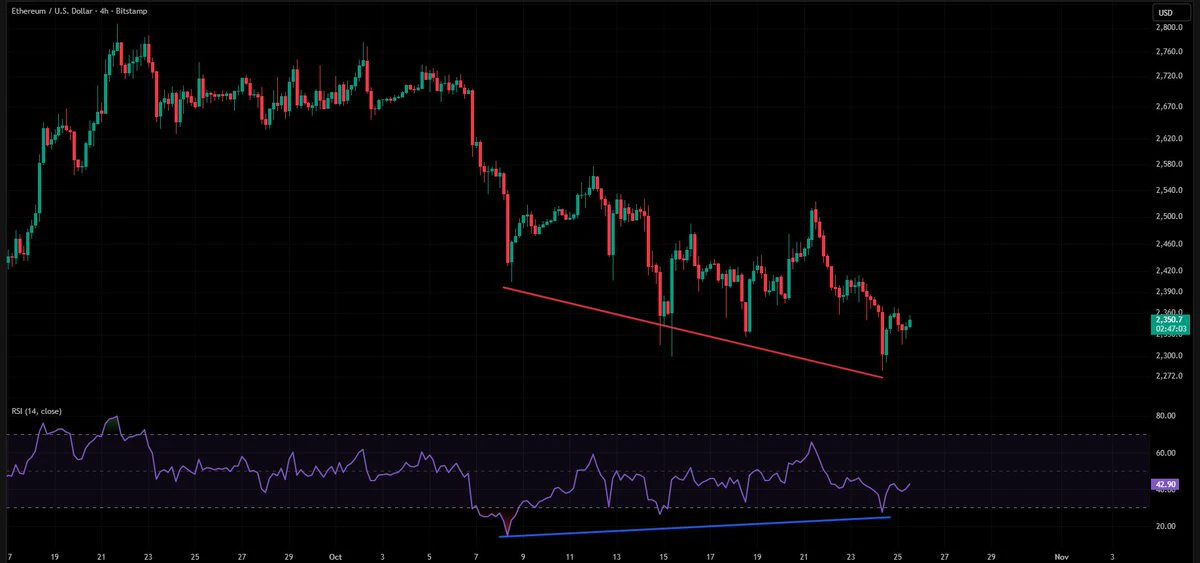
$ETH is showing bullish RSI divergence with price making a lower low while RSI forms a higher low.
Selling pressure may be fading. A break above $2,420 could trigger a relief rally towards $2,520, with a stronger reversal possible if resistance breaks.
post-image
ETH+0.67%
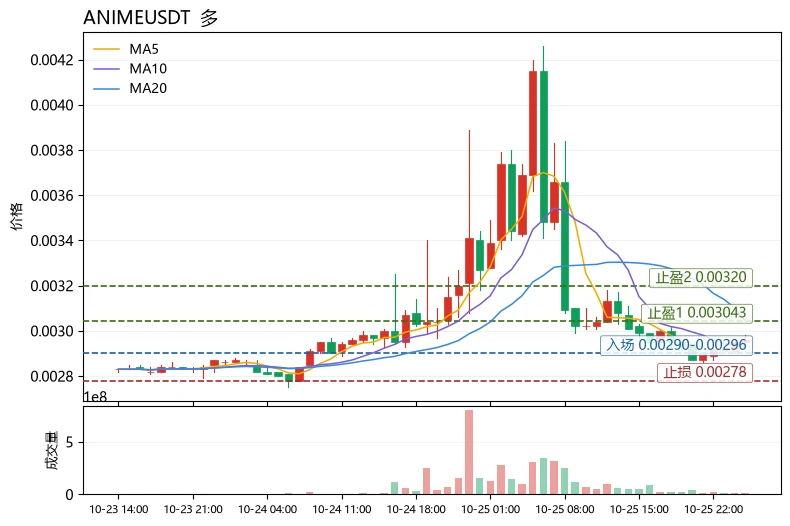
$ANIME The most unusual detail today isn’t the 12.68% drop, but that the funding rate was pushed down to -0.1049%—shorts are paying to hold their positions, yet the price remains below MA5=0.002928 and MA20=0.003043, while the MACD histogram at -1.505e-05 remains bearish. This is a classic “crowded shorts, but no trend reversal yet” setup. Negative funding means short costs are accumulating; if 0.002928 is reclaimed, the force of short covering will intensify. But RSI is only 45.9 and not oversold, and the Bollinger lower band at 0.002664 has yet to be tested, so the risk of a wick flushing o
post-image
ANIME-14.43%
ETH+0.67%
UNI+3.13%
The market is making it obvious to you which the upcoming market leaders will be when BTC stops acting up
All you have to do is listen
post-image
BTC+0.11%
Floki all time high hype ath go
post-image
FLOKI-1.03%
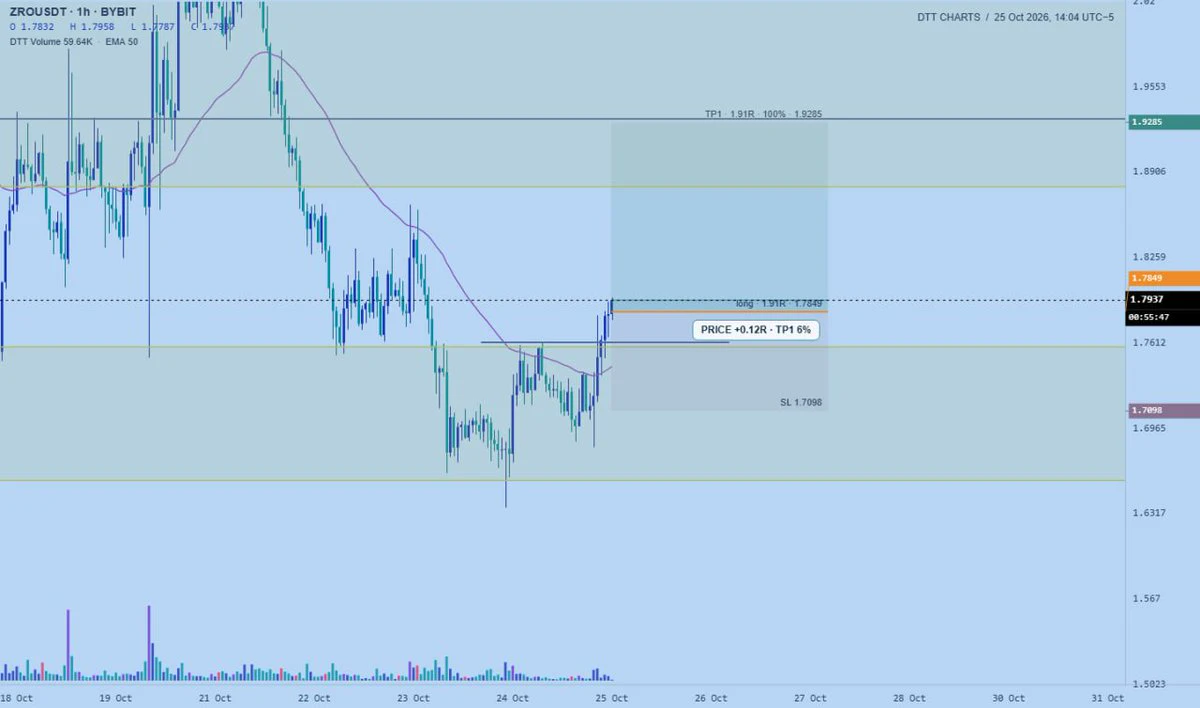
Took a long on ethereum:0x6985884c4392d348587b19cb9eaaf157f13271cd
sl: $1.7098
Tp: $1.9285
post-image
ETH+0.67%
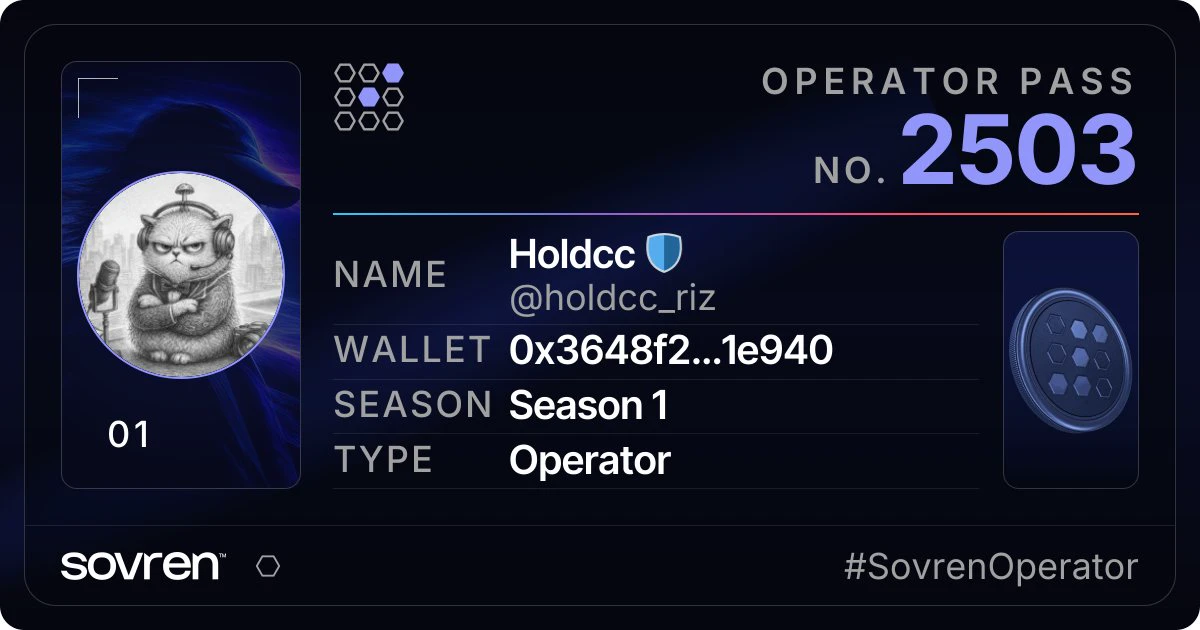
#SovrenContest Operator Pass No. 2503. Issued once, in order.
#SovrenOperator
post-image
MINH, flipped and reshaped into HNIW. 30 for Hanoi.
My first AI hackathon brought no prize. I kept building.
With I want an Agentic Wallet that helps protect lending positions, within limits I choose.
My name backwards. My next step forward.
#MyAgentID
post-image
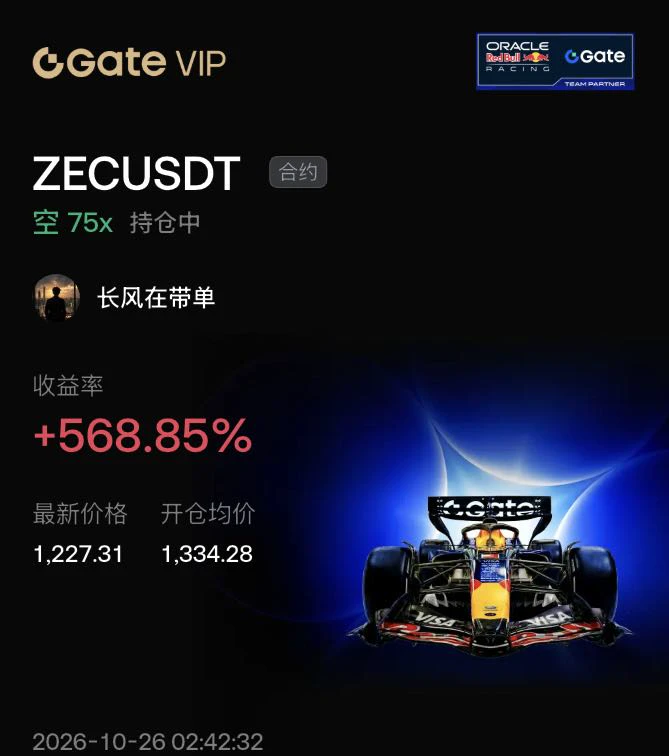
A rebound is not a reversal; $ZEC this bull-trap rally is a gift-wrapped shorting opportunity.
Recent choppy market conditions have fueled short-term recoveries in many major privacy coins. ZEC surged to test a key resistance zone overhead but failed to hold after multiple attempts. The 4-hour chart shows a clear bearish divergence, and rising volume has consistently failed to keep pace, leaving the bulls with little momentum. This rally is merely a washout rebound within a downtrend: major players are using it to lure in buyers chasing highs, before selling pressure is unleashed and pushes t
post-image
ZEC+2.95%
ORDER-19.73%
  • 1
Floki all time high hype ath go
post-image
FLOKI-1.03%
HYPE+1.49%
CRYPTO MARKET UPDATE
live-cover
LIVE1,214
An address has closed its SOL long positions and opened short positions valued at $10 million.
live-cover
LIVE406
🚨 Do you understand what happened this week..
> Friday: Brent hit $116.72, a 6 month high, on fears of a new US-Iran strike.. the Dow dropped 652 points to 52,215.. the S&P and Nasdaq both logged a 2nd straight weekly loss..
> the 10 year Treasury yield sits at 4.99%.. one tick from 5%.. the Fed decides Wednesday and futures price about a 90% chance of a hold..
> Saturday: Bitcoin slipped under $80,000 for the first time since Oct 15, low of $79,107.. over $400M of longs got wiped in 4 hours.. spot ETFs bled $773M in 2 days.. the average ETF and treasury company holder is sitting near breakev
SPX+3.13%
BTC+0.11%
AXP-3.70%
CRWD+8.19%
NET+7.35%
#GateSquareNewCreatorProgram 🚀 Gate Square New Creator Program: The Next Generation of Crypto Creators Starts Here
The crypto industry is no longer driven only by traders, analysts, developers, and investors. Today, information itself has become one of the most valuable assets in the digital economy. As millions of users enter Web3 every day, the demand for reliable analysis, educational content, market insights, breaking news, and meaningful discussions continues to grow.
This is where the GateSquareNewCreatorProgram becomes especially important.
Gate Square is creating a stronger connection
BTC+0.11%
ETH+0.67%
DYOR-3.21%
October presented a split picture for the semiconductor sector: share prices were falling while earnings were rising.
$TSM Third-quarter revenue in U.S. dollars, announced on October 15, rose 41.2% year over year, directly exceeding the top end of guidance, and the midpoint of fourth-quarter guidance implied another 14% sequential increase. But the Philadelphia Semiconductor Index had fallen 18.4% from its October 6 high by the 23rd. With the Fed, macro data, and more than a dozen earnings reports converging next week, the market's core question is: who will close this gap?
$SOXX $NVDA MU LRC
post-image
NVDA+0.44%
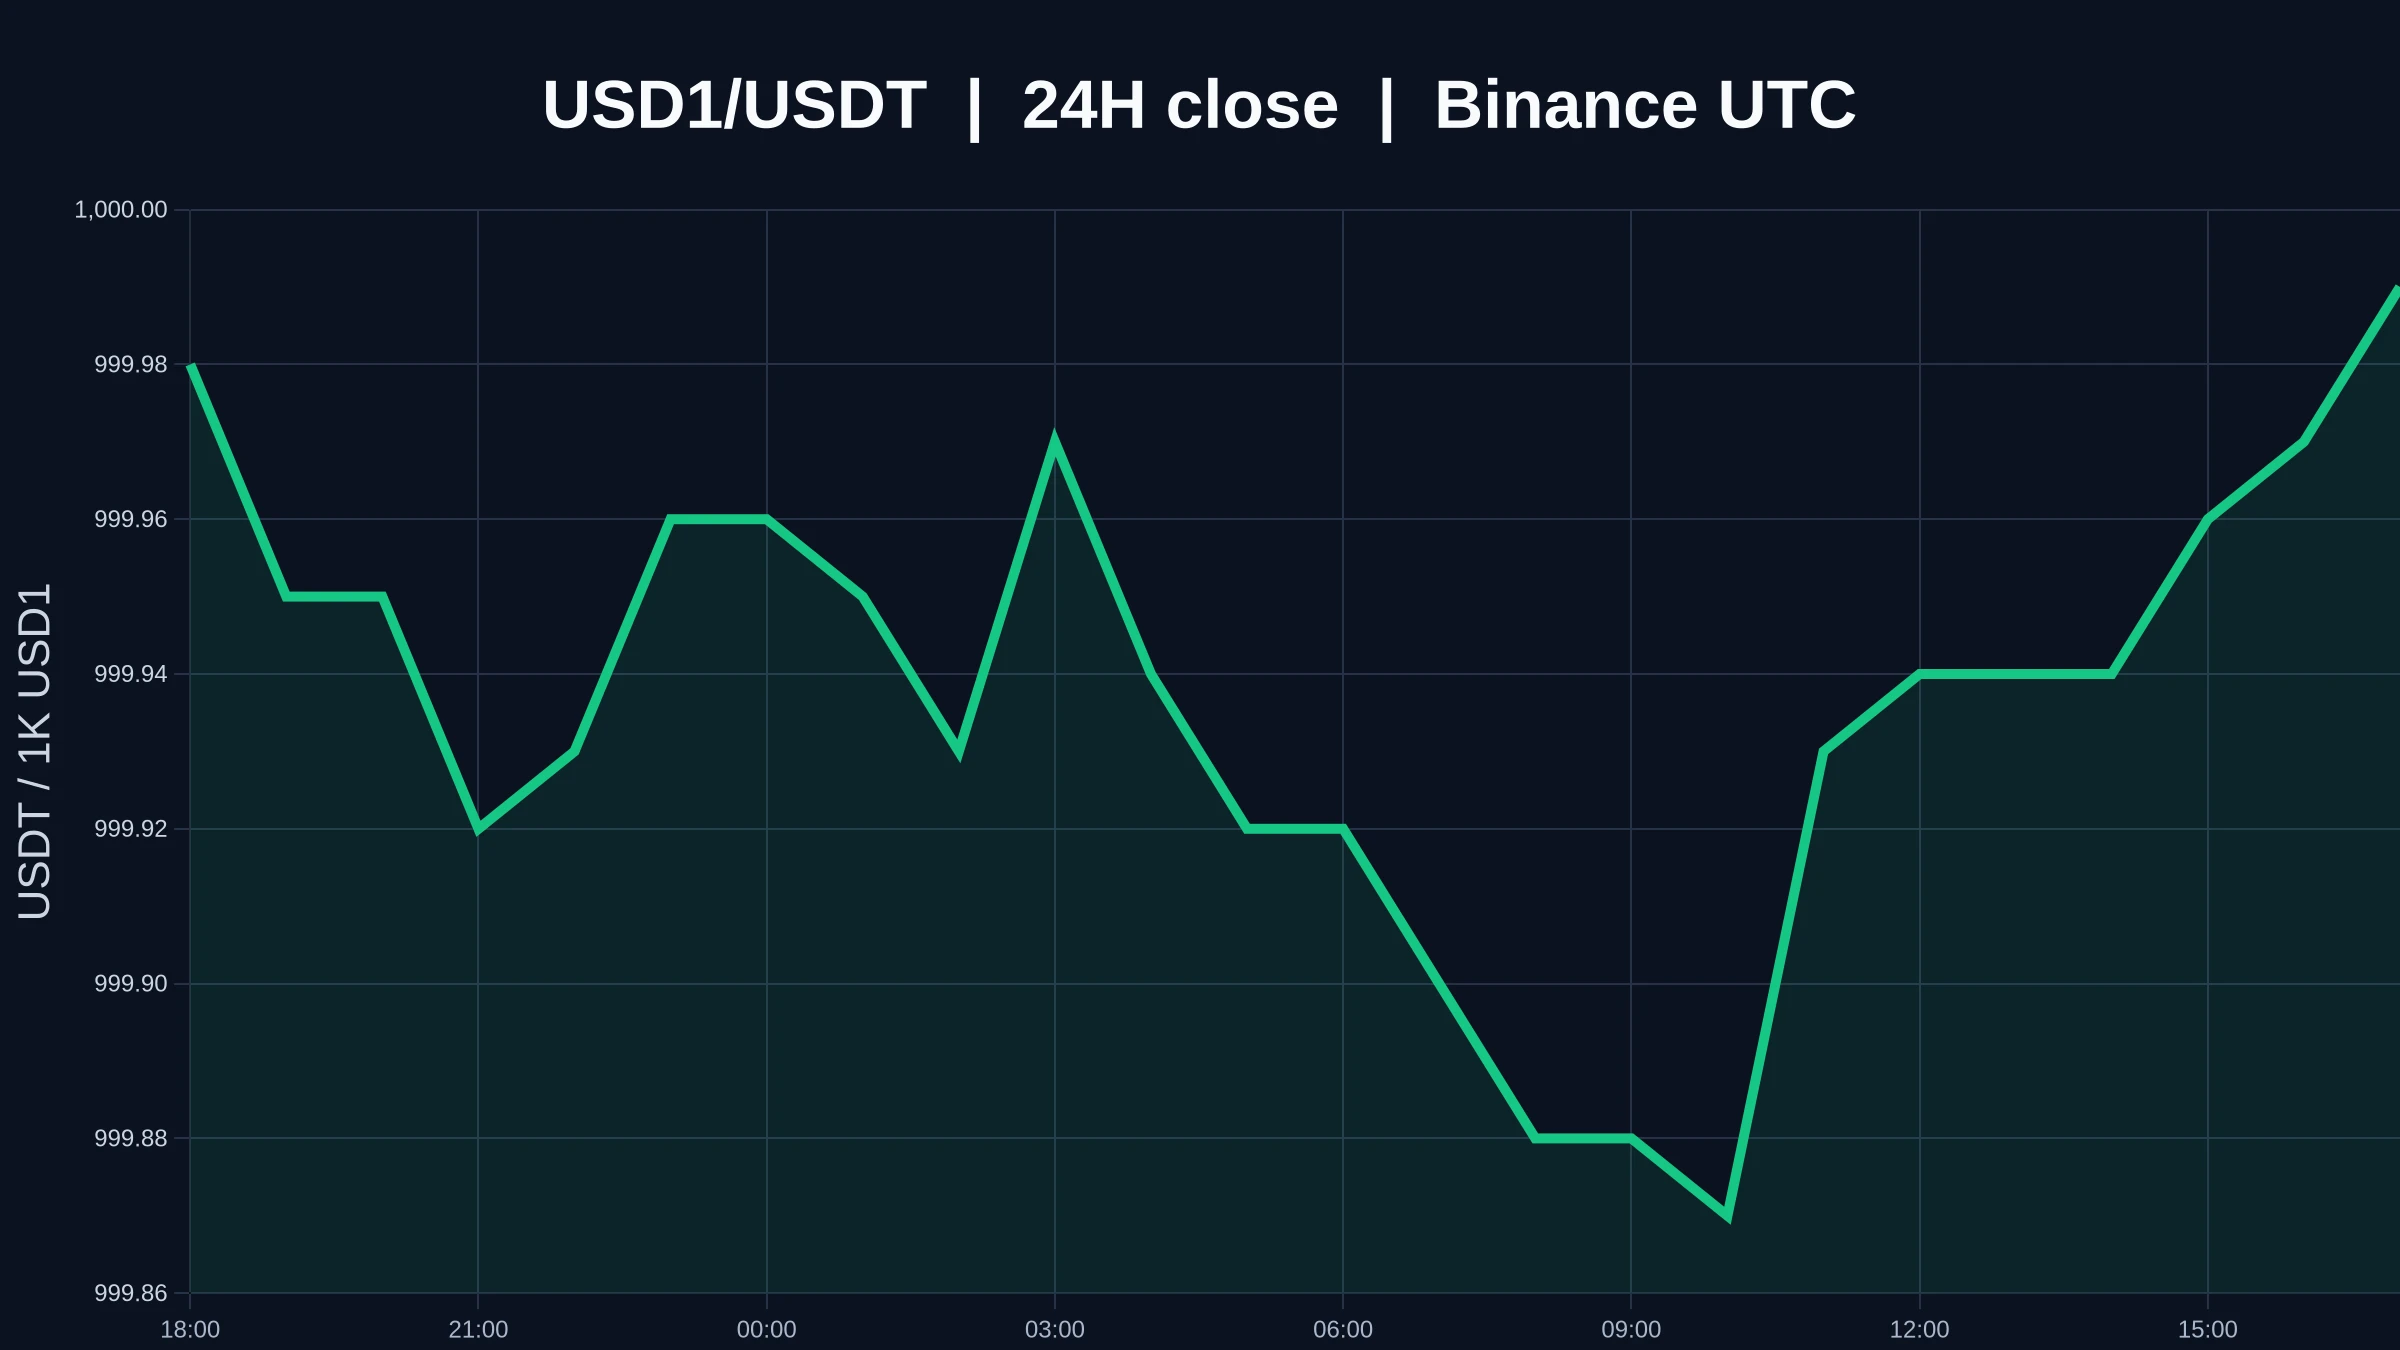
$USD1 is currently priced at 0.99998, up +0.00% over 24 hours, with volume at 0.99 times the average of the last 20 candles. Taken together, these figures show $USD1 at resistance, making it essential to clarify the three distinct steps: testing, breaking through, and holding above.
I treat the first move above resistance as a test; only holding after a retest counts as a valid breakout. Touching resistance is just a test, moving above it intraday is a breakout attempt, and only closing above it with supporting volume comes closer to a confirmed hold.
For the near-term levels, watch 0.99987 an
post-image
USD1+0.00%
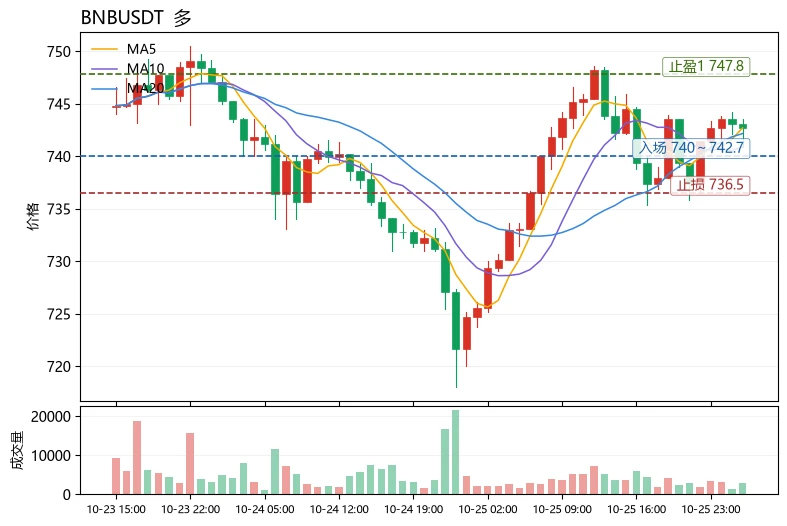
$BNB Current price 742.7, 24h +1.76%, trading volume 62.7M USDT. Technical data: MA5=742.704 is slightly above MA20=742.165; the short-term moving-average structure is bullish, but the gap is extremely narrow, indicating a weak bullish alignment. The MACD histogram remains positive at +0.06105, showing moderate momentum. RSI=54.7 is in neutral-to-strong territory and is not overbought. Bollinger Bands are [736.538, 747.792]; the price is trading just above the middle band, with the bands narrowing. The range over 30 candles is about 4.13%, indicating a narrow consolidation pattern building mo
post-image
BTC+0.11%
Load More

Join 40 M users in our growing community

⚡️ Join 40 M users in the crypto craze discussion

💬 Engage with your favorite top creators

👍 See what interests you

Trending Topics

USEarningsSeason

101.1k Views3.53k Discussing

The U.S. Q3 earnings season is in full swing, with major tech companies including Tesla and Meta reporting results. Market focus is shifting beyond revenue and profit toward AI spending, capital expenditure, margins and forward guidance. Which company’s earnings are you watching most closely?

GateWCTCS9GlobalTradingCompetition

725.41k Views8.09k Discussing

USConsumerSentimentNearRecordLow

12.39k Views301 Discussing

View More