Share your thoughts
placeholder
Article
Nobody’s watching PEPE’s quiet 4H reversal—but the data just whispered a nasty secret.

PEPE/USDT - SHORT

Trade Plan:
Entry: 0 – 0
SL: 0
TP1: 0
TP2: 0
TP3: 0

Why this setup?
- 1D trend is *range*, not bullish—so every spike is a short seller’s gift.
- RSI on 15m sits at 56.9, stalling before overbought—momentum is faking strength.
- Confidence 55 on SHORT means the edge is thin but real; entry is still “Waiting,” so we’re early, not late.
- Why now? Because range tops punish late longs—and this setup is 0.5% from a trap.

Debate:
If PEPE rejects this level, do you fade the breakout
PEPE+5.78%
A Brief Analysis of BTC’s Short-Term Trend from Dow Theory, Chan Theory, Elliott Wave Theory, Volume-Price Relationships, Order Flow, and Price Action
I. Dow Theory
Primary trend (1-hour timeframe): The primary downtrend since the historical high of 82,814 on May 6 confirmed a trend reversal in mid-August. The price began a strong rebound from the August 14 low of 62,488. After forming a double bottom at 63,979 at 03:00 on August 18, the bulls launched an epic rally. The price surged from 63,979 to the August 28 high of 81,346.95, a new high for the current phase, for a cumulative gain of 17,3
BTC+0.43%
2026‑09‑06 BTC‑USDT Perpetual Contract Technical Analysis Strategy
Key Levels
Resistance: 80500‑81000, 82000‑82400
Support: 79000‑79400, 77600‑78000
Market Overview
The daily bullish structure remains intact for now. After encountering resistance at higher levels, the market has entered a high-level range, with upward momentum gradually weakening. The 4-hour chart is locked in a tug-of-war around the 80000 level. Sunday market liquidity is relatively low, increasing the probability of wick-driven stop hunts. Avoid aggressive operations and prioritize waiting for a volume-backed breakout before
post-image
BTC+0.42%
The short position from a few days ago was somewhat painful to hold. First, a wick spike swept upward, causing a small loss. Fortunately, the position was not large, so I did not stop out immediately. I only felt relieved after the price fell back below my entry cost. My reasoning for calling the high at the time was that a lot of trapped positions had accumulated around that level, while the bulls had made several attempts to break through without any obvious volume support. Personally, I felt the momentum for further upside was limited. The market did indeed pull back afterward, and the floa
post-image
LAB+2.32%
SNDK+0.89%
Everyone’s staring at SUI’s 0.7978, but the 4h chart just whispered a secret that contradicts the 1D range.

$SUI /USDT - SHORT

Trade Plan:
Entry: 0.7954 – 0.8002
SL: 0.8212
TP1: 0.7802
TP2: 0.7685
TP3: 0.7510

Why this setup?
Why now? Bullish 15m RSI at 61.53 is a trap—it’s the last gasp before a liquidity sweep.
- ATR (0.0097) suggests low volatility, meaning a breakout is imminent.
- Our SHORT targets: TP1 at 0.7802, TP2 at 0.7685—a 3.6% drop from entry.
- The 1D range is the anchor; price is coiling for a rejection off the upper bound.

Debate:
Is the 15m RSI pump just the bait
SUI+4.22%
Just discovered a risk-free arbitrage opportunity generating tens of thousands of dollars per day from a single trade
I believe many people on robinhood have been rugged to the point of tears. Today I’m sharing an exclusive opportunity unavailable anywhere else—guaranteed profits with no losses
While the U.S. stock market was closed over the weekend, robinhood’s on-chain BONER coin surged. Because the Meme coin skyrocketed, the HIMS stock token paired with it on the robinhoodhood DEX also became massively overpriced and depegged, reaching 10x the U.S. stock’s closing price last Friday
Here’s w
MEME+2.81%
HIMS-0.32%
NVDA+0.87%
NVDAG+0.43%
NVDAON+0.44%
Everyone’s staring at the 4h chart, but the real trap is hiding in the 15m RSI—SUI is about to fake you out.

$SUI /USDT - SHORT

Trade Plan:
Entry: 0.7990 – 0.8038
SL: 0.8246
TP1: 0.7840
TP2: 0.7724
TP3: 0.7551

Why this setup?
- 1D trend is *range*, not trend—so this SHORT is a scalp, not a story.
- RSI at 46 on 15m shows zero momentum; price is drifting into the kill zone at 0.8014.
- ATR on 1h is thin (0.0096)—low volatility means the first TP at 0.7840 is likely, but TP3 at 0.7551 needs a catalyst.
- Why now? The “Armed” status with SL at 0.8246 gives you a 2.9R risk-reward befor
SUI+4.22%
Day 156 of 1Piece365’s DCA,
All crew members are running along the golden road of the Pirate King!
Every crew member is the helmsman,
This sea of stars is ruled by you and me!
#海贼王 #1Piece365天 DCA
Most traders will fade this ONDO breakout—that’s exactly why 95% confidence scares me.

$ONDO /USDT - LONG

Trade Plan:
Entry: 0.3743 – 0.3761
SL: 0.3665
TP1: 0.3817
TP2: 0.3861
TP3: 0.3926

Why this setup?
- 4H bias is LONG with 95% confidence, but the 15m RSI at 62.07 isn’t overbought—room to run.
- Entry ref 0.3752, TP1 0.3817 (+1.7%), TP2 0.3861 (+2.9%), TP3 0.3926 (+4.6%).
- Daily trend is bullish; SL at 0.3665 keeps risk tight (2.3%).
- Why now? Price is coiling inside 0.3743–0.3761—a compression that typically precedes expansion.

Debate:
If the 1D trend is bullish but RSI is
post-image
ONDO+1.63%
This $CHIP long has gone more smoothly than expected, with unrealized profit reaching a key level of +575.4%. I didn’t get greedy and took profit on 70% of the position around 0.06019, while moving the protection level for the remaining 30% above the entry price.

That small remaining position is just to give it a chance to keep performing, but I won’t give it room to swallow all the profits back. Chasing longs at this point is no longer offering a favorable risk-reward ratio, because the sharper the move up from 0.05377, the more likely a wick-driven shakeout becomes afterward.

My attitude
post-image
CHIP+7.07%
SOL+2.57%
BTC+0.42%
$BULLA Signal】Long + High Funding Rate Snipe
$BULLA The funding rate has surged to 0.1008%, keeping long holding costs elevated. 4H MACD bullish momentum is contracting, while the 1H MACD death cross is widening, so short-term pullback pressure is real. The current price of 0.0827 is hovering near the 1H Bollinger middle band, with buyers not fully retreating; sell-side depth has a clear advantage in the order book (Bid/Ask Ratio 0.41), indicating a short-term tug-of-war between bulls and bears. The 4H Bollinger upper band is at 0.0921; a volume-backed breakout above this level would open up
post-image
BULLA+219.47%
BTC+0.43%
ETH+2.06%
SOL+2.56%
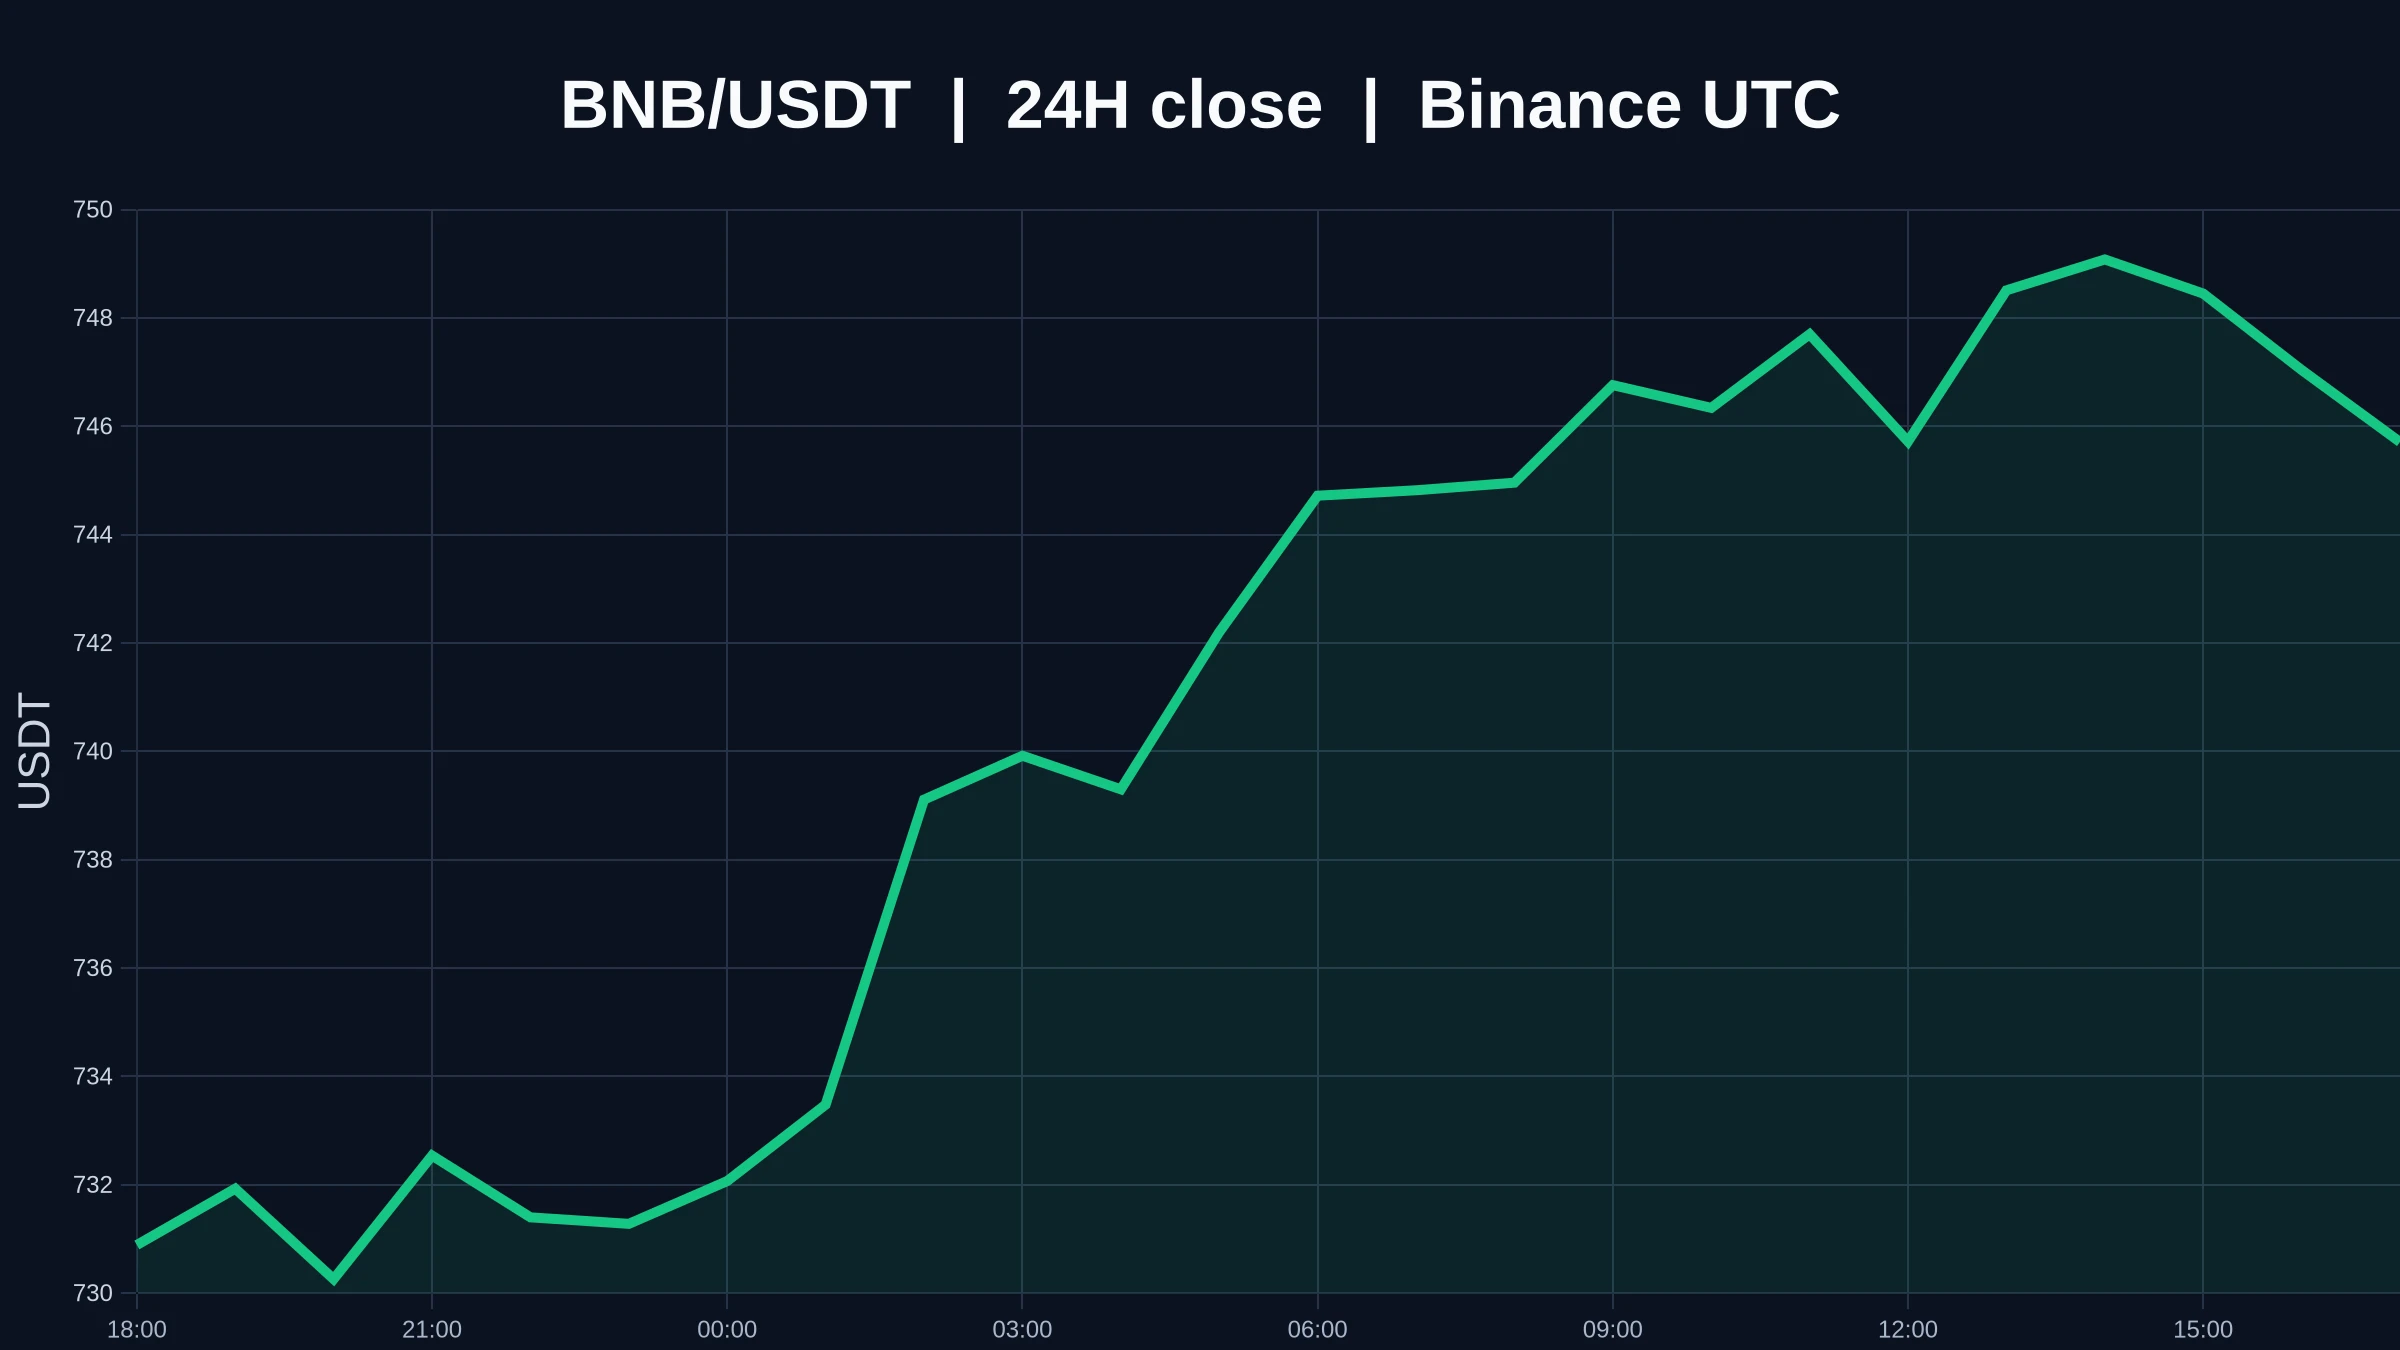
Everyone’s staring at 766—but the 4H chart just whispered a secret about BNB that most will ignore.

$BNB /USDT - SHORT

Trade Plan:
Entry: 764.81 – 767.89
SL: 785.63
TP1: 751.89
TP2: 742.25
TP3: 727.79

Why this setup?
Why now? The 1D range is your trap door. With a 77 SHORT bias and RSI at 40.9 on the 15m, momentum is bleeding, not bouncing.
- Entry zone 764.81–767.89 is the last polite goodbye before gravity.
- TP1 at 751.89 is the first crack; TP2 at 742.25 is where weak hands panic.
- ATR 6.18 says the next candle can eat 3 targets before your coffee cools.
This isn’t a dip—it’
BNB+5.96%
Everyone’s watching Bitcoin, but LTC/USDT just printed a 77% short signal that no one’s talking about.

$LTC /USDT - SHORT

Trade Plan:
Entry: 54.63 – 54.93
SL: 56.63
TP1: 53.39
TP2: 52.47
TP3: 51.08

Why this setup?
Why now?
- 4h bias is SHORT with 77.4 confidence, but the 1D trend is *range*—this isn’t a trend trade, it’s a mean-reversion play.
- RSI on 15m is 56.89—not oversold yet, so there’s room to drop before buyers step in.
- ATR 1h at 0.59 means tight stops; the real move is from entry 54.78 down to TP1 at 53.39 (-2.5%) or TP2 at 52.47 (-4.2%).
- If price breaks below 54.63
LTC+5.36%
BNB Surpasses 770USD
live-cover
LIVE1,025
While holding this trade, the floating profit pulled back at times, but I did not rush to adjust the position. At the time, $WLD was merely digesting its short-term gains; the broader structure had not broken down. The real risk was not a pullback in floating profit, but failing to recognize a reversal in direction.

I entered the long position around 0.3736. There were several sharp drops along the way, but since I had left enough room for the stop-loss and the position size was within what I could afford to bear, I ultimately held on. After the price climbed back up and the floating profit
post-image
WLD+3.79%
ZEC+3.67%
BNB+5.96%
The market moved more decisively than expected. After this $GIGGLE pullback stabilized, I added back to my long position as planned, entering around 37.23. At the time, the only basis was a clear bottoming signal in the structure: the low-volume pullback did not break the previous low.

The process was not entirely smooth. There was a fake downward wick that swept the lows, but it quickly recovered, showing that support at the lows was still present. I did not chase by adding to the position, nor was I shaken out by that wick. I patiently waited for the first target to be reached.

After loc
post-image
GIGGLE-3.65%
SNDK+0.89%
BNB+5.96%
MARKET ALERT - GWEI
​4-Hour Timeframe Analysis (4H)
​Condition: The short-term trend is tending upward (bullish recovery). The price is at 0.026826, trading above EMA20 (0.025552) and EMA50 (0.024935).
​Constraint: Rejection occurred right around EMA200 (0.027370), with a fairly long upper candle wick, indicating that selling pressure remains high in that resistance area.
​1-Day Timeframe Analysis (1H / 1D)
​Condition: The long-term trend remains in a dominant downtrend/lower consolidation phase.
​Positive Signal: The price has begun to hold and break above EMA20 (0.024854), but remains far be
GWEI+5.01%
ETH+2.06%
BTC+0.42%
  • 5
  • 1
Everyone’s long gold at 4440—but the 4h tape just whispered a dirty secret about $XAU /USDT.

$XAU /USDT - SHORT

Trade Plan:
Entry: 4435.04 – 4437.50
SL: 4448.05
TP1: 4427.44
TP2: 4421.55
TP3: 4412.72

Why this setup?
Why now? RSI on the 15m is already at 38.8 (weak bounce fuel), while the 1D trend is dead range—no rescue bid coming.
- Entry zone: 4436.27 (tight 4435–4437.5 trap).
- TP1 at 4427.44 is a 0.2% scalp; TP2 at 4421.55 is where the real pain starts.
- Stop at 4448.05 keeps risk tight (≈0.27%), but the invalidation at 4468.52 tells you the bulls are bluffing.
The setup is
XAU-0.03%
Everyone’s staring at $BTC /USDT’s pump—but the 4h tape just whispered a dirty secret nobody wants to hear.

$BTC /USDT - SHORT

Trade Plan:
Entry: 79843.6 – 79954.8
SL: 80433.1
TP1: 79498.8
TP2: 79231.9
TP3: 78831.5

Why this setup?
- RSI on the 15m is 61—overbought in a *range*, not a breakout.
- Price is pinned at 79.9k, but TP1 sits 400 points below (79.5k). Gravity wins when momentum fades.
- ATR (222) says volatility is low—this is a coiled spring, and the direction is SHORT with 55% conviction, not a coin flip.
- Why now? The 1D trend is flat, so this isn’t trend-following—it’s
BTC+0.42%
Load More

Join 40 M users in our growing community

⚡️ Join 40 M users in the crypto craze discussion

💬 Engage with your favorite top creators

👍 See what interests you

View More