
Square
Following
Hot
News
Notifications
Profile
Share your thoughts
placeholder
Article
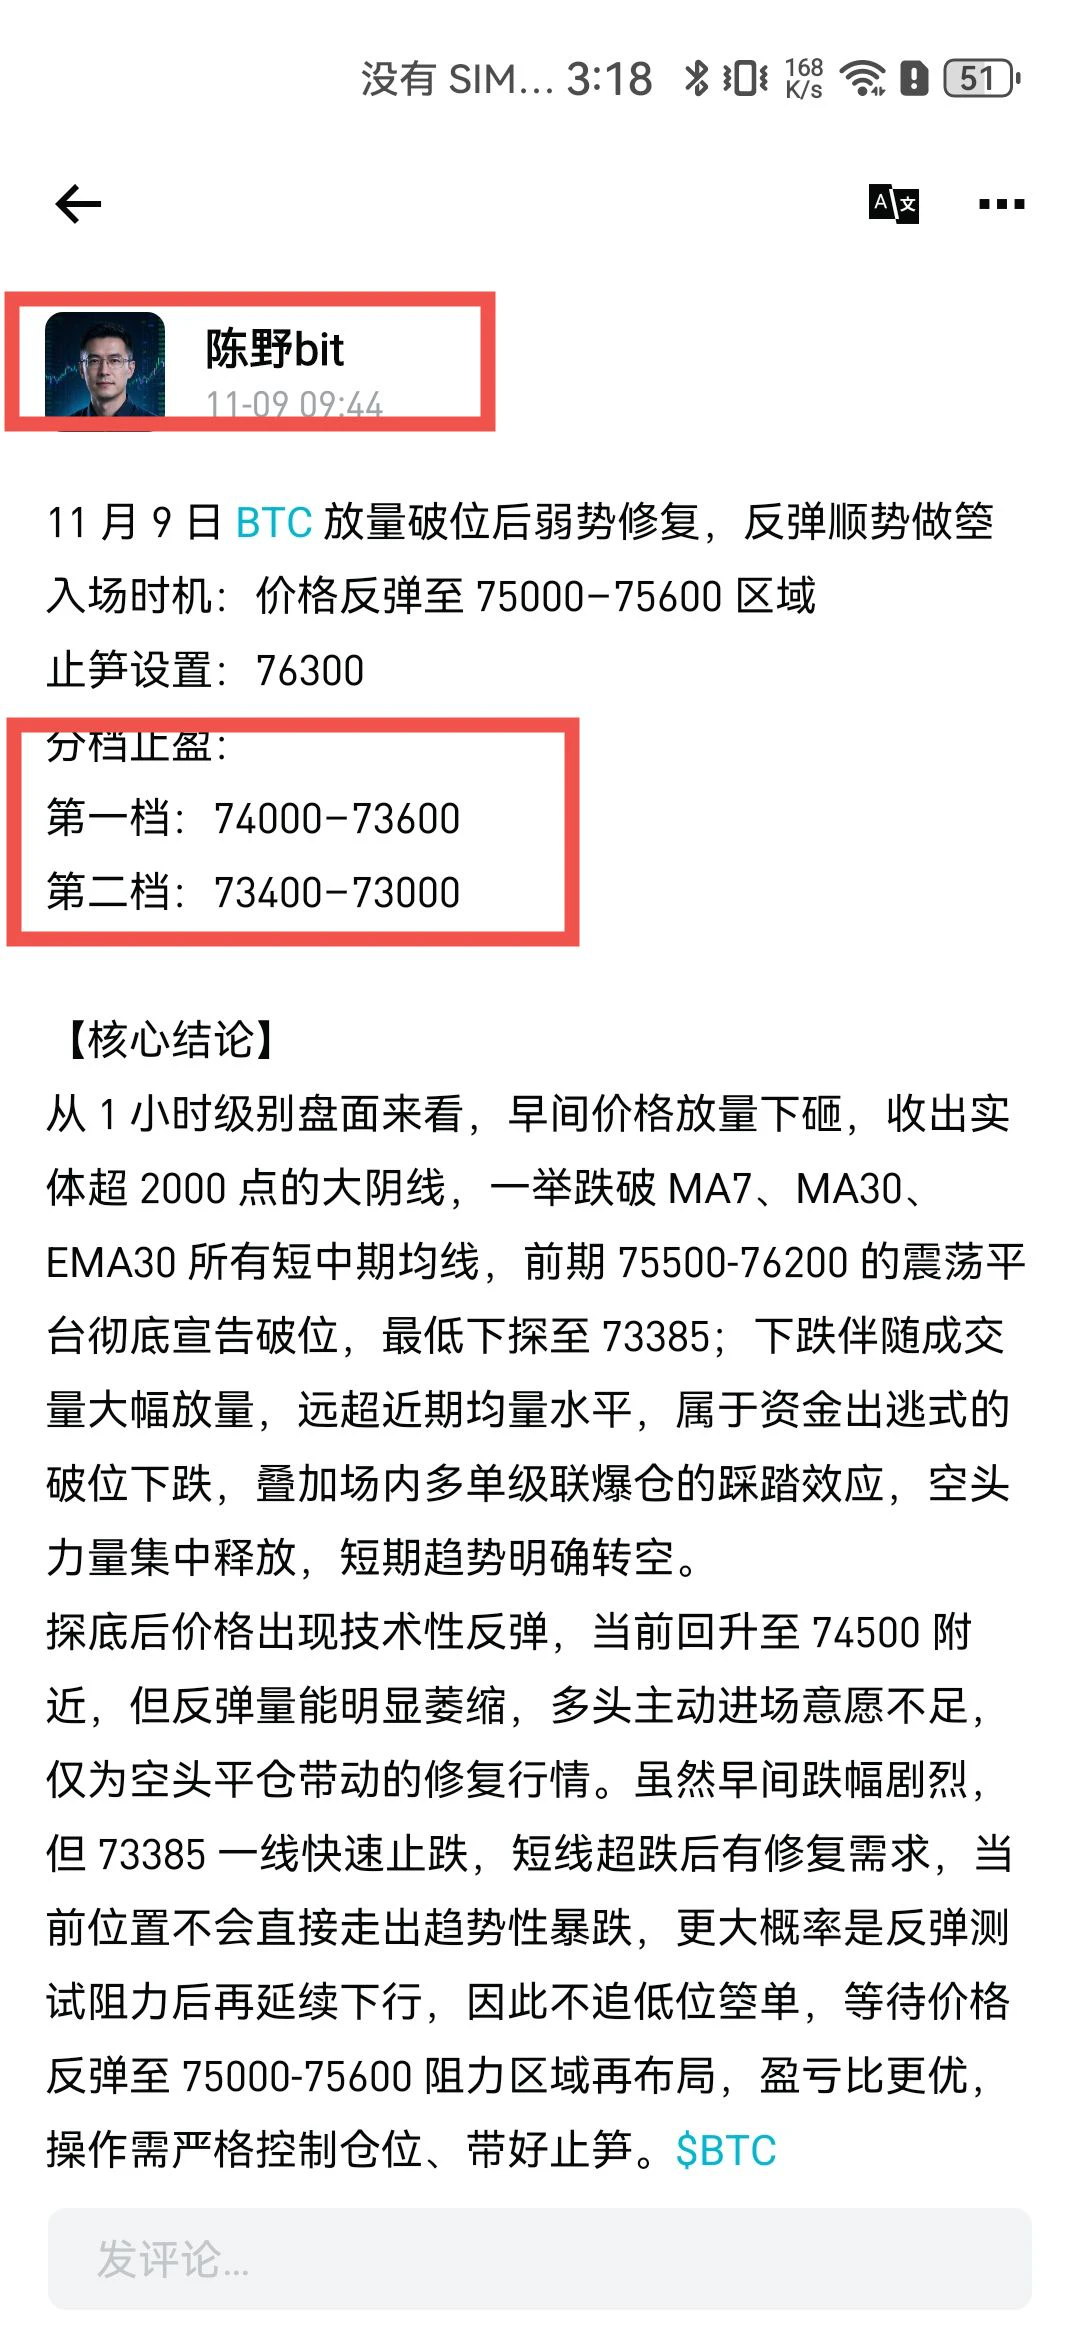
This morning’s publicly shared BTC strategy played out precisely, with every level spot-on
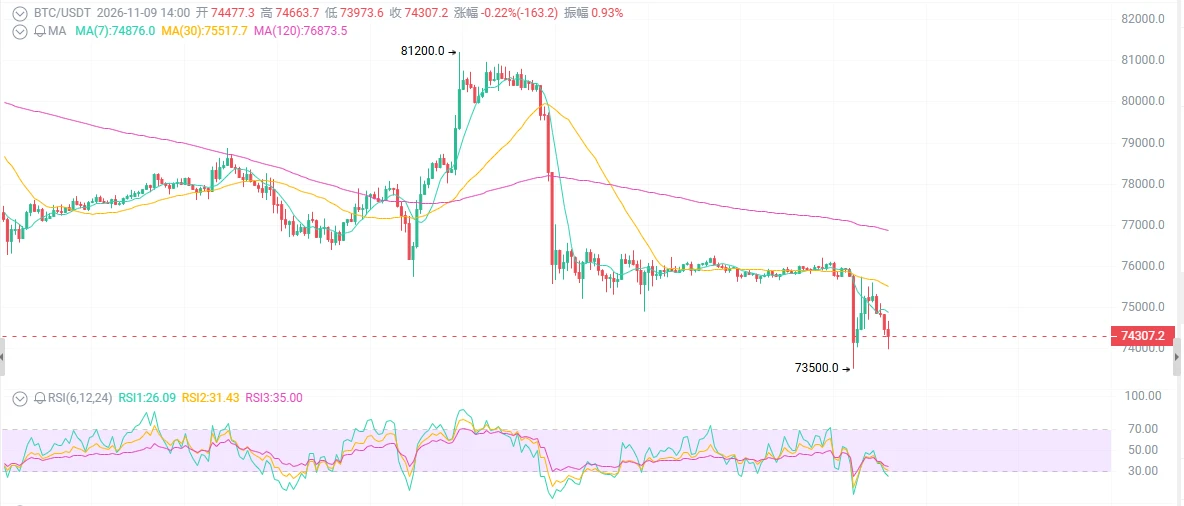
In black and white: short the rebound at 75000–75600, stop-loss at 76300, first take-profit target at 74000–73600, second target at 73400-73000.
During the day, the price rebounded to a high of 75564, hitting my entry zone exactly, then slid steadily lower, bottoming at 73385. Both take-profit targets were hit—the gains were served right up.

From 75564 to 73385: the range, direction, levels, and timing were all nailed.
A public strategy that dares to give precise levels, with no vague nonsense. In the e
post-image
BTC-0.67%
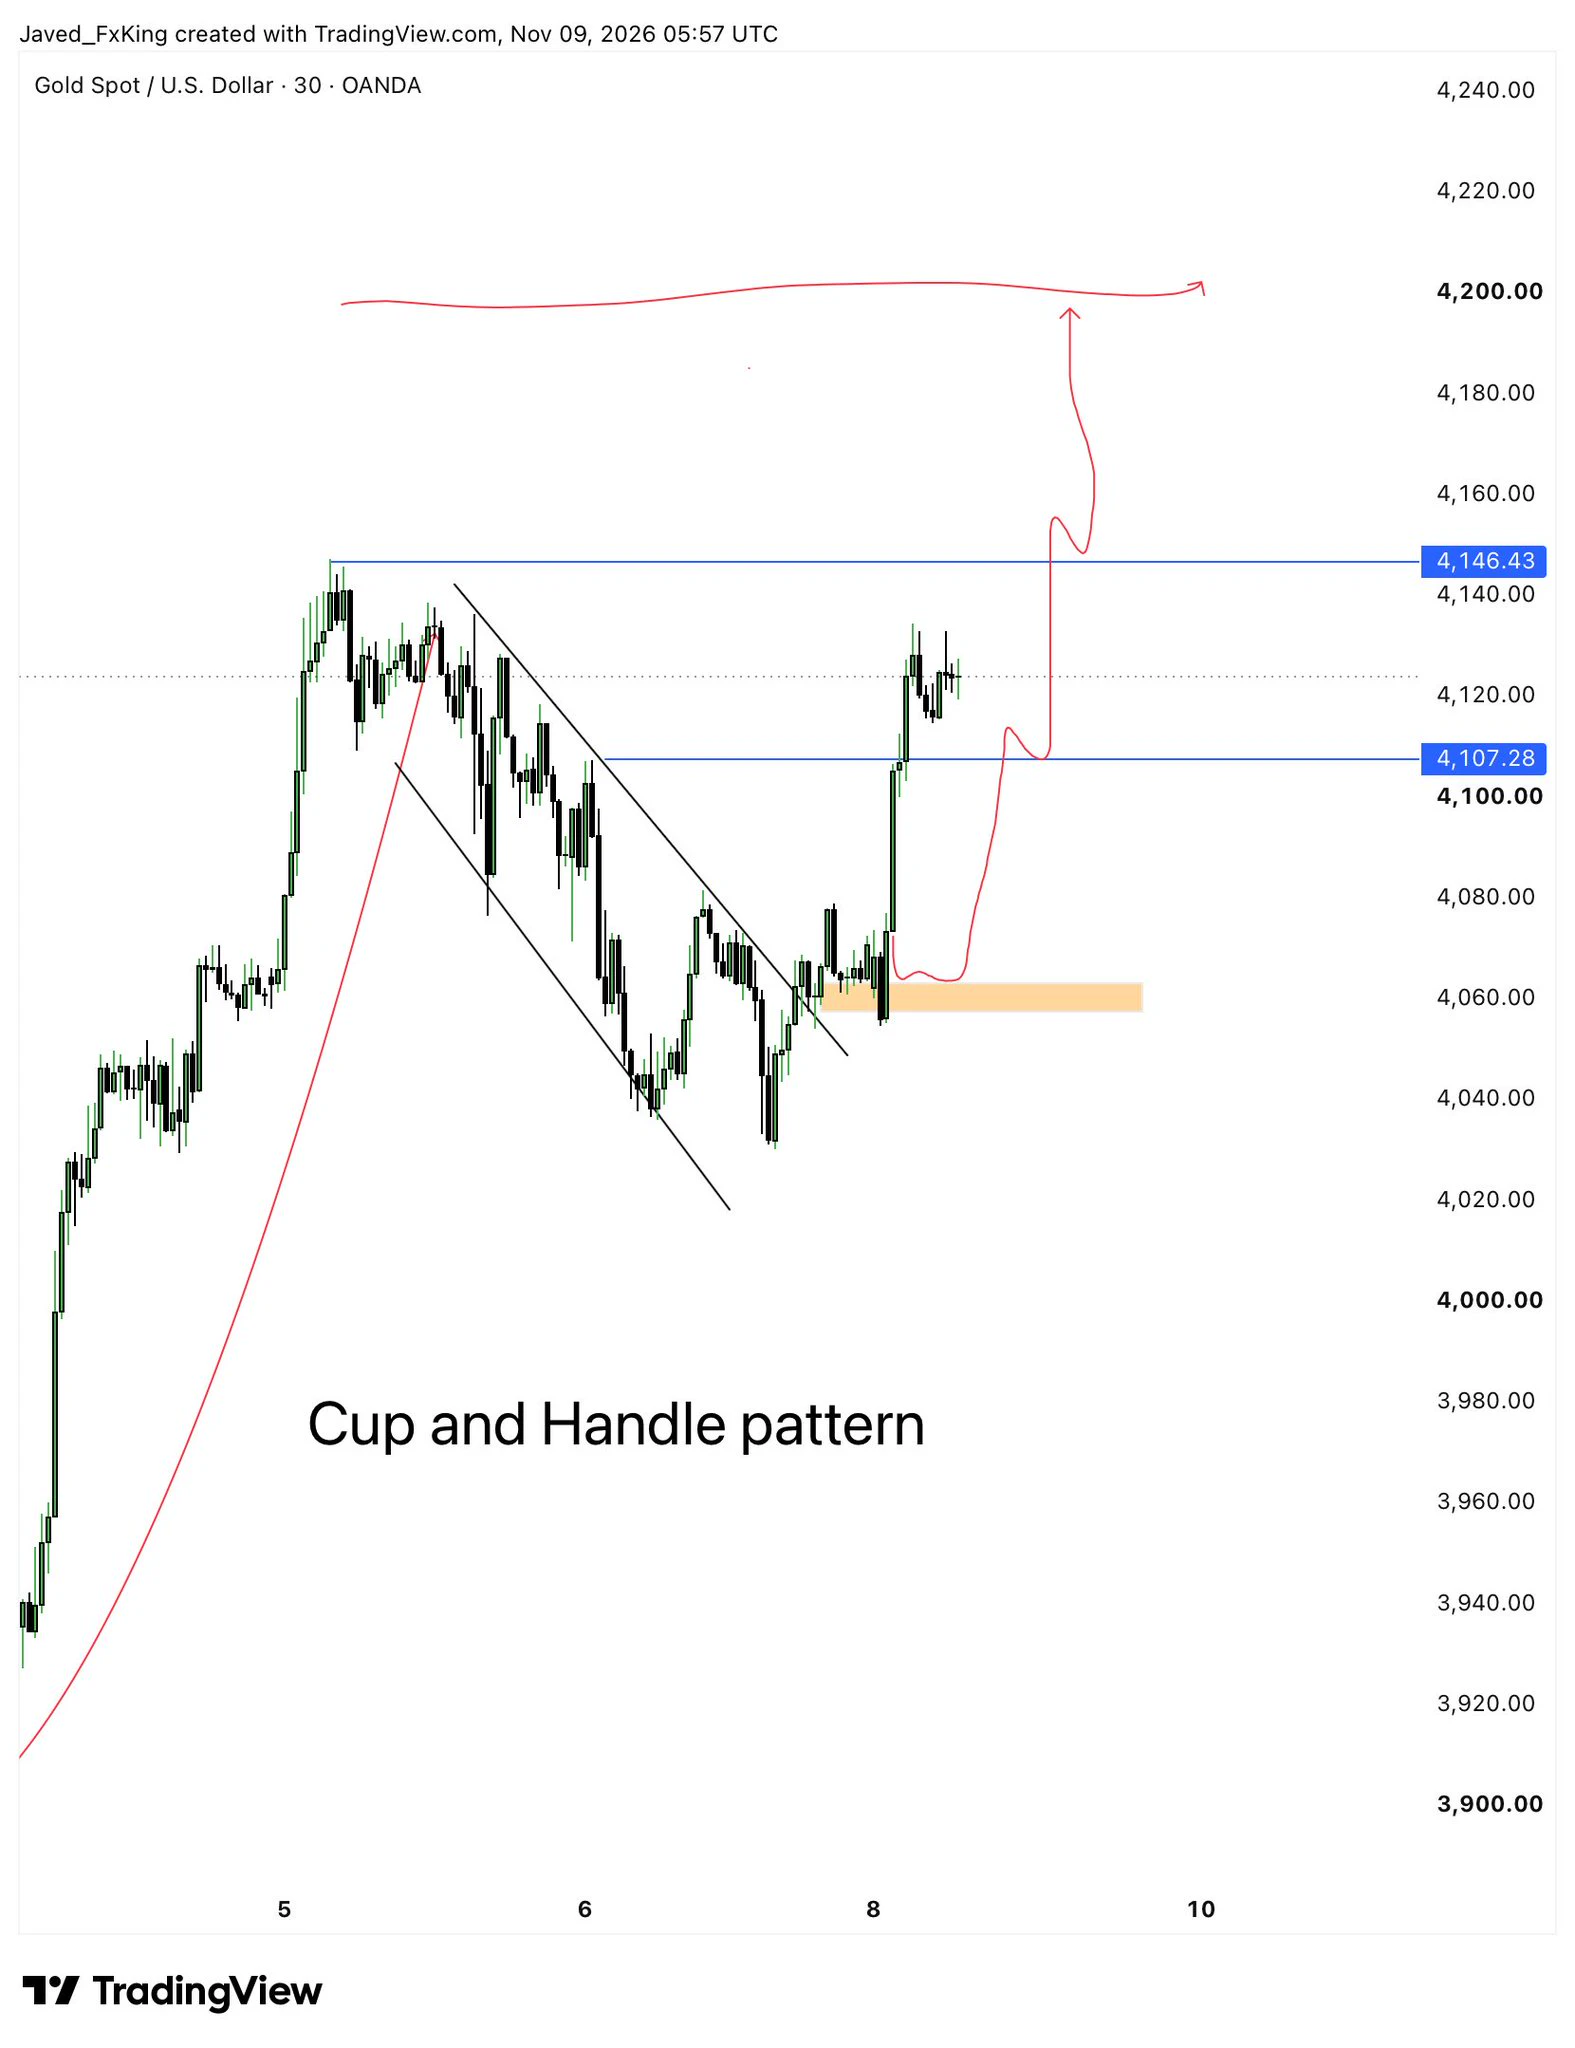
$XAUUSD I said Gold would be bullish on Monday, and it played out exactly as expected! 🔥

Technical analysis and fundamentals worked perfectly together. 💯
post-image
XAUUSD+0.54%
  • 3
  • 1
Trenches
牛逼
牛
bade
b
牛逼
0x96...7777
Market Cap
$.
Change
.
24h Vol
$.
Holders
.
ZIG
Z
bade
b
ZIG
0x8c...1145
Market Cap
$.
Change
.
24h Vol
$.
Holders
.
BTC
B
bade
b
BTC
C5xp...pump
Market Cap
$.
Change
.
24h Vol
$.
Holders
.
STONK
S
bade
b
STONK
6GmA...UNgx
Market Cap
$.
Change
.
24h Vol
$.
Holders
.
fxUSD
f
bade
b
fxUSD
0x08...d8f6
Market Cap
$.
Change
.
24h Vol
$.
Holders
.
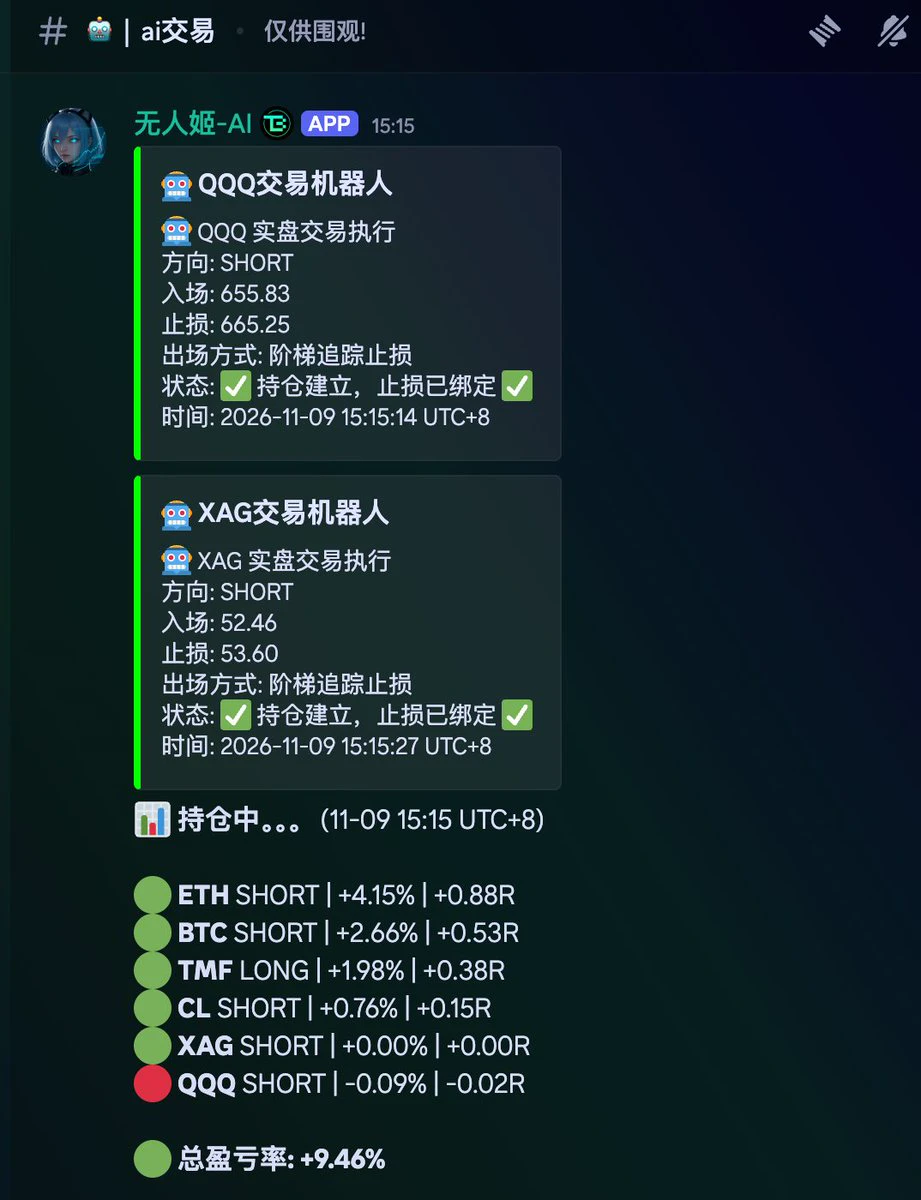
No orders over the weekend
The first trading day of the week
The bot that had been holding back for two days
Opened several orders in a row
post-image
Ethereum forecast played out as expected, with all targets hit✅
Previous setup: short on a rebound into the 2250-2280 range, with the first target at 2200 and a break below opening the way to 2150-2100.
After facing resistance at the highs, the market fell all the way down, hitting a low of 2050 and delivering a 203-point move, breaking straight through the lower end of the expected range.

Market moves are never random. Understand the cyclical structure, position with the trend, and the entire scenario plays out as planned—every part of the analysis is validated.$ETH
ETH-1.23%
HOUSE AT ??????
post-image
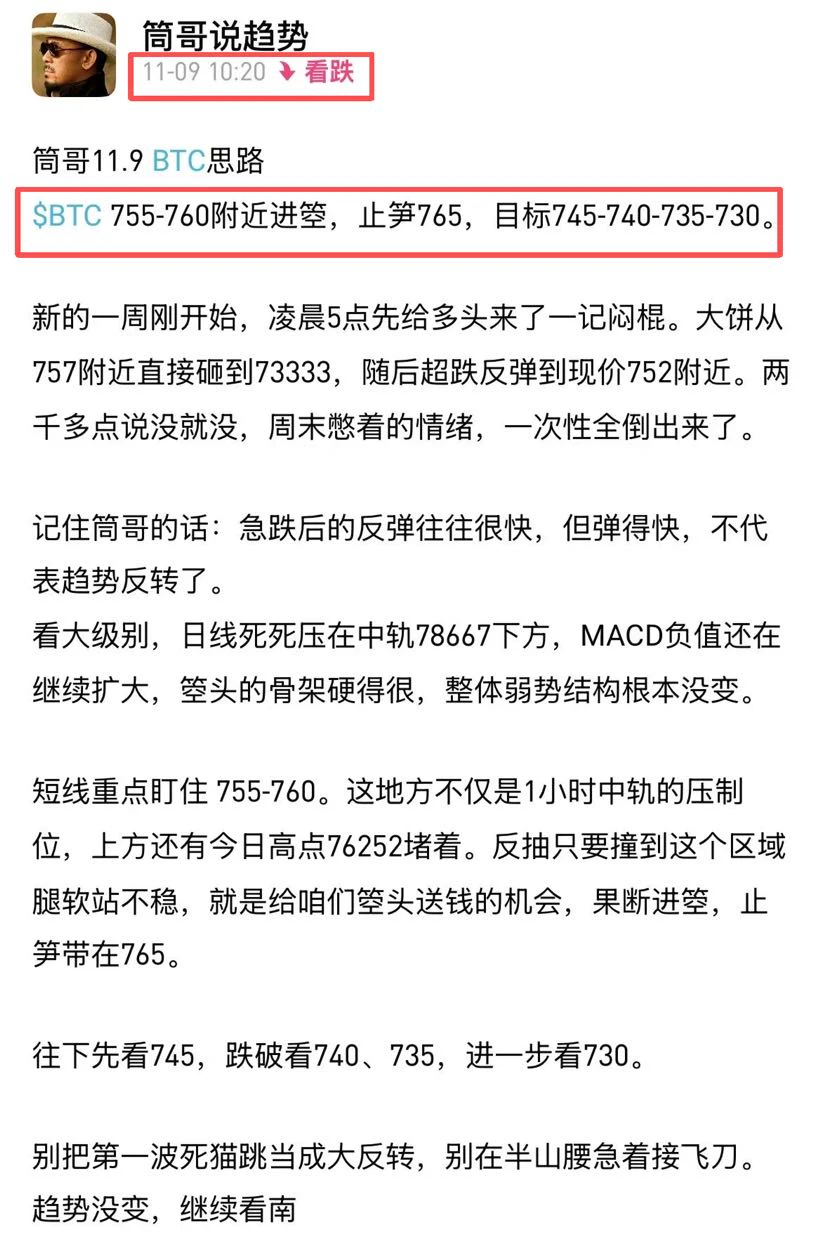
Did this morning’s oversold bounce trick plenty of people into chasing longs again?

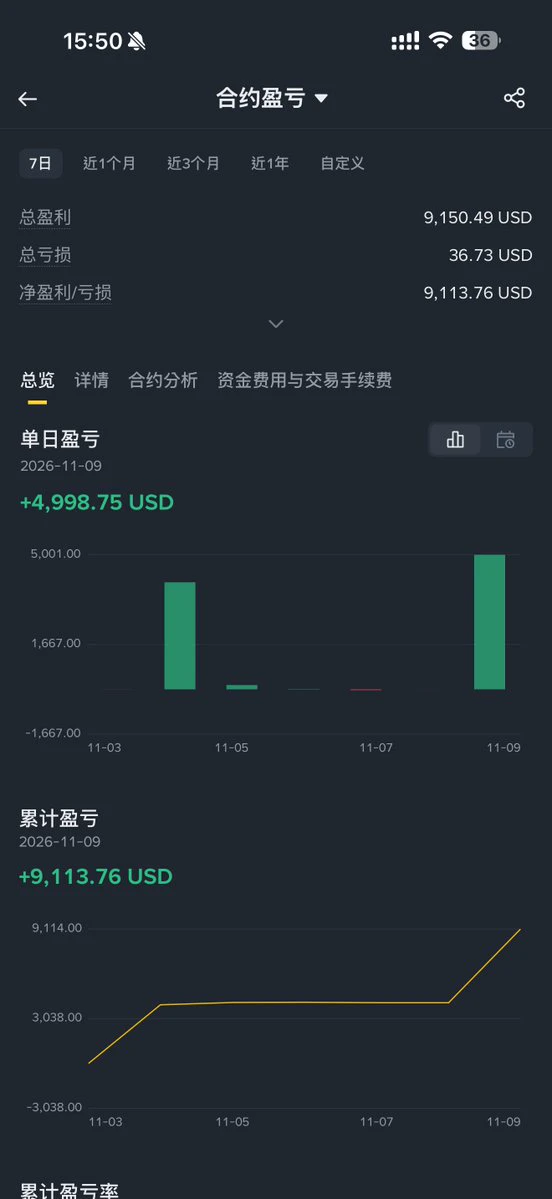
I shared my view this morning and precisely tagged 75575 at the high, before the price plunged all the way down. Current unrealized profit is now a solid 1,500 points!

The old short seller is still the same old short seller. The real value has never been in reviewing things after the fact, but in showing your hand beforehand!
The shorts keep coming—keep harvesting! $BTC $ETH
post-image
BTC-0.65%
ETH-1.23%
🌹Qiuyu has shared trading ideas every day without interruption for nearly 5 years. Over the long term, the win rate for accurate levels and direction has remained stable at 90%.📈The 5gt event this year ends tomorrow‼️ Apple users can click👇

https://www.gate.com/zh/profile/何时了秋雨

🌹In the early stage of Wave 4, the market is forming a base. The direction and levels have been clearly communicated‼️ Last week, shorted from 2395/79700 and took profit at 2080/73500📉Went long at 2080 this morning and took profit on the reversal#美国10月CPI即将公布
🚀 Everyone, go long now $AIOT ! 📍 Entry zone: 0.1590 – 0.1614. 🎯 Take-profit 1: 0.1810🎯 Take-profit 2: 0.2000🛑 Stop-loss: 0.1390
post-image
AIOT-2.28%
What Is Value at Risk (VaR)? Can It Tell Us How Much an Account Might Lose?

In cryptocurrency trading, many people calculate returns, but few seriously estimate how much their accounts could lose under adverse market conditions. Value at Risk (VaR) is a common risk measurement tool that helps us understand potential losses from a probability perspective.

First, what exactly is VaR?

VaR is typically used to estimate the potential loss threshold for a specific position over a given time horizon and at a given confidence level. For example, a one-day 95% VaR of 1,000 USDT for an account means
post-image
This B market is really tough to trade
We need to watch out for US stocks and the news cycle; now we also have to watch out for the CEO affair scandal 😅
post-image
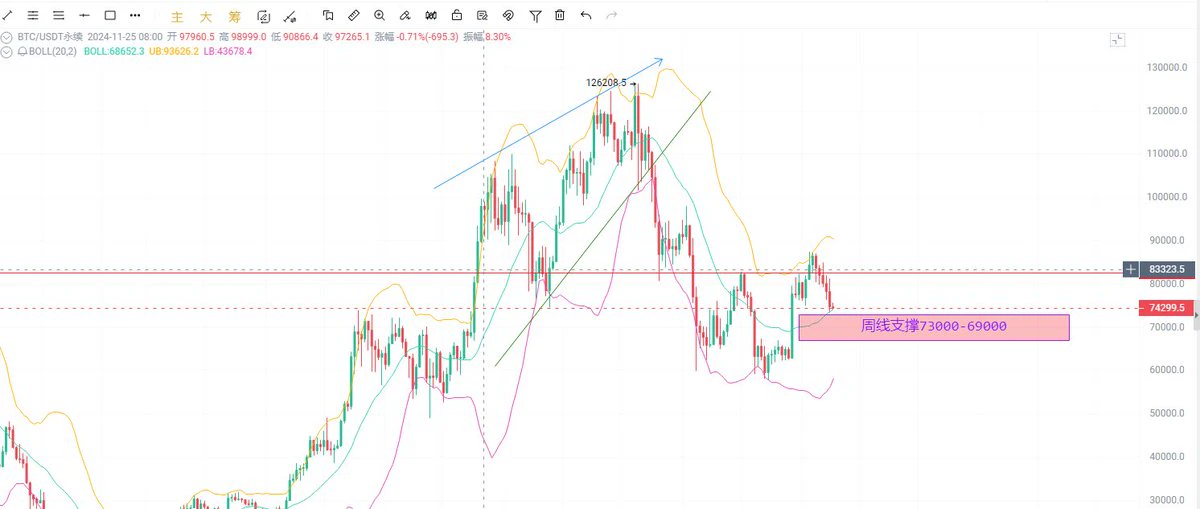
The decline from 87380 on the weekly timeframe should be viewed as a weekly correction. It has already fallen $14,000 and closed down for five consecutive weeks. Once the correction is over, the uptrend will continue. Don’t under any circumstances treat 87000 as the top, or this week’s buy-the-dip strategy will be over.
post-image
  • 2
TODAY LIVE TECNICAL WITH SIGNALS
live-cover
LIVE2,002
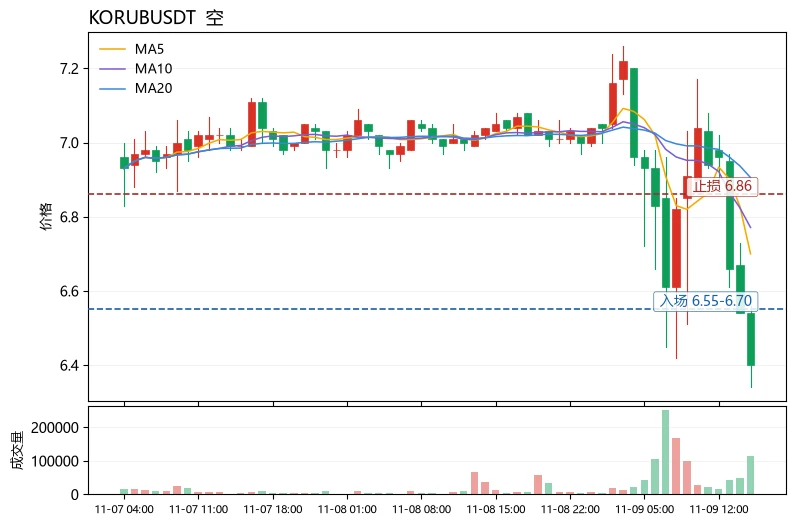
$KORUB The current price is 6.4. Key short-term levels are the Bollinger lower band at 6.50 and MA5 at 6.70. The price has fallen below the lower band and is tracking along it, indicating a weak structure dominated by bearish momentum.
From a capital-flow perspective, the 24h decline is -9.09% and trading volume is 7.8M. Volume does not suggest panic selling, but rather passive position reductions by bulls. MA5 at 6.70 is below MA20 at 6.9055, with the moving averages in a bearish alignment. RSI at 31.0 is near oversold but shows no divergence, while the MACD histogram at -0.05065 is still exp
post-image
KORUB
KORUBSouth Korea Bull
Four.meme
MC:$3.67KHolders:1
0%
SOL-0.77%
ADA-1.48%
#MU# Micron's support level of 669.3 mentioned on November 5 has been reached. It found support and saw a small-scale rebound. Can the rebound extend? Monitoring points shared in image 2. ​​​$MU ‌
MU-0.63%
#晒出我的持仓收益
Can we sell this now? Should we flip long for a bit?
post-image
  • 6
BTC at $74,300—would you still dare to buy the dip?
ETFs saw $1.28 billion in outflows in one week, over $1 billion in longs were liquidated, and the weekly chart posted five straight down weeks—everyone is shouting, “The bear market is here.” But is the $73,000 level really institutions’ cost-basis floor, or the next meat grinder?

First, the surface picture: the drop looks ugly, but it hasn’t collapsed.

It fell 1.5%-2% in 24 hours, hitting a low of 73,500. The daily chart has posted consecutive bearish candles, the weekly chart its fifth straight red candle, and price has broken below the 5
post-image
BTC-0.67%
ETH-1.26%
SOL-0.77%
🔹Sudden flash crash before BTC’s weekly close! A wick down to $73,510, with $715 million in long po
live-cover
LIVE4,447
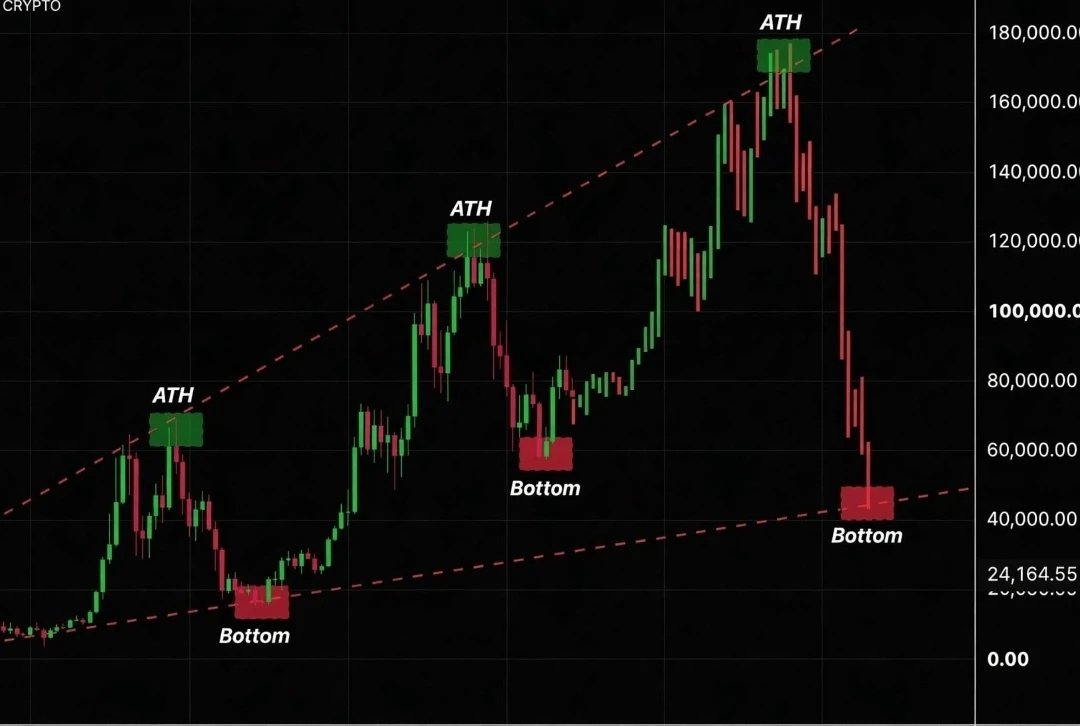
🚨 #bitcoin is setting the same trap as in 2018 and 2022.
and i think the next move could make millionaires.
look at this chart.
2018: crash → recovery → new high.
2022: crash → recovery → new high.
2026: crash → recovery → new high?
different years. same story.
first, bitcoin crashes.
normal traders panic.
everyone says crypto is dead.
then selling slowly stops.
$BTC starts to recover slowly.
but nobody believes it.
"just a fake pump."
then bitcoin breaks the resistance.
post-image
BTC-0.67%
#美伊谈判出现新进展
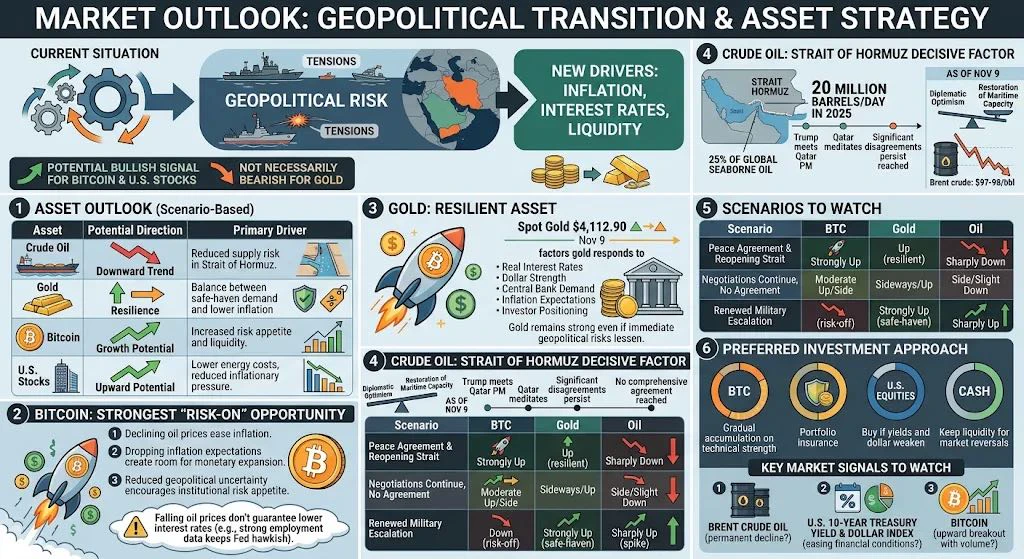
My market outlook: This situation serves as a potentially bullish signal for Bitcoin and U.S. stocks; however, it does not necessarily imply a bearish outlook for gold. The key distinction here is whether the diplomatic progress between the U.S. and Iran will lead to a lasting de-escalation of geopolitical tensions, or if it will merely create a temporary sense of optimism.

I view this as a transition from a market driven by geopolitical risk to one focused on inflation, interest rates, and liquidity.

1. What might happen next?

Asset Potential direction Primary driver
Crude oil
post-image
BTC-0.67%
XAUUSD+0.54%
XBRUSD-1.30%
  • 13
  • 1
Load More

Join 40 M users in our growing community

⚡️ Join 40 M users in the crypto craze discussion

💬 Engage with your favorite top creators

👍 See what interests you

Trending Topics

USCPIDataIncoming

28.2k Views1.85k Discussing

The U.S. October CPI report will be released on November 10 at 8:30 a.m. ET. September CPI came in at 3.7% year over year, and markets will be watching closely for signs that inflation is cooling, especially in core CPI. A softer-than-expected reading could strengthen rate-cut expectations, while hotter inflation may pressure risk assets through higher Treasury yields and a stronger dollar. How do you think this CPI print will move $BTC, U.S. stocks and gold?

RedBullDoublePodiumInBrazil

1.76k Views30.52k Discussing

BTCFlashCrash

72.71k Views66.23k Discussing

View More