Share your thoughts
placeholder
Article
Crypto Market Updates
live-cover
LIVE1,530
CRYPTO THINGS YOU MAY HAVE MISSED — LAST 24 HOURS | 5 SEPTEMBER 2026
The market looked weak—but institutions quietly poured more than $1.2B into bitcoin:native and $ETH funds last week.
The price and capital flows are telling different stories.
🧵👇
1/2 — ETF DEMAND SURVIVED THE MACRO SHOCK
US spot ETFs recorded approximately:
🟢 bitcoin:native: $986.7M weekly net inflow
🟢 $ETH: $215.3M weekly net inflow
🟢 Combined: $1.20B
Friday alone added $174.6M to Bitcoin funds and $25.9M to Ethereum funds—even after the stronger payroll report increased Fed-hike risk.
Investor takeaway: institutions co
post-image
BTC-2.35%
ETH-2.49%
HBAR+2.91%
XLM+2.77%
XDC+1.30%
Is this even a rebound? It’s CPR for my account, isn’t it? $ZKC It just touched 0.0497, with +12.88% secured. I stared at the screen for several seconds to make sure I had the right account.

When I opened the charts this morning, buying pressure had clearly strengthened, and each pullback was getting smaller and smaller. This was obviously not an ordinary dead-cat bounce. Around 0.04953, I put it plainly: the risk-reward at this level was good enough; if wrong, take the loss, and if right, it’s a big payday.

Looking back now, the timing was spot-on. As for the position management: I took 7
post-image
ZKC+1.31%
XRP+1.13%
BTC+0.08%
Everyone’s staring at 103.36—but the real trap is hiding in plain sight on $SOL /USDT.

$SOL /USDT - SHORT

Trade Plan:
Entry: 103.18 – 103.54
SL: 105.05
TP1: 102.09
TP2: 101.25
TP3: 99.98

Why this setup?
- The 4h frame says SHORT, but confidence is just 55—this is a knife-edge, not a conviction.
- RSI on 15m (45.75) is dead neutral: no panic, no euphoria—just a coiled spring.
- ATR 1h at 0.70 means the next 4 candles could fake you out before the real move.
- Why now? The range on 1D is the anchor—we’re bouncing inside it, and TP1 at 102.09 is the first magnet, but a break below 102
SOL+1.23%
FORCED LIQUIDATION
$NIKE
post-image
NKE-0.24%
  • 3
Everyone’s chasing longs on $SOL /USDT, but the 4h tape is quietly whispering a different name.

$SOL /USDT - SHORT

Trade Plan:
Entry: 103.08 – 103.44
SL: 104.95
TP1: 102.00
TP2: 101.15
TP3: 99.89

Why this setup?
- Price is pinned at 103.26 with a SHORT bias (55% confidence) while the 1D trend is *range*, not breakout.
- RSI on the 15m sits at 47.6—no momentum behind the bid, just dead air.
- ATR (1h) is a tight 0.70, meaning the next move will be violent when it comes.
- Why now? We’re sitting at the exact entry ref with invalidation at 102.46—if that cracks, the path to TP1 (102.0
SOL+1.23%
Is this even a rebound, or CPR for my empty account? But now is definitely not the time to act impulsively. When I checked the chart after lunch, $XAUT surged to the highs on no volume, with clearly insufficient buying support. I tried shorting around 4486.7: volume didn’t follow, and with no one taking the other side, it naturally had to come back down.
The current price of 4427.9 has already given the answer—+121.82% secured. It dragged its feet earlier, but the result is truly satisfying.
Don’t mess with your position either: take 80% off the table first, move the stop-loss on the remainin
post-image
XAUT+0.02%
LAB-0.12%
XRP+1.13%
$TSM
It may have survived the worst! The green zone was my entry/add zone
post-image
TSM+2.76%
$BTC Signal】1H volume contraction and pullback, funds defending the mid-band, buy-the-dip positioning
$BTC 1H volume on a single candle was 360.083 BTC, down approximately 94% from the previous round's 5951.489. The Bollinger Bands narrowed to 79347.938-79992.082, with the price fluctuating within the range. The 4H MACD histogram at -73.851 continued to decline, while the price held the 4H mid-band at 79576.620, indicating that buyers below have not retreated. The 1H MACD histogram was positive at 38.082, but not strong enough to drive a breakout. The order book Bid/Ask Ratio was 1.00, and th
post-image
BTC+0.08%
Everyone’s chasing PEPE longs—but my 4h tape just flipped a quiet SHORT signal.

PEPE/USDT - SHORT

Trade Plan:
Entry: 0 – 0
SL: 0
TP1: 0
TP2: 0
TP3: 0

Why this setup?
Why now?
- Range-bound on the daily = no trend to trust, only mean reversion.
- 15m RSI at 59.24 shows mild bullish pressure, but that’s exactly the trap before a dump.
- Confidence sits at 55.4—not screaming, but enough to fade the next pump.
- With ATR near zero, volatility is coiled; the breakout direction is down.
- Status: “Waiting”—so we’re early, not late.

Debate:
Is PEPE dropping to retest range lows, or
PEPE+2.72%
MARKET ALERT - GIGGLE
15-Minute Timeframe Analysis (Short-Term Correction)
The current price (40.89) is below EMA20 (41.30) and EMA50 (41.73), indicating a short-term corrective trend after touching a peak of 44.62. However, the price is holding just above the strong EMA200 support (40.62).
​Trading Opportunities:
​Long Scalping: Buy on weakness near the EMA200 area (40.20 - 40.60). Quick take-profit (TP) target around EMA20/EMA50 (41.50 - 42.50). Set a tight stop loss (SL) below 40.00.
​Further Option: If EMA200 breaks down, a Short opportunity opens toward the 37.50 area.
​1-Day Timeframe An
post-image
GIGGLE+0.89%
SOL+1.23%
DOGE+6.00%
  • 1
  • 1
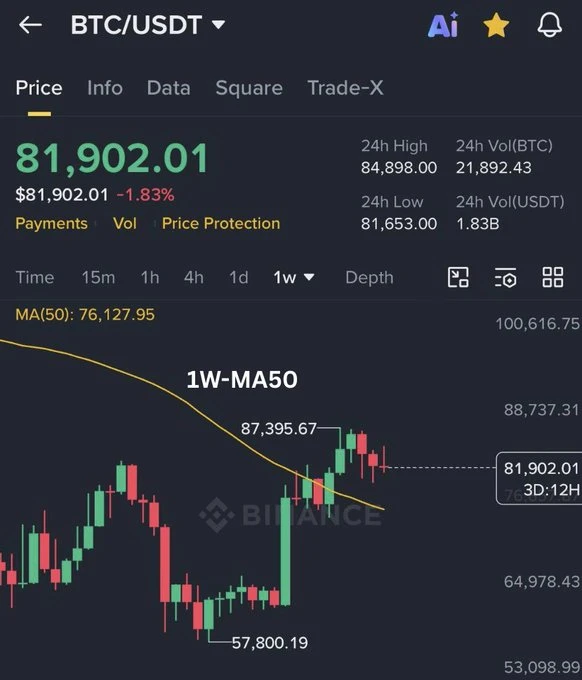
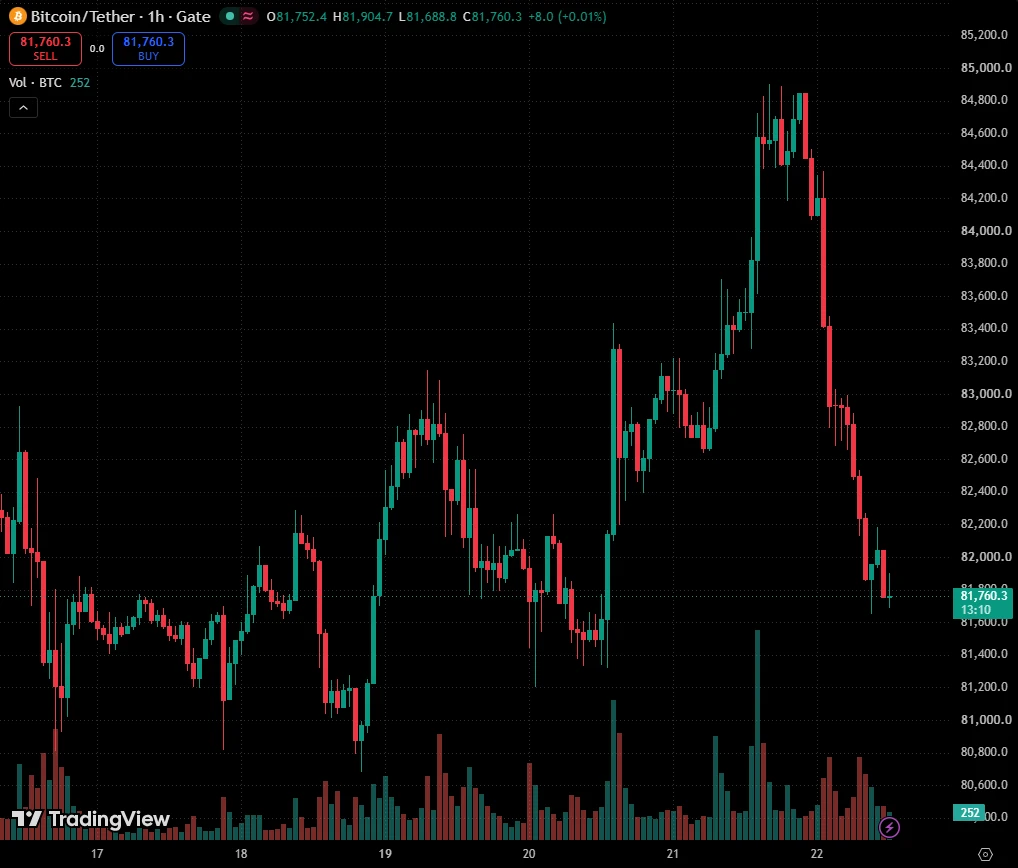
The probability of a Fed rate hike in September fell from 66% to 50% in just a few days. Fed Chair Christopher Waller sent a clear dovish signal, saying that if inflation slows further, he would support keeping rates unchanged in September. Bitcoin broke above $82,000, gold rose above $4,500, and U.S. stocks posted their biggest gain in nearly a month. What does such a sharp drop in expectations mean? How is the logic of crypto market pricing being reshaped?
Everyone’s chasing the bounce—but the 4h chart just whispered a name: LAB/USDT.

LAB/USDT - SHORT

Trade Plan:
Entry: 0.07411 – 0.07457
SL: 0.07651
TP1: 0.07271
TP2: 0.07163
TP3: 0.07000

Why this setup?
The data isn’t debating you; it’s daring you.
- 1D trend: bearish—no fakeout, just gravity.
- 95% confidence on SHORT while RSI 15m sits at 42 (weak relief, not reversal).
- ATR 1h (0.0009) says volatility is coiling—breakouts here are violent.
Why now? Entry ref 0.07434 is the line in the sand; invalidation sits a hair below at 0.07429. The trap is set for late longs.

Debate:
If
LAB+0.01%
Everyone’s watching 80K, but I’m watching the 4h chart bleed—$BTC /USDT is about to fake you out.

$BTC /USDT - SHORT

Trade Plan:
Entry: 79698.9 – 79816.3
SL: 80321.3
TP1: 79334.9
TP2: 79053.0
TP3: 78630.3

Why this setup?
Why now? The 1D is rangebound, yet the 4h structure is cracking. RSI on the 15m is at 43 and falling—no bounce fuel. ATR is tight (234), meaning the breakout is coming, not optional. Entry at 79,757 with TP2 at 79,053 is a 0.9% scalp, but the real edge is the invalidation at 79,079. If that breaks, the short thesis is dead. This is a low-confidence trap (55%), so size do
BTC+0.08%
The hand that set the stop-loss a few days ago trembled slightly; this morning I realized that was unnecessary filial piety. The last thing I saw before bed, $HEMI made a low-volume rebound to a key level, but volume failed to follow at all. I placed a short at 0.012564, set the stop-loss, and went to sleep.

When I opened the charts this morning, the price had already slid to 0.010731, locking in +287.41%; the timing was perfect, so staying up for this move was worth it. Don’t lose patience grinding through the consolidation, only to try to win back your dignity during a one-way move.

I’m
post-image
HEMI-25.21%
SNDK+2.04%
BTC+0.08%
Everyone’s staring at NEAR’s breakout, but the 15m RSI says you’re already late to the quiet part.

$NEAR /USDT - LONG

Trade Plan:
Entry: 2.1736 – 2.1968
SL: 2.0737
TP1: 2.2688
TP2: 2.3246
TP3: 2.4082

Why this setup?
- 4h structure is screaming LONG at 95% confidence, anchored at 2.1852 while the daily trend stays bullish.
- The pullback zone (2.1736–2.1968) is where wallets get filled—not after TP1 prints.
- RSI 15m at 45.64 means room to run before overbought, and ATR 0.0465 gives you a tight 4.5% stop buffer to 2.0737.
- Why now? Because waiting for TP3 (2.4082) is a luxury only
NEAR+2.49%
Everyone’s staring at $LAB /USDT’s green candles—but the 4h tape just whispered something they’ll ignore until it’s too late.

$LAB /USDT - SHORT

Trade Plan:
Entry: 0.07433 – 0.07479
SL: 0.07676
TP1: 0.07291
TP2: 0.07182
TP3: 0.07017

Why this setup?
- 95% confidence SHORT while the crowd buys the bounce.
- 1D trend is bearish; this dip is a retest, not a reversal.
- RSI 15m at 43.66 = weak relief, no momentum shift.
- Entry 0.07456 with TP1 at 0.07291—that’s 2.2% before you blink.
- Why now? ATR (0.000915) says volatility is coiling; the next push down is the expansion leg.

Deba
LAB-0.12%
$SUSHI Signal】Long - Negative funding rate short squeeze setup
$SUSHI 1H RSI 86.21, price wicked up to 0.2828 before falling back to 0.2574. 4H MACD momentum is expanding, 1H momentum is narrowing, and the upper Bollinger Band is at 0.2729. Sell pressure in the order book is slightly heavier, with the funding rate at -0.0793%; shorts continue paying, and OI is stable.
🎯Direction: Long
⚡Entry/Limit Order: 0.256628-0.257400
🛑Stop-loss: 0.254826
🚀Target 1: 0.261261
🚀Target 2: 0.263192
🛡️Trade Management:
- Execution strategy: After reaching Target 1, reduce the position by 50% and move the
post-image
SUSHI+34.21%
BTC+0.08%
ETH+1.02%
SOL+1.25%
Seems like Christmas 🎁⛄🎄
$TROLL
post-image
TROLL-22.82%
  • 2
Load More

Join 40 M users in our growing community

⚡️ Join 40 M users in the crypto craze discussion

💬 Engage with your favorite top creators

👍 See what interests you

View More